1Department of Radiology and 2Neurology, State University of Campinas - (UNICAM P), Campinas SP, Brazil. Received 14 September 2003, received in final form 19 December 2003. Accepted 20 January 2004.
Dr. Fernando Cendes - Departamento Neurologia, Faculdade de Ciências Médicas - UNICAMP. Caixa Postal 6111 - 13083-970 Campinas SP - Brasil. E-mail: [email protected]
THE PATTERN OF PROTON M AGNETIC RESONANCE
SPEC-TROSCOPY IN NON-NEOPLASTIC ENCEPHALIC LESIONS
Andréia V. Faria
1, Fabiano Reis
1, Verônica A. Zanardi
1, José R. M enezes
1, Fernando Cendes
2ABSTRACT - The purpose of this article is show the role of proton magnetic resonance spectroscopy (MRS), associated with mag-netic resonance images, in the study of non-neoplastic disorders, helping in diagnosis and better characterization of the nature of the lesion. Herein, we analyzed single voxel proton spectroscopy in eight different non-neoplastic lesions, displayed in six cate-gories (infectious, ischaemic, demyelinating, inflammatory, malformation of development and phacomatosis). The presence or the ratios of signal intensities brain tissue metabolites observed with this technique (N-acetyl aspartate, choline, creatine, lactate and lipids) helped in their differentiation with neoplastic lesions and helped in correct diagnosis. In infectious diseases, signals of acetate, succinate and aminoacids were also important. In conclusion, proton MRS is a noninvasive method, very useful as an additional technique to define the nature of non-neoplastic encephalic lesions.
KEY WORDS: spectroscopy, magnetic resonance, non-neoplastic encephalic lesions.
Padrão da espect roscopia do hidrogênio por ressonância magnét ica nas lesões encefálicas não neoplásicas
RESUMO - O propósito deste artigo é mostrar o valor da espectroscopia de hidrogênio associada a imagens de ressonância mag-nética (RM), no estudo de lesões encefálicas não neoplásicas, ajudando no diagnostico e na melhor caracterização de grupos eti-ológicos. Analisamos espectroscopias de hidrogênio com voxel único em oito diferentes doenças não neoplásicas, divididas em seis categorias (infecciosas, isquêmicas, desmielinizates, inflamatórias, malformações do desenvolvimento cortical e facomatoses). A presença e as relações entre a intensidade do sinal dos metabólitos do tecido nervoso observados com esta técnica (N-acetil aspar-tato, colina, creatina, lactato e lipídios) ajudaram na diferenciação de lesões neoplásicas e permitiram o diagnostico correto. Nas doenças infecciosas, os sinais do acetato, succinato e aminoácidos também foram importantes. Concluímos que a espectroscopia do hidrogênio por RM é um método não invasivo muito útil como técnica adicional para definir a natureza não neoplásica de lesões encefálicas.
PALAVRAS-CHAVE: espectroscopia, ressonância magnética , lesões encefálicas não neoplásicas.
Following the widespread recognition of magnetic resonance (MR) as a diagnostic method of central nervous system (CNS) pathologies, it was envisaged that it would be possible to have a differential diagnosis made solely through image analysis, considering the vast etiologic groups. However, because MR images are based on water signal and, in consequence, reflect the tissue hydration degree, MR appearance of such distinct pathologies as tumor or ischaemia can be very similar. It is in this context that proton magnetic resonance spectroscopy (MRS) arises as an auxiliary method that may help to identify the nature of some encephalic lesions1,2.
Proton M RS provides a non-invasive method for examin-ing a w ide variety of metabolites in the human brain,
includ-ing N-acetylaspartate (NAA), a compound present only in neurons; choline-containing compounds (Cho), w hich partic-ipate in membrane synthesis and degradation; phosphocre-atine and crephosphocre-atine (Cre), w hich play a major role in energy metabolism; lactate (lac), a resultant of increased anaerobic glycolysis; lipids, correlated w ith necrosis3and other such as
tiation of neoplastic lesions from other etiologies.All exams were per-formed at our M R service in the University of Campinas - UNICAM P. T1-weighted spin echo sagittal images (6 mm slice, 180° flip angle, TR (relaxation time) / TE (echo time) = 550/10, 200x350 matrix, 25x25 cm field of vision - FOV) w ere used for planing the other acquisitions. The basic MRI protocol was axial T1-weighted spin echo images (TR/TE = 540 /12), T2-w eighted double spin echo (TR/TE = 4800 /128-16) and fluid attenuation inversion recovery (FLAIR), (TR/TI
Spectra w ere post-processed using software supplied by the machine manufacturer (Elscint Prestige 2T, Haifa, Israel). After zero-filling and baseline correction, w e determined peak areas by inte-gration of the corresponding signals from N-acetyl compounds (NAA) at 2.01 parts per million (ppm), choline-base compounds (Cho) at 3.2 ppm, Creatine and phosphocreatine contained compounds (Cre) at 3.0 ppm and lactate (lac) at 1.3 ppm. Other compounds such as lipids, succinate and aminoacids w ere studied in specific cases.
RESULTS
Figures 1 to 8 summarizes the imaging and proton M RS findings in the eight patients included in this report.
Patient 1 (Fig 1) a 15 years old male patient, with headache and alteration in behavior that began 5 days before. He had a previous head trauma and subsequent cerebropinal fluid (CSF) fistula that regressed spontaneously. Computerized tomogra-phy (CT) and M R show ed a left hydrated frontal lesion w ith ring-like contrast enhancement and extensive surrounding edema.A necrotic tumor could be a differential diagnosis. MRS confirmed the hypothesis of abscess due to the presence of aminoacid peak and elevated succinate signal intensity. The lesion was surgically aspirated and culture revealed infection byPneumococcus sp.
Patient 2 (Fig 2) a 21 years old male patient, evaluated after his first episode of generalized tonic-clonic seizure. CT and RM showed solitary lesion with ring-like contrast enhancement and extensive surrounding edema. MRS showed elevated succinate levels and relative maintenance of other metabolites corrobo-rating the hypothesis of neurocysticercosis. CSF analysis showed pleocytosis and positive imunology for neurocysticercosis.There was total regression of the lesion after treatment with albenda-zol.
Patient 3 (Fig 3) a 41 years old female patient w ith loss of consciousness and right hemiplegia. CT and MRI showed a large lesion in left hemisphere w ith bleeding points. M RS corrobo-rated clinical and imaging hypothesis of subacute ischaemia due to lac peak and increased cho.
Patient 4 (Fig 4) a 22 years old female patient w ith pares-thesia that began tw o w eeks before. Neurological examina-tion revealed left hemiparesis and hypoesthesia. RM show ed a large expansive lesion in right hemisphere, with mass effect. Although neoplasm was the first hypothesis by imaging,
rel-ative maintenance of NAA peak was unusual if considering tumor. Sterotaxic biopsy showed gliosis and other non-specif-ic inflammatory abnormalities. Clinnon-specif-ical evolution, marked by relapses characterized by as aphasia, ataxia and psychomo-tor slow ing, and examination of the CSF confirmed the diag-nosis of multiple sclerosis.
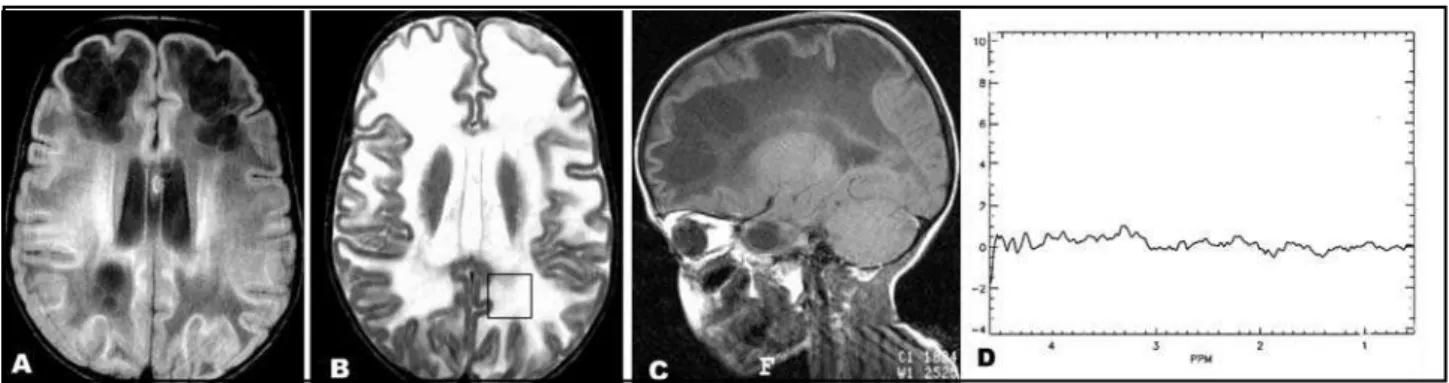
Patient 5 (Fig 5) a 5 years old girl, w ith macrocephaly w ith subtle and progressive regression in neurological develop-ment since 1 year. Brother with the same features. M R images revealed a diffuse white matter disease. MRS showed total tis-sue destruction w ith absence of all metabolites, helping in diagnosis of vanishing white matter disease.Although MR imag-ing in this patient is characteristic of white matter disease, the M RS pattern described here could help in other patients and in the follow up.
Patient 6 (Fig 6) a 19 years old female patient w ith med-ical resistant epilepsy. MR images showed a mass with the same characteristics of gray matter. Although this pattern is char-acteristic of subcortical heterotopia, the normal M RS pattern illustrated here could help in other patients w ith less cons-picuous heterotopia.
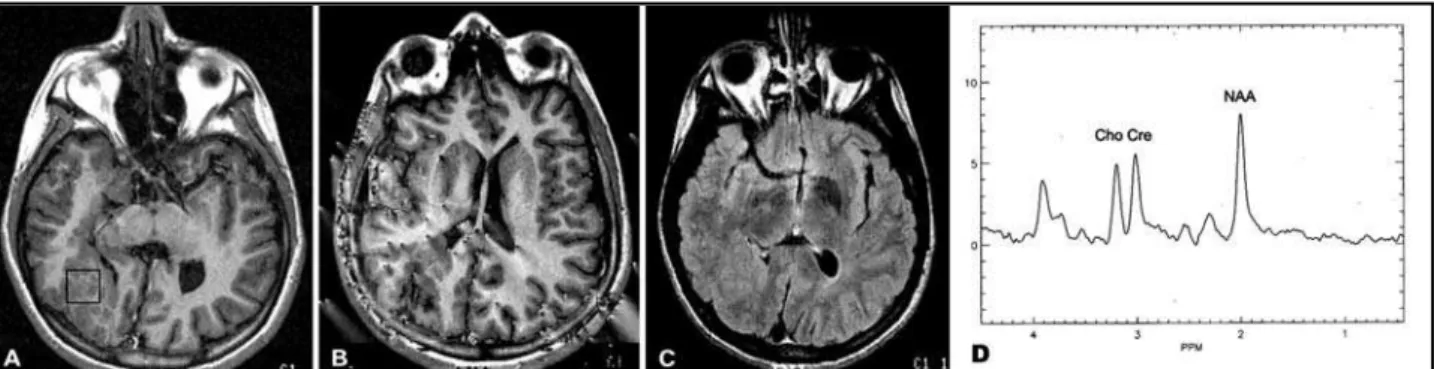
Patient 7 (Fig 7) a 10 years old male patient w ith type 1 nerofibromatosis: neurofibromata, cafe-au-lait macules and sphenoid dysplasia at CT. RM imaging for tumor screening show ed bilateral thalamic lesion. M RS makes the hypothesis of neoplasm less likely because of the maintenance of NAA peak and the discrete Cho increase. The diagnosis of transi-tory basal nucleus lesions of neurofibromatosis was confirmed in follow up.
show ing distinct pattern betw een hemispheres w ith reduced NAA, discrete increase of Cho and increased lac in affected hemisphere.
DISCUSSION
Acetate, succinate and aminoacid multiplet – composed of valine, leucine and isoleucine - are markers of bacterial abscess5(Fig 1) and they are not detected in necrotic tumors,
such as metastasis and glioblastoma, w hich sometimes mim-ic brain abscess in conventional M R. Other type of abscess, such as tuberculous, do not show this pattern6. In addition,
the characteristic neural tissue peaks (NAA, Cho, Cre) are absent or decreased, confirming the brain tissue destruction in necrotic area.
Neurocysticercosis (Fig 2) is the most common parasitic CNS infection across the w orld7. When the acute lesion is
sin-gle, parenchymatous, with reactive edema, it may simulate an encephalic tumor. How ever, succinate signal is elevated in neurocysticercosis and have been associated w ith the aero-bic metabolism of scolices8. Aminoacid peaks have also been
found in neurocysticercosis lesions8.
Subacute infarction (Fig 3) associated w ith edema, mass effect and blood -brain barrier rupture is commonly confused w ith tumors. Lactate increase can be detected minutes after the ischaemia and continues increasing in the following hours. This pattern contributes to diagnosis and does not necessar-ily represent an irreversible process. Choline might be elevat-ed in acute infarcts because the high cellular turn-over. Changes in Cre signal intensity are variable9. Subacute infarctions show
decreased NAA (as a response to neuronal loss and dysfunc-tion) and increased lac, w ith progressive Cho reduction in the chronic phase. How ever, this last feature has a variable char-acter9.
The acute multiple sclerosis (Fig 4) plaques may produce large mass effect with surrounding edema and blood-brain bar-rier rupture (pseudotumoral multiple sclerosis lesions), at times simulating neoplasm, in particular w hen there is only one lesion. In proton MRS they are characterized by lac increase, depending on the degree of inflammatory reaction, and by increased Cho/Cre ratios due to acute myelin break down, but usually not so intense as in neoplastic lesions10. Chronic
Fig 4. M ultiple sclerosis. Centered in corona radiata, an extensive, infiltrate lesion, with large mass effect, hypointense in T1 weight-ed images (a) and hyperintense in T2 (b) and FLAIR (c), with slight and sparse areas of contrast enhancement (d). Decreasweight-ed NAA signal and increase in lactate (lac) are observed (e).
Fig 5. Vanishing white matter disease. Obvious abnormal M R signal in white matter, hypointense in T1 (a) and hyperintense in T2 weighted images (b) which corresponds to demyelinization. In FLAIR images (c), hypointense signal areas correspond to lacunes. M arked decrease or absence of all brain metabolites in M RS (d).
plaques present reduced NAA/Cre ratios in the center of the
lesion, as consequence of irreversible axonal injury and partial
or complete recover of NAA signal in the periphery of the lesion11. Therefore, a single MRS exam in acute multiple
sclero-sis lesions may show a very similar pattern as seen in brain tumors.
However, follow up MRS exams will show distinct patterns of
metabolic changes in these two conditions.
Demyelinating diseases in children show a non specific MR imaging pattern, particularly w hen there are lesions w ith ill defined borders with hyperintense signal in long TR sequences, or when there is a rupture of blood-brain barrier, with contrast enhancement12. Proton MRS, although non specific within this
large group of pathologies, may be helpful for the study of the disorder evolution13. Canavan disease is an example of how
disor-ders. The marked increase in NAA as a result of deficiency of the aspartocyclase enzyme, necessary for the break dow n of NAA, is a pathognomonic finding9. In opposite, other
demyeli-nating diseases, mainly in advanced phases, show low NAA levels and progressive decrease of signal intensity of all metabolite signals, as in vanishing w hite matter disease (Fig
5).
Heterotopias (Fig 6) may be clinically manifested as epilep-sy and, in M R images , as large masses, sometimes simulat-ing tumors. How ever, proton M RS show normal peak areas or discrete relative NAA reduction14.
In neurofibromatosis (Fig 7), proton M RS assists in the dif-ferentiation of transitory w hite matter lesions from astrocy-tomas, both associated w ith this phacomatosis. Although in tissue (d).
both situations these is a decrease in the NAA/Cre ratio and a significant increase in the Cho/Cre ratio, Cho increase is discre-te and infrequent in the transitory w hidiscre-te matdiscre-ter lesions15,16.
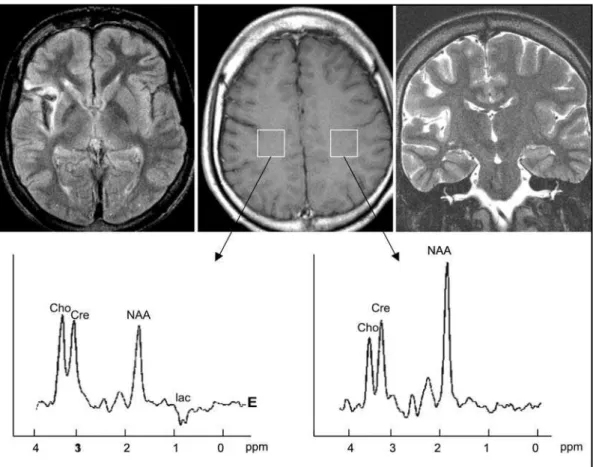
The gliotic areas of Rasmussen’s encephalitis (Fig 8), with hyperintense T2 signal, may be confused with infiltrate process when hemispheric atrophy is not so pronounced. Proton MRS, however, shows a decrease in the NAA/Cre ratio, indicating the secondary neuronal loss observed in this instance. Lactate accu-mulation is associated with the repetitive neuronal epileptic activ-ity in this disorder17,18.
CONCLUSION
Proton M RS contributed to correct diagnosis in encephal-ic lesions of diverse etiologies, such as infectious, ischaemencephal-ic, demyelinating, inflammatory, malformation of brain develop-ment and phacomatsis. In infectious disease, the presence of aminoacid multiplet and acetate, succinate supported the diagnosis. Other categories were differentiated by the pattern of ratios among NAA, Cre, Cho and lac in conjunction with oth-er imaging findings.
In conclusion, proton M RS is a noninvasive method, very
useful as an additional technique to define the nature of non-neoplastic encephalic lesions. Together w ith image analysis, it may be the key to etiologic diagnosis or, at least, definition of the group w here the lesion is classified (inflammatory, infectious, demyelinating, ischaemic, dysplastic or gliotic).
REFERENCES
1. Petroff OA, Pleban LA, Spencer DD. Symbiosis between in vivo and in vitro NMR spectroscopy: the creatine, N-acetylaspartate, glutamate, and GABA content of the epileptic human brain. Magnetic Resonance Imaging 1995;13:1197-1211.
2. Lenkinski RE, Schmal MD. MR spectroscopy and the biochemical basis of neurological disease. In Atlas SW (ed). Magnetic resonance imaging of the brain and spine. New York: Raven, 1991:1099.
3. Gill SS, Thomas DGT, VanBrugen N, et al. Proton spectroscopy of intracranial tumors: in vivo and in vitro studies. J Comp Assist Tom 1990;14:497-504.
4. Rand SD, Prost R, Haughton V, et al.Accuracy of single-voxel proton MR spectroscopy in distinguishing neoplastic from non-neoplastic encephalic lesion. Am J Neuroradiol 1997;18:1965-1704.
5. Grand S, Passaro G, Ziegler A, et al. Necrotic tumor versus brain abscess: importance of amino acids detected at 1H MR spectroscopy:
initial results. Radiology 1992;213:785-793.
6. Grupta RK, Vatsal DK, Chawla S, et al. Differentiation of tuberculous from pyogenic brain abscess with in vivoproton spectroscopy and
mag-netization transfer MR imaging. Am J Neuroradiol 2001;22:1503 - 1509. 7. Garcia HH, Gonzalez AE, Evans CA, Gilman RH. Taenia solium
cys-ticercosis. Lancet 2003;16:547-556
8. Pandit S, Lin A, Gahbauner H, Libertin CR, Erdogan B. MR spec-troscopy in neurocysticercosis. J Comp Assist Tom 2001;25:950 - 952. Fig 8. Rasmussen’s encephalitis. Right insular hyperintense signal in axial FLAIR (top, left) and coronal T2 (top, right) weighted images
spectroscopy. Amer J Neuroradiol 1996;17:1-15.
14. Li LM, Cendes F, Bastos AC, Andermann F, Dubeau F, Arnold DL. Neuronal metabolic dysfunction in patients with cortical developmen-tal malformations: a proton magnetic resonance spectroscopic imag-ing study. Neurology 1998;50:755-759.
15. Jones AP, Gunawardena WJ, Coutinho CMA. 1H MR spectroscopy
evi-dence for the varied nature of asymptomatic focal brain lesions in neu-rofibromatosis type 1. Neuroradiology 2001;43:62 - 67.
16. Wang PY, Kauffmann WE, Koht CW, Denckla MB, Barker PB. Thalamic involvement in neurofibromatosis type 1: evaluation with proton mag-netic resonance spectroscopy imaging. Ann Neurol 2000;47:447 - 484.
17. Mattheus PM, Andermann F, Arnold DL. Proton magnetic resonance spectography study of chronic encephalitis and epilepsy. In Chronic encephalitis and epilepsy: Rasmussen’s syndrome. Boston: Butterworth-Heinemann, 1991:73-77.