Evaluation of adrenal tumors by magnetic resonance
imaging with histological correlation*
Avaliação por ressonância magnética dos tumores de adrenal com correlação histológica
Daniel Lahan Martins1, Ronaldo Hueb Baroni2, Roberto Blasbalg2, Públio Cesar Cavalcanti Viana3, Regis Otaviano Franca Bezerra3, Francisco Donato Jr.3, Romulo Loss Mattedi4, Antonio Marmo Lucon5, Claudia da Costa Leite6, Giovanni Guido Cerri7
Magnetic resonance imaging is an important tool for the detection and characterization of adrenal tumors. The knowledge about the different presentations of primary and secondary adrenal tumors at magnetic reso-nance imaging and their correlation with histological data are essential for the establishment of a correct diagnosis. The present study reviews magnetic resonance imaging aspects which may narrow the differen-tial diagnosis of adrenal tumors, emphasizing the histological correlation of the most frequent ones.
Keywords: Magnetic resonance imaging; Adrenal glands; Retroperitoneal neoplasms; Urogenital neoplasms; Imaging diagnosis.
A ressonância magnética é ferramenta importante para a detecção e caracterização dos tumores adrenais. O conhecimento das diferentes apresentações dos tumores primários e secundários à ressonância magné-tica e sua correlação com dados da histologia são essenciais para o correto raciocínio diagnóstico. Este artigo revisa os aspectos que podem estreitar o diagnóstico diferencial dos tumores adrenais, dando ênfase à cor-relação histológica daqueles mais comuns.
Unitermos: Imagem por ressonância magnética; Glândulas supra-renais; Neoplasias retroperitoneais; Neo-plasias urogenitais; Diagnóstico por imagem.
Abstract
Resumo
* Study developed at Instituto de Radiologia do Hospital das Clínicas da Faculdade de Medicina da Universidade de São Paulo (InRad/HC-FMUSP), São Paulo, SP, Brazil.
1. Specialist in Radiology and Imaging Diagnosis, MD, Re-searcher at Instituto de Radiologia do Hospital das Clínicas da Faculdade de Medicina da Universidade de São Paulo (InRad/ HC-FMUSP), São Paulo, SP, Brazil.
2. PhDs, Physician Assistants at Instituto de Radiologia do Hospital das Clínicas da Faculdade de Medicina da Universi-dade de São Paulo (InRad/HC-FMUSP), São Paulo, SP, Brazil.
3. Specialists in Radiology and Imaging Diagnosis, Instituto de Radiologia do Hospital das Clínicas da Faculdade de Medicina da Universidade de São Paulo (InRad/HC-FMUSP), São Paulo, SP, Brazil.
4. MD, Pathologist, Department of Pathology, Instituto de Radiologia do Hospital das Clínicas da Faculdade de Medicina da Universidade de São Paulo (InRad/HC-FMUSP), São Paulo, SP, Brazil.
5. Professor, Division of Clinical Urology, Hospital das Clínicas da Faculdade de Medicina da Universidade de São Paulo (HC-FMUSP), São Paulo, SP, Brazil.
6. Private Docent, Head for the Unit of Magnetic Resonance Imaging, Instituto de Radiologia do Hospital das Clínicas da Fa-culdade de Medicina da Universidade de São Paulo (InRad/HC-FMUSP), São Paulo, SP, Brazil.
7. Full Professor, Division of Radiology, Hospital das Clínicas da Faculdade de Medicina da Universidade de São Paulo (InRad/ HC-FMUSP), São Paulo, SP, Brazil.
hypointense to the liver. MRI is frequently utilized to evaluate adrenal lesions diag-nosed by means of other methods such as CT, in cases where they are inconclusive. Also, adrenal lesions (the so called inciden-talomas) are frequently incidentally found at MRI performed for investigating other abnormalities.
MRI offers an exceptional contrast reso-lution, achieving a good spatial resolution in the evaluation of adrenal glands, includ-ing for detection of lesions as small as 0.5– 1.0 cm. The MRI protocol should include high-resolution, multiplanar, T1-weighted images (5 mm-thick at maximum) for ana-tomical details, and T2-weighted images. Fat suppression is utilized to avoid images degradation by chemical shift artifacts caused by the fat involving the adrenal gland(2,3).
In-phase and out-of-phase gradient-echo (GRE) sequences are essential for al-lowing the detection of microscopic intratumoral fat, increasing the specificity of the method and avoiding unnecessary interventions(4).
Martins DL, Baroni RH, Blasbalg R, Viana PCC, Bezerra ROF, Donato Jr F, Mattedi RL, Lucon AM, Leite CC, Cerri GG. Avaliação por ressonância magnética dos tumores de adrenal com correlação histológica. Radiol Bras. 2008;41(1):55–62.
shape, and consists of cortex (cortisol, al-dosterone and androgens secretion) and medulla (epinephrine and norepinephrine secretion). The normal adrenal body mea-sures up to 10–12 mm, and its limbs not more than 5–6 mm. The right adrenal gland lies immediately posterior to the inferior vena cava and superiorly to the right kid-ney. At left, the gland lies anteromedial to the upper pole of the left kidney. They are retroperitoneal structures contained within the Gerota’s fascia. The renal fascia in-volves the adrenal glands, but a transverse fibrous lamella joins their ventral layer with the dorsal layer of the renal fascia, allow-ing their separation from the kidney durallow-ing nephrectomy. There is fat involving the adrenal glands (1,2).
Adrenal glands can be easily visualized on abdominal magnetic resonance imaging (MRI). Typically they appear isointense or
Mailing address: Dr. Daniel Lahan Martins. Rua Alves Guima-rães, 518, ap. 51, Pinheiros. São Paulo, SP, Brasil, 05410-000. E-mail: [email protected]
Received July 17, 2007. Accepted after revision August 24, 2007.
INTRODUCTION
The name “adrenal gland” comes from its localization adjacent to the kidneys ( ad-renal). A normal adrenal gland weights 5
T-Martins DL et al.
Some adrenal tumors are hyperfunc-tional (excessive production of cortisol, al-dosterone and/or androgens). Cushing’s syndrome (excessive production of corti-sol) is typically secondary to hypophyseal adenomas, unless in cases resulting from adrenal tumors, where, most frequently, be-nign adenomas are the cause of the disease. Hyperaldoterism resulting from adrenal adenoma (80% of cases) is known as Conn’s syndrome(5).
ADRENOCORTICAL TUMORS
Adenoma
The adenomas incidence in the general population is estimated in 2% to 8%(6). Most
frequently, adrenal adenomas are nontional tumors, however, in cases of func-tional tumors, specific clinical symptoms represent a warning of the presence of an adrenal tumor. Nonfunctional adenomas usually constitute incidental findings(3,7).
The majority of adenomas are slightly hypointense or isointense to the liver on T1-weighted images, and slightly hyperin-tense or isoinhyperin-tense on T2-weighted images.
The utilization of chemical-shift tech-niques (in-phase- or out-of-phase GRE) allows the characterization of adenomas containing microscopic fat and water pro-tons in a same voxel (Figure 1). On out-of-phase images, the protons signal is null and results in signal loss as compared with in-phase-images(3,4,7,8). Some authors quantify
this signal loss, considering a decrease of > 20% as compatible with the diagnosis of adenoma(9).
Although highly suggestive of adenoma, these findings are non-specific. Other ad-renal lesions may include microscopic fat and, consequently, signal loss in out-of-phase sequences. This occurs in some cases of adrenal carcinoma, metastatic renal cells carcinoma, hepatocellular carcinoma me-tastasis, etc.(3,7,9). So, other parameters than
signal loss should be taken into consider-ation in the diagnosis of adenoma: the le-sion must be homogeneous, < 5 cm in size and present regular margins(3,7,9).
Carcinoma
Adrenocortical carcinoma is a rare neo-plasm most frequently occurring between
the fourth and fifth decades of life and equally prevalent for both men and women. Typically, they present as large lesions (> 5,0 cm) at the moment of the diagnosis and may include necrosis, bleed-ing and, frequently, calcification(6).
About 25% to 50% of adrenal carcino-mas are rated as functional, and most of times cause Cushing’s syndrome(6,10).
Gen-erally, primary adrenocortical carcinomas are unilateral. MRI has been considered as method superior to CT in the staging of this disease, allowing a better evaluation in cases of adjacent organs invasion(7).
Signal intensity in adrenal carcinomas is variable, usually heterogeneous on T1-and T2-weighted sequences (Figure 2). Usually, after contrast injection, the lesion is heterogeneously enhanced.
Considering that this neoplasm origi-nates in the adrenal cortex, microscopic fat may be present, similarly to adenomas, pos-sibly resulting in signal loss on out-of-phase GRE sequences(11). Most frequently,
however, the differential diagnosis with ad-enoma is not difficult. In carcinomas, only part of the lesion loses signal intensity
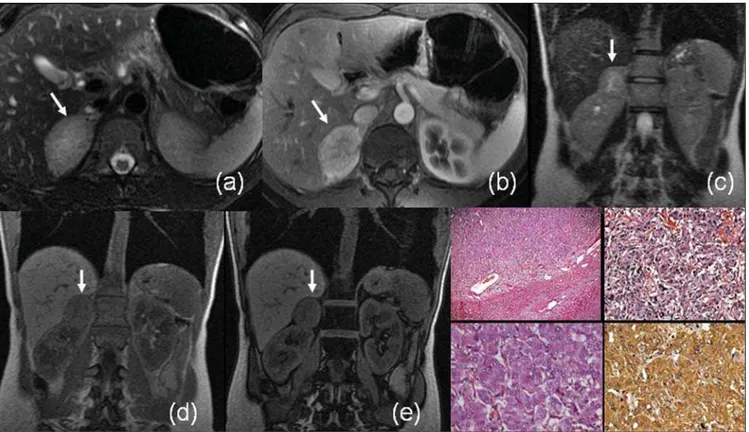
Figure 2. Adrenal cortical carcinoma. MRI contrast-enhanced coronal T1-weighted GRE (a) and coronal T2-weighted SS-FSE (b) sequences demonstrate a large expansive lesion involving the right adrenal gland. The lesion shows heterogeneous pattern of impregnation by the contrast agent and areas of necrosis (hypersignal on T2-weighted sequences)(arrows). Neoplasm with multinodular architecture, with eosinophil cells and calcification foci – HE, 12.5× (c); Images of mitosis in neoplastic cells – HE, 400× (d).
Figure 3. MRI axial T1-weighted phase- (a) and out-of-phase GRE (b), contrast-enhanced, axial T1-weighted (c), axial T2-weighted (d) and axial, T2-weighted sequence with fat-suppression (e): arrows demonstrate typical features of myelolipoma in the left adrenal gland, with macroscopic fat component signal loss with fat-saturation (c,e). HE, 200× (f) demonstrating hematopoietic tissue (erythrocytes, granulocytes and megakaryocytes) associated with the adrenal tis-sue.
erogeneously), besides the fact that the tu-mor is larger in size and presents with het-erogeneous signal(3,7,9).
Myelolipoma
Generally, myelolipomas are benign, unilateral, non-functioning lesions com-posed of fat and bone marrow in varying proportions. Calcifications may be found in 20% of cases(12). Most frequently, these
lesions are asymptomatic or present with pain (in cases of hemorrhage or compres-sion of adjacent structures)(13).
The diagnosis of myelolipoma consists in demonstrating macroscopic fat in the ad-renal lesion. At MRI, this type of fat pre-sents hyperintense signal on T1-weighted images. This finding by itself is non-spe-cific, considering that it also can be found in hemorrhagic lesions. A fat suppression
Martins DL et al.
organs may be confused with a low grade retroperitoneal liposarcoma or even an exo-phytic renal angiomyolipoma. However, usually on multiplanar images, the origin of the lesion can be demonstrated(3).
ADRENAL MEDULLARY TUMORS
Pheochromocytoma
Pheochromocytomas are rare tumors arising from pheochromocytes, the pre-dominant cells in the adrenal medulla(14).
These tumors are most frequently found be-tween the fourth and sixth decades of life. Approximately 10% are bilateral, 10% are malignant, 10% occur in children, and 10% are extra-adrenal(15).
More than 90% of pheochromocytomas arise in the adrenal gland, and 98% are intraabdominal. Extra-adrenal pheomocytomas develop in paraganglion chro-maffin cells of the sympathetic nervous system, may occur at any site from the base of the skull to the bladder, and are called paragangliomas(16).
Although the majority of patients with pheochromocytoma present with manifes-tations resulting from excessive secretion of catecholamine, approximately 10% of these patients are asymptomatic, the tumor being incidentally detected by means of imaging studies performed by other reasons(17).
Pheochromocytomas and paraganglio-mas present different appearances at differ-ent imaging methods. Variable degrees of pathological degeneration may occur, and, consequently, a wide spectrum of imaging characteristics may be found(18).
It main manifestation at MRI is an ex-pansive lesion with low signal intensity on T1-weighted sequences, and high signal in-tensity on T2-weighted sequences (even higher on T2-weighted sequences with fat saturation because of the decrease in sig-nal of adjacent fat tissue). Generally, these tumors are intensely enhanced after con-trast agent injection(18) (Figure 4).
How-ever, its aspect may vary at MRI, including the possibility of finding of pheochromocy-tomas with low signal intensity on T2-weighted sequences(18,19).
There is a considerable overlapping among MRI findings of pheochromocyto-mas and other adrenal tumors. Approxi-mately 35% of pheochromocytomas are erroneously classified as malignant lesions or adenomas, particularly in cases of atypi-cal images on T2-weighted sequences(19).
The diagnosis of pheochromocytomas can-not be excluded only on the basis on the ab-sence of hyperintense signal on T2-weighted sequences. Similarly, other tu-mors (including some metastases) may be erroneously classified as pheochromocyto-mas only on the basis of the finding of hyperintense signal on T2-weighted se-quences.
Neuroblastoma
Although neuroblastomas are the third most frequent malignant tumors in chil-dren, they are much less frequent in adults. This tumor occurs at any site along the parasympathetic nervous system. The most disseminated form of the disease is more frequent in adults than in children. The lack of specificity of imaging findings, and
Figure 5. MRI axial, in-phase(a) and out-of-phase (b) GRE T1-weighted, coronal SS-FSE T2-weighted (d) sequences of right adrenal neuroblastoma. The tumor is predominantly hypointense on T1-weighted sequences and presents a central hemorrhagic area with hyperintense signal (arrows on a, b and d). Contrast uptake (c). MRI angiography (e) demonstrates right adrenal irrigation (open arrow) of relevance for surgical planning.
quent disseminated involvement suggest lymphoma and metastasis as the main dif-ferential diagnosis(16).
Neuroblastomas usually present hetero-geneous low signal intensity on T1-weighted sequences, high signal intensity on T2-weighted sequences and paramag-netic contrast uptake. Calcifications occur in 80–90% of cases, but their detection is difficult at MRI. Areas of intratumoral hemorrhage appear with a typical hyperin-tense signal on T1-weighted sequences, and cystic alterations present high signal intensity on T2-weighted sequences (Fig-ure 5). MRI has been considered as more sensitive than CT in the diagnosis of these tumors, thanks to its contrast high-reso-lution(20).
LYMPHOMA
Primary adrenal lymphoma is rarely found(21,22), differently from the secondary
involvement where other retroperitoneal site is involved. This is more usual in cases of non-Hodgkin lymphomas than in cases
of Hodgkin’s disease(23). Generally, the
in-volvement is bilateral.
Adrenal lymphomas manifestations may range from small lesions to a more diffuse involvement where the adrenal glands maintain their adreniform shape. Also, an extensive involvement may occur, making the identification of the adrenal gland impossible(16).
At MRI, lymphomas present a lower signal intensity than the liver on
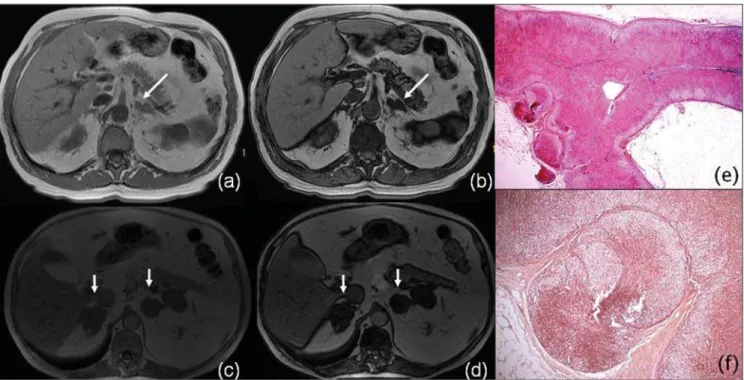
T1-weighted sequences, and is typically hyperintense and heterogeneous on T2-weighted images (Figure 6). A discreet con-trast uptake is observed(2,16).
METASTASES
Metastases are the most frequent malig-nant tumors occurring in the adrenals, and are found in up to 27% of autopsies in pa-tients with malignant epithelial tumors.
Martins DL et al.
Lungs colon, breast and pancreas are the most common primary sites to metastize to the adrenals(2).
Some criteria are suggestive of malig-nant adrenal lesions at MRI, like diameter > 5 cm, irregular margins, invasion of ad-jacent structures and enlargement observed along the follow. Additionally, adrenal me-tastases use to appear hypo- or isointense to the liver on T1-weighted sequences, and with high intensity signal on T2-weighted images(5) (Figures 7 e 8).
Metastases from renal cell carcinomas, hepatocellular carcinomas and liposarco-mas may include microscopic fat and, con-sequently, may be seen with signal inten-sity loss on out-of-phase sequences(Figure 9). Generally, metastases present a persis-tent uptake after contrast injection, but with a pattern that may range accordingly to the primary tumor(7).
PSEUDOTUMORAL CONDITIONS
Adrenal hyperplasia
Adrenal cortical hyperplasia may be pri-mary or secondary (hypophiseal/hypotha-lamic lesions, or lesions resulting from ectopic of adrenocorticotropic hormone [ACTH]). It is most frequently found in Conn’s syndrome or adrenogenital syn-drome. In patients with hyperaldosterism, the differentiation between hyperplasia and adenoma defines if a clinical or surgical conduct should be adopted(24). In adrenal
hyperplasia, the glands present bilaterally thickened, although maintaining their adreniform shape, and generally with regu-lar margins(25). Less frequently,
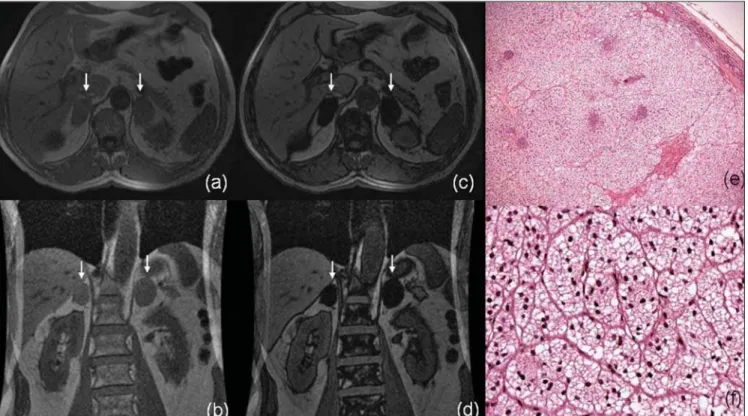
hyperpla-sia may manifest as a nodular thickening, or even not changing the normal adrenals shape (Figure 10). It is important to remem-ber that bilateral adrenal nodules are non-specific for hyperplasia(2).
Adrenal cysts, pseudocysts and hemorrhages
Adrenal cysts and pseudocysts are rare and generally are incidentally diagnosed by means of imaging methods. Patients with this type of lesion are asymptomatic, unless the lesion grows sufficiently to result in a mass effect in adjacent organs. Adrenal cysts have been divided into four main cat-egories: 1) endothelial (angiomatous or
Figure 8. Contrast-enhanced MRI axial T1-weighted images demonstrate heterogeneous contras agent uptake in right adrenal metastasis (arrow on b) of hepatocelullar carcinoma (open arrow on a).
Figure 7. MRI axial in-phase (a) out-of-phase (b) GRE weighted sequences, contrast enhanced T1-weighted (c) and T2-weighted with fat saturation sequences (d) demonstrate heterogeneous contrast agent uptake in metastasis of renal cell carcinoma to left adrenal gland (arrows).
Figure 10. MRI axial in-phase(a) and out-of-phase (b) GRE T1-weigthed images demonstrate smooth thickening of left adrenal gland (arrow), with signal intensity loss on out-of-phase sequence. Axial in-phase (c) and out-of-phase (d) GRE T1-weighted images show bilateral nodular thickening of adrenals in a patient with adrenal hyperplasia (arrows). Photomicrography HE 12.5x (e) and HE 50x (f) demonstrate nodules in the adrenal cortex, a typical finding of adrenal cortical hyperplasia (in patients with micronodular cortical hyperplasia). Differentiation between nodular hyperplasia and adenoma may be difficult at MRI.
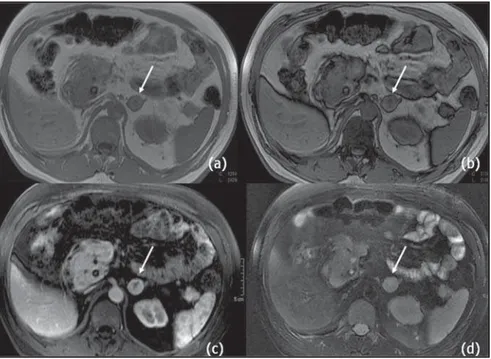
Figure 11. MRI axial FSE T2-weighted (a) and contrast-enhanced GRE T1-weighted images (b) of a simple cyst in left adrenal gland (arrow). In case of dubious T2-weighted images (simple cyst or lesion with hyperintense signal on T2-weighted sequences), like typical pheochromocytoma, the contrast agent may help in the differentiation, considering that in cysts there is no contrast uptake.
lymphangiectasic); 2) epithelial; 3) pseudo-cysts; 4) parasitic. Pseudocysts may be post-traumatic or postinfectious.
At MRI, a simple adrenal cyst is usually hypointense on T1-weighted images, and hyperintense on T2-weighted images (Fig-ure 11). However, some of them may present with hemorrhagic content, with variable signal intensity depending on the stage of hemoglobin degradation. Cysts walls should be thin, without nodular com-ponents or contrast uptake. Besides, calci-fication may be present on the cyst wall
which can be better evaluated by CT. How-ever, the utilization of long echo time and low flip angle GRE sequences may be of aid in the identification of calcium or he-mosiderin artifacts.
Sometimes the differentiation between adrenal cysts/pseudocysts and pheochro-mocytomas is difficult, considering that both are hyperintense on T2-weighted se-quences. In this situation, the utilization of a contrast agent is essential, considering the intense uptake by pheochromocyto-mas(3).
Adrenal hemorrhage may be spontane-ous (most rarely) or secondary to trauma. The majority of patients with adrenal hem-orrhage do not present clinical signs of ad-renal failure, and the diagnosis is inciden-tally achieved by means of imaging stud-ies performed for other reasons. Atraumatic adrenal hemorrhage may be idiopathic or usually secondary to stress, coagulation disorders, neonatal stress or tumors(26–28).
Although CT is the imaging method of choice in the initial evaluation of adrenal hemorrhage, MRI not only can diagnose and evaluate hematomas, but also defines the moment of the event (that is to say its “age”). In the acute phase (during the first seven days) adrenal hemorrhage is seen as iso- or hypointense signal on T1-weighted sequences, and with remarkable hypoin-tense signal on T2-weighted images (high concentration of intracellular deoxyho-moglobin). In the subacute phase (seven days to six to seven weeks after the event), adrenal hemorrhage is seen with hyperin-tense signal on T1- and T2-weighted se-quences (paramagnetic effects of metemo-globin [Fe2+]) (Figure 12). In the chronic
Martins DL et al.
MR imaging of adrenal masses: value of chemi-cal-shift imaging for distinguishing adenomas from other tumors. AJR Am J Roentgenol. 1995; 164:637–42.
10. Mendonça BB, Lucon AM, Menezes CA, et al. Clinical, hormonal and pathological findings in a comparative study of adrenocortical neoplasms in childhood and adulthood. J Urol. 1995;154: 2004–9.
11 Haider MA, Ghai S, Jhaveri K, et al. Chemical shift MR imaging of hyperattenuating (> 10 HU) adrenal masses: does it still have a role? Radiol-ogy. 2004;231:711–6.
12. Cirillo RL Jr, Bennett WF, Vitellas KM, et al. Pa-thology of the adrenal gland: imaging features. AJR Am J Roentgenol. 1998;170:429–35. 13. Kenney PJ, Wagner BJ, Rao P, et al. Myelolipoma:
CT and pathologic features. Radiology. 1998;208: 87–95.
14. Francis IR, Korobkin M. Pheochromocytoma. Radiolol Clin North Am. 1996;34:1101–12.
15. Elsayes KM, Narra VR, Leyendecker JR, et al. MRI of adrenal and extraadrenal pheochromocy-toma. AJR Am J Roentgenol. 2005;184:860–7.
16. Dunnick NR, Korobkin M. Imaging of adrenal incidentalomas: current status. AJR Am J Roent-genol. 2002;179:559–68.
17. Lucon AM, Pereira MAA, Mendonça BB, et al. Pheochromocytoma: study of 50 cases. J Urol. 1997;157:1208–12.
18. Blake MA, Kalra MK, Maher MM, et al. Pheo-chromocytoma: an imaging chameleon. Radio-Graphics. 2004;24:S87–99.
19. Varghese JC, Hahn PF, Papanicolaou N, et al. MR differentiation of phaeochromocytoma from other adrenal lesions based on qualitative analysis of T2 relaxation times. Clin Radiol. 1997;52:603–6. 20. Lonergan GJ, Schwab CM, Suarez ES, et al.
Neu-roblastoma, ganglioneuNeu-roblastoma, and ganglio-neuroma: radiologic-pathologic correlation. RadioGraphics. 2002;22:911–34.
21. Falchook FS, Allard JC. CT of primary adrenal lymphoma. J Comput Assist Tomogr. 1991;15: 1048–50.
22. Paling MR, Williamson BRJ. Adrenal involve-ment in non-Hodgkin lymphoma. AJR Am J Roentgenol. 1983;141:303–5.
23. Nacif MS, Jauregui GF, Mello RAF, et al. Linfo-ma adrenal primário bilateral com envolvimento do sistema nervoso central: relato de caso. Radiol Bras. 2005;38:235–8.
24. Doppman JL, Gill JR Jr, Miller DL, et al. Distinc-tion between hyperaldosteronism due to bilateral hyperplasia and unilateral aldosteronoma: relia-bility of CT. Radiology. 1992;184:677–82.
25. Westra SJ, Zaninovic AC, Hall TR, et al. Imaging of the adrenal gland in children. RadioGraphics. 1994;14:1323–40.
26. Kawashima A, Sandler CM, Ernst RD, et al. Im-aging of nontraumatic hemorrhage of the adrenal gland. RadioGraphics. 1999;19:949–63.
27. Hoeffel C, Legmann P, Luton JP, et al. Spontane-ous unilateral adrenal hemorrhage: Computerized tomography and magnetic resonace imaging find-ings in 8 cases. J Urol. 1995;154:1647–51. 28. Araújo Neto SA, Rezende RT, Souza AS, et al.
He-morragia adrenal bilateral com trombose da veia renal direita e veia cava inferior em um recém-nascido. Radiol Bras. 2003;36:317–21. Figure 12. MRI axial slices. Axial in-phase (a) GRE T1-weighted image, axial FSE T2-weighted (b), axial
GRE T1-weighted sequence with fat saturation before (c) and after (d) contrast injection in patient with right adrenal hemorrhage. Note the high signal on T1-weighted image representing metahemoglobin (arrow).
intensity on T1- and T2-weighted images caused by hemosiderin deposition(26).
CONCLUSIONS
The increasing utilization of sectional imaging methods has improved the rates of incidental detection of adrenal lesions. Benign and malignant tumors are frequent and their characterization is of great clini-cal relevance. Besides identifying and char-acterizing adrenal tumors, MRI presents as an advantage over other methods: the pos-sibility of differentiating adenomas from other tumors with higher sensitivity and specificity, mainly with the utilization of in-phase- and out-of-in-phase-GRE sequences. This is extremely important for oncologic patients. Its high-resolution, contrast be-tween tissues, and multiplanar capacity al-low accurate diagnosis, besides establish-ing the relationship between adrenal le-sions and adjacent organs. Continuous technical innovation in MRI (higher mag-netic fields, introduction of new coils, se-quences and techniques) will result in an expansion of MRI applications in a near future.
Acknowledgement
Dr. Ruy Rodrigues Galves Jr., for his contribution with adrenal lymphoma im-ages.
REFERENCES
1. Mayo-Smith WW, Boland GW, Noto RB, et al. State-of-the-Art. Adrenal imaging. RadioGraph-ics. 2001;21:995–1012.
2. Lockhart ME, Smith JK, Kenney PJ. Imaging of adrenal masses. Eur J Radiol. 2002;41:95–112. 3. Israel GM, Krinsky GA. MR imaging of the
kid-neys and adrenal glands. Radiol Clin North Am. 2003;41:145–59.
4. Mitchell DG, Crovello M, Matteucci T, et al. Be-nign adrenocortical masses: diagnosis with chem-ical shift MR imaging. Radiology. 1992;185:345– 51.
5. Hussain HK, Korobkin M. MR imaging of the ad-renal glands. Magn Reson Imaging Clin N Am. 2004;12:515–44.
6. Fishman EK, Deutch BM, Hartman DS, et al. Pri-mary adrenocortical carcinoma: CT evaluation with clinical correlation. AJR Am J Roentgenol. 1987;148:531–5.
7. Krestin GP. Genitourinary MR: kidneys and ad-renal glands. Eur Radiol. 1999;9:1705–14. 8. Namimoto T, Yamashita Y, Mitsuzaki K, et al.
Ad-renal masses: quantification of fat content with double-echo chemical shift in-phase and opposed-phase FLASH MR images for differentiation of adrenal adenomas. Radiology. 2001;218:642–6.