790 Brazilian Journal of Physics, vol. 29, no. 4, December, 1999
SXS and XPS Study of the Adsorption and
Desorption of Te on GaAs (100)
J.C. Gonzalez,W.N.Ro drigues, C.M.Silva,M.V.B.Moreira, A.G.de Oliveira,
Departamento de Fsica - ICEx - UFMG, CP 702, 30123-970, Belo Horizonte - Brazil
M. Abbate, and F.C. Vicentin
LNLS, CP 6192, 13083-970, Campinas - Brazil
Received February, 1998
The adsorption and desorption of Te on GaAs (100) has been investigated using Soft X-ray Spec-troscopy (SXS) and X-ray Photoelectron SpecSpec-troscopy (XPS). The SXS measurements have been done at the Brazilian synchrotron facility LNLS, and the XPS study was performed using laboratory sources. The samples were MBE GaAs (100) layers covered in-situ by Te from an eusion cell. Two families of samples were studied: samples analyzed in-situ, and samples that were exposed to air for at least one week. The desorption of Te of the non-oxidized samples indicates that traces of Te remains in the surfaces for temperatures as high as 680C. However, for the case of the oxidized samples, the Te lm sublimates easily at around of 250C, leaving a clean GaAs surface. It seems that the oxidized Te lm works as a suitable protection for epitaxial GaAs layers.
The study of adsorption and desorption of Te on GaAs (100) is very important since Te can be used in the Surfactant Controlled Molecular Beam Epitaxy of InAs on GaAs [1]. In this work we investigated the ad-sorption of Te on the surface of MBE grown GaAs (100) using an in-situ eusion cell for the deposition of Te. The evolution of the adsorption of Te was monitored using in-situ XPS. The study of the desorption of Te was carried out in two dierent kind of samples, namely non-oxidized samples and samples exposed to air for at least one week. The non-oxidized samples were studied in-situ after the deposition of Te. The procedure used was to anneal the sample at a known temperature and to measure the XPS spectra, once the sample was at room temperature. RHEED experiments were carried out in this kind of sample, measuring the intensity of diracted beams as a function of annealing tempera-ture. The air-exposed samples were studied using the same procedure, but SXS experiments were carried out instead of RHEED.
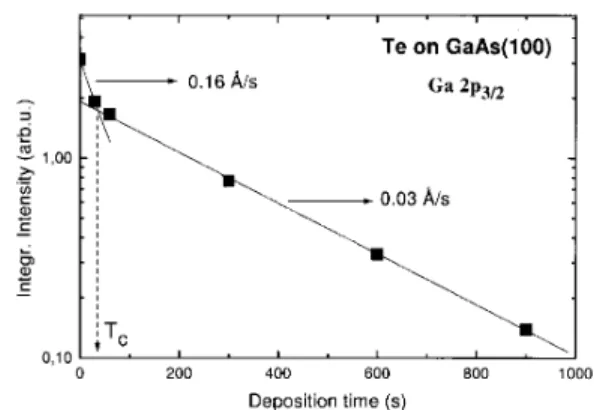
The integrated intensity of Te as a function of the deposition time is shown in Fig.1. This process of ad-sorption of Te is characterized by two dierent deposi-tion rates. In the beginning the deposideposi-tion rate is 0.16 A/s or 0.043 ML/s, considering that one monolayer of
Te correspond to 3.72 A [2]. This rate is constant dur-ing the rst 6 A, but changes to 0.03 A/s after 6 A of Te. This change in the deposition rate of Te suggests a change in the sticking coecient of Te to the surface, at that critical thickness.
Figure 1. Evolution of the Ga 2p3=2 XPS peak with the deposition time of Te. Two deposition rates are observed. At Tcthe Te lm is 6 A thick, and the growth rate changes abruptly from 0.16 A/s to 0.03 A/s.
J.C.Gonzalezet al. 791 the Te signal decreases, with the expected increment
in the Ga and As peaks. However around 580 C the Ga peaks starts to reduce in intensity, the As peaks increases strongly and the Te peak stabilizes until 600 C. This can be due to preferential As migration to the surface. This behavior is observed until 630C , when Te almost completely disappears. After 630C the Ga peak increases, and the As signal reduces, indicating a Ga-enriching process at the surface. The annealing continues until 680 C and the surface remains stable. This is one remarkable result since usually at so high temperatures GaAs degrades under UHV.
Figure 2. Te desorption from GaAs (100) surface: a) RHEED intensity as function of the annealing temperature, for three dierent diracted spots, b) evolution of the peaks of Ga, As and Te as a function of the annealing temperature.
Fig. 3 shows the XPS Ga 2p
1=2and Ga 2 p
3=2peaks, of the air-exposed samples, for dierent annealing tem-peratures. An abruptly change is observed in the inten-sity of these peaks when the temperature increases from 200C to 250C. In Fig. 4a the evolution of the peaks of Te, Ga and As is shown. We can conclude that these changes are due to the Te evaporation at this range of temperature. Desorption of Te in the air-exposed sam-ples, shows that at 250 C the concentration of Te in the surface is not more detectable by XPS. This is cor-roborated by the SXS measurements, shown in Fig. 4b. These results show that the oxidation of the cap layer of Te creates a volatile layer, which can be useful in obtaining clean GaAs surfaces.
Figure 3. Evolution of the Ga 2p peaks as a function of the annealing temperature, for air exposed Te:GaAs samples.
Figure 4. Desorption of Te in air exposed samples: a) evolu-tion of the peaks of Ga, Te, As as a funcevolu-tion of the annealing temperature, b) evolution of the X-ray absorption at the Te K edge, at dierent annealing temperatures.
792 Brazilian Journal of Physics, vol. 29, no. 4, December, 1999 The desorption studies in the air exposed samples
show that Te sublimes at 250
C leaving a clean GaAs surface. This oxidized Te forms a protective and volatile layer for the GaAs surface.
Acknowledgements
The authors would like to thank the agencies CNPq, CLAF, FINEP, and FAPEMIG for their support.
References
1. W.N. Rodrigues, V.H. Etgens, M. Sauvage-Simkin, G. Rossi, F. Sirotti, R. Pinchaux, and F. Rochet, Solid State Comm.,95, 873 (1995). 2. A.C. Ferraz and R. Claudino da Silva, Surf. Sci.

