Marcelo Bender Perotoni* Technological Institute of Aeronautics São José dos Campos/SP – Brazil
marcelo.perotoni@ufabc.edu.br
Luiz Alberto Andrade Institute of Aeronautics and Space São José dos Campos/SP – Brazil andradelaa@iae.cta.br
*author for correspondence
Numerical evaluation of an
air-to-air missile radar cross section
signature at X-band
Abstract: The remote detection of a vehicle requires that some kinds of its emissions are tracked and detected. Usually, electromagnetic emissions are used in the form of radar (electromagnetic waves in the range of radiofrequency and microwaves). Different types of antennas are used as sensors, tailored to the signal frequency band and its polarization, as well as to the target distance (higher gain antennas used for low amplitude signals). For the speciic case of radars, the use of computational methods to address the electromagnetic signature (spatial pattern of the scattered energy from the object) has become widespread, given the high costs and complex equipment associated with these respective measurements. Therefore, the use of computer simulation is ideally suited for creating a realistic database of targets and its respective signatures. The same computer-created signatures database can also be used for the thermal range, enabling a complete technology solution for the signature and design of stealth vehicles, with reduced emissions.
Keywords: Radar cross section, Electromagnetic scattering, Computational modeling.
INTRODUCTION
Radars have become a fundamental tool in the areas of defense and homeland security, since the Second World War (Grant, 2010). Since its inception, several new tools were added, namely ultra wide band (UWB), processing algorithms, digital signal processors, and so on (Kouemou, 2009; Skolnik, 1981).
Although modern techniques rely heavily on signal processing (software) for increasing the detection capabilities, the hardware is still a crucial issue. The reason is that the frequencies used by radars normally require the use of microwave instrumentation, which presents higher costs and complexity when compared to low-frequency circuitry and equipment.
The spatial waveform shape of the return radar signal (echo) is the vehicle radar cross section (RCS) signature.
Every object has a speciic signature, which helps to
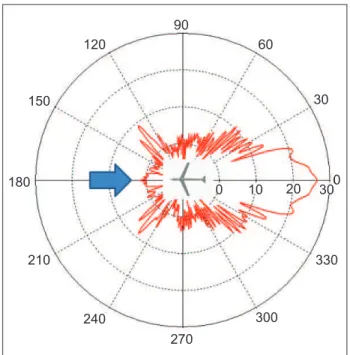
identify what kind of structure is under analysis (for instance, determining whether it is a friend or foe). Figure 1 depicts the radar signature of a generic glider at 0.5 GHz, for a frontal incidence, taken from the examples supplied with the CST Microwave Studio® (CST, 2010)
package. The electromagnetic energy from the incoming wave develops currents along the metallic surface, which then re-radiate in several directions. That is the
ield which hits the receiver radar, located on the ground
or embarked somewhere. From Fig. 1, it is possible to see that some directions have a higher energy density than others.
The receiver signal can be captured and processed on the same position where it was transmitted; this is the so-called monostatic radar signature. Signatures are called bistatic when the receivers can be spread in other directions. In
Received: 13/09/11 Accepted: 08/10/11
90
60
30
0 30 20 10 0
300
330
270 240
210 180
150
120
If a receiver was placed on the same position of the transmitter (180º), it would be seen a target with 1.6 dBsm (or 1.45 m2). The unit used is that of a surface (square
meters), so that it has a relation to an analogous physical area, which scatters the same energy. On the other hand, if the receiver is positioned at the 0 angle, the target will be detected with a RCS of around 25 dBsm (316 m2).
The measurement of the RCS signatures from real targets (aircraft, tanks, vessels) is a complex and costly task. For the case of an aircraft, it requires its placement on an adequate area, which is normally wide (comparable to the aircraft size). In addition, the microwave instrumentation has to be able to illuminate the object with enough energy in order that the returned signal can be discriminated against
the environment noise loor. On top of that, measurements
done on the ground do not represent a true environment,
since during real lights there is no ground plane. In view
of these complexities, computer simulations have been used to predict and analyze radar signatures. For instance, the design of stealth vehicles (i.e. vehicles whose RCS signatures are very low when compared to their physical size) relied on the computer analysis to get a geometric shape able to scatter the incoming wave, in such a way the receiver signal is as small as possible (Grant, 2010).
This article presents a short overview of the numerical methods used in the microwave analysis. Monostatic and bistatic simulated signatures of a real short range, air-to-air missile are presented. Comparisons with measurements are also shown.
METHODS
Numerical analysis
To solve the microwave range scattering problems, an appropriate solution of the Maxwell Equations is sought, subjected to the particular boundary conditions. The numerical solution of those equations involves a previous step, the discretization, where the object and its surrounding volume are sliced into small elements (forming the electromagnetic mesh). Then, the Maxwell equations are applied to each of those small elements,
whose ields/currents/voltages are determined.
Volume meshes are commonly used when the object is electrically small, like most antennas. However, the computation of large-scale models using volume mesh methods becomes intractable with even moderate hardware. The reason is that the meshing of the hollow part of a missile and the air area around it can be neglected, since the external shell is the main responsible for the scattering. For that kind of application, surface mesh is used instead; only the external 2D surface (sheet) is meshed.
electromagnetic wave develops along its surface electric currents, which in turn re-radiate. The unknown to be determined is the current density J(r), which is found as the solution of an integral equation. It is written as a matrix equation, after the MoM discretization (Davidson, 2005), in which MoM stands for method of moments. The solution is achieved in an iterative approach, by methods such as conjugate gradient, which uses approximately N2 operations
per iterations, with N equals to the number of unknowns.
The problem of a metallic object subjected to an incident
electric ield Ei(t) is represented by the electric ield
integral equation (EFIE) (Davidson, 2005):
tµsG(r , r’) J(r’)dS’ = tE i(
r)
4Ui
kM
(1)
where,
t represents an unit tangent vector on the surface S; k the wave number;
J(r’) the current density unknown;
η the medium impedance; and i the imaginary term.
The primed r variable regards the source variable and the unprimed r is the observation point variable. G is the Green Function representing the problem, given by Eq. 2 (Davidson, 2005):
G(r , r’) = (1- 1 r)
k2 e
ik|r - r’|
|r - r’| (2)
Analogously, a magnetic ield integral equation (MFIE)
can also be written. When there are resonances due to enclosed cavities, numerical problems arise. The solution is the use of a combination of both MFIE and EFIE, named Combined Field Integral Equation. That is the reason to avoid hollow structures; the missile or aircraft model is better simulated as made of a solid piece of metal, without hollow parts in their interiors. These equations can be
numerically solved by the MoM, which basically inds the
solution by a matrix inversion.
Figure 2. The left picture shows that in the MoM all elements are allowed to couple to each other, generating a very dense matrix. The MLFMM, on the right, allows only certain elements to couple, resulting in a sparse matrix.
2.85 m 0.66 m
Figure 3. Picture showing the missile with its main dimensions.
It is interesting to stress that some methods, like the Finite-Difference-Time-Domain (FDTD), rely on mathematical operations that fundamentally are simple, requiring subtractions and sums, but at expenses of large and constant memory accesses. On the other hand, MoM and MLFMM require the inversion of a large matrix, mathematically and computationally much more processor (CPU) intensive (Munteanu, Timm and Weiland, 2010). As the frequency increases even further, turning the electrical size of the problem too large, then the alternative is the use of asymptotic methods (Geometrical Optics – GO). A ray tracing
scheme computes the incoming and relected rays
(Shooting and Bouncing Rays – SBR). Evidently, there is a tradeoff between the precision and the computational effort between the two approaches, MoM/MLFMM, and asymptotic. It can be stated that, as a general rule, the accuracy increases as we move from Asymptotic to MLFMM and to MoM, whereas the simulation speed that requires the random-access memory (RAM) decreases.
The SBR method launches a dense grid of inite rays that hit the object, and later the multiple relections are
computed, taking into consideration the geometry of the problem. This method (Pike and Sabatier, 2002) extends
the Physical Optics (PO) by deining the surface currents
developed on the structure in terms of the computed
ields. Therefore, it is also possible to map the surface
current density, which is important for identifying hot spots in the aircraft.
The solver (numerical method used) was the I-solver (Integral Equation), based on the MoM/MLFMM method. The other solver that was employed was the A-solver (Asymptotic), based on the Shooting and Bouncing Rays method.
RESULTS AND DISCUSSION
Bistatic simulations
The missile here analyzed is named Piranha, which was developed by a joint program between the Brazilian Air Force and the Navy. It is a short range, air-to-air unit, with an infrared seeker (Coelho, 2007). Figure 3 shows the model and its main dimensions. For 10 GHz, its electrical size is 95 λ long and 22 λ wide.
The 3D complete missile model was imported from a
mechanical computer aided design ile (CAD) (Catia,
90
60
30
0 20 5 -10 -25
300
330
270 240
210 180
150
120
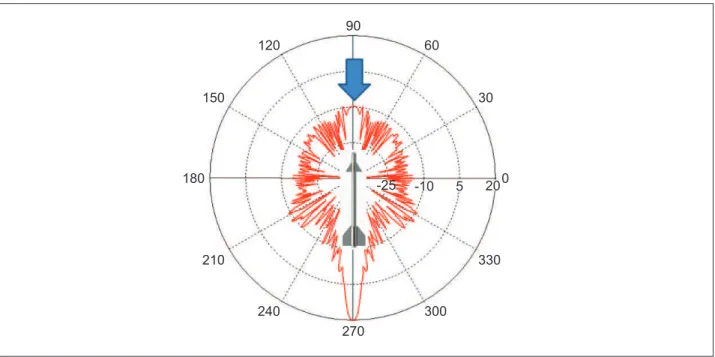
Figure 5. Computed RCS, units (dBsm). The scenario involves a bistatic response to a frontal excitation (90º in the igure).
Figure 4. Surface mesh for the object. Zoomed in is a detailed area near the stabilizers.
approximately smaller than one tenth of the wavelength (relative to the incoming plane wave), it can be removed
without gross loss of accuracy. The dificulties associated
with the mesh around a small screw or bolt (smaller than one tenth of wavelength), for instance, do not pay off in terms
of inal accuracy. It is therefore simpler if it is eliminated.
The irst study regards the bistatic RCS response to a
X-band, 10 GHz signal (frequency where most onboard radars operate). For that, the incoming plane wave is assumed to be incident right on the frontal side of the
missile (90º in the Fig. 5), with the electric ield aligned to
the missile longitudinal axis, as Fig. 5 suggests. The results of the bistatic RCS is also shown in Fig. 5. It can be seen that the frontal RCS has a value of -9.6 dBSm. The RCS considers the absolute power received with the co and cross polarizations included. It means that the absolute power involves both vertical and horizontal polarizations – actually the square root of both squared components. A real world measurement will have to count on antennas able to receive both polarizations. The simulation used the
MoM/MLFMM Method, with irst order elements. They
are triangles with straight sides, and they enable a faster simulation in comparison to higher order elements.
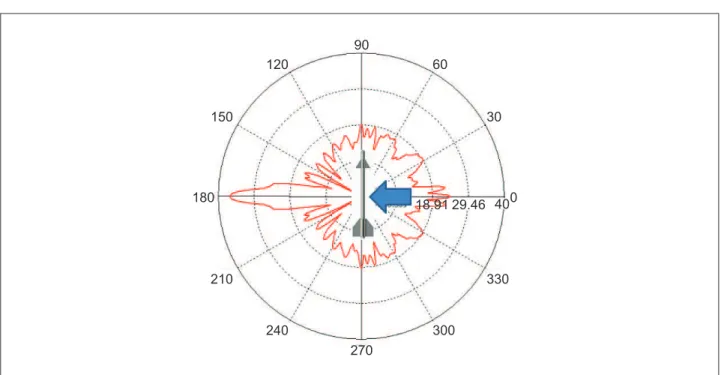
Another point of interest is the lateral incidence. Figure 6
shows the excitation (the electric ield here is orthogonal
to the missile axis), and the respective result. For this situation, the lateral RCS has a value of 24 dBsm. Surface cells are computationally more demanding than
hexahedral cells (used by time domain/inite-difference
time-domain (FDTD) or transmission line method (TLM) solvers) (Munteanu, Timm and Weiland, 2010). It means that with hexahedral cells the structure is represented by the use of small bricks (the mesh cells), whereas for the surface mesh, small planar triangles have to cover the structure surface, adjusted to complex details so that
they accurately represent ine details. Figure 4 shows the
surface mesh for the object. It can be seen that the mesh elements are homogeneous (they have similar sizes), even in the region of the stabilizers. It greatly improves the convergence of the problem.
A/m
0.01 0.00838 0.0071 0.006 0.00504 0.00422 0.0035 0.00289 0.00236 0.0019 0.0015 0.00116 0.000866 0.000611 0.000391 0.000201 0
Figure 7. Current distribution caused by a frontal (left) and lateral (right) incidence. The red areas are those where higher amplitudes are developed due to the incoming plane wave. Since the lateral incidence has a higher overall RCS than the frontal case, it also develops currents with larger amplitudes.
90
60
30
0 40 29.46 18.91
300
330
270 240
210 180
150
120
Figure 6. Computed RCS, units (dBsm). The scenario involves a bistatic response to a lateral excitation (0º in the igure).
The results presented in Figs. 5 and 6 show that the scattered power is higher to the situation where the missile is illuminated laterally (-9.6 for frontal versus
24 dBsm for the lateral case). It is intuitive to see that the physical area that intersects the incoming wave is larger for the lateral case, justifying the difference. A lateral illumination of an incoming missile is however preferred for an earlier incoming missile detection. For the case of an onboard radar which detected an incoming missile, few seconds are left for the detection and the evasion maneuver. Thus, few decibels of difference in the received signal (related to the RCS parameter dBsm) can enlarge the period between the
detection and evasion, increasing the survivability rate of the plane under attack.
Another result of the simulation is the identiication
of the hot spots, namely the particular points on the surface that concentrate the higher currents when illuminated by the plane wave. These currents are responsible for scattering the energy back to the source. Therefore, if the goal is to minimize the RCS towards a stealth vehicle design, those hot spots need to be
identiied and eliminated. The alternative to eliminate
et al. (2011), measurements are presented, which show that by covering a missile with RAM, the overall RCS is lowered. Figure 7 depicts the hot spots (visualized as red areas) for the frontal (Fig. 5) and lateral (Fig. 6) incidences. The incident plane wave has amplitude of 1 V/m. Since the frontal incidence has an overall lower RCS (the intersection area is much smaller than that of the lateral case), the developed currents are also of lower amplitude.
Monostatic simulations
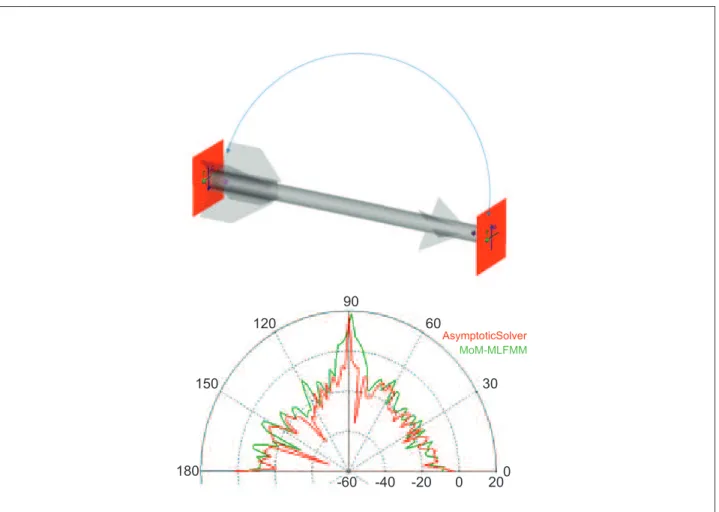
A monostatic scenario involves the rotating of the transmitter around the target, i.e., the transmitter and the receiver are located in the same point. Computationally, it is a more challenging task, since for every position the electromagnetic environment is different, generating a different system matrix, too. Figure 8 shows that the incident wave is swept from the frontal direction (equivalent to 0º) to the rear side of
is computed in that single direction only. The results also present a comparison between the MoM/MLFMM and the asymptotic solver.
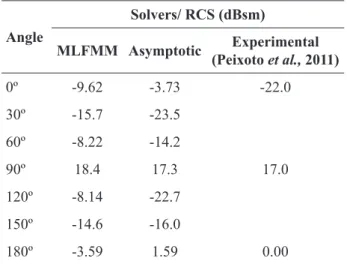
A comparison between the results of both techniques is shown in Table 1 alongside with some experimental results (Peixoto et al., 2011).
It is worth mentioning that the measurement setup showed a dynamic range limitation, i.e. too high-noise
loor (Peixoto et al., 2011). Therefore, only the higher energy peaks of RCS were detected, like for the angles
of 180 and 90 in Table 1. It justiies the differences
seen for other angles, like 0. Another difference relies on the fact that the warhead is not metallic (it contains the infrared seeker and other systems, so it needs to be transparent), whereas the computer model is completely metallic. It imposes a severe difference especially for
the 0º incidence. Other signiicant difference is the fact
that the measurement was done in an outdoor facility, with the presence of the ground, which for 10 GHz
90
-60 -40 -20 0 20
60
AsymptoticSolver
MoM-MLFMM
30
0 180
150
120
Angle
Solvers/ RCS (dBsm)
MLFMM Asymptotic Experimental (Peixoto et al., 2011)
0º -9.62 -3.73 -22.0 30º -15.7 -23.5
60º -8.22 -14.2
90º 18.4 17.3 17.0 120º -8.14 -22.7
150º -14.6 -16.0
180º -3.59 1.59 0.00
Table 1. Comparison between the performances with two different solvers and measurements.
may behave like a kind of ground plane, whereas
the simulation was done in a perfect non-relective
environment (Peixoto et al., 2011).
Comparisons with measurements involve a dificult task,
regarding an accurate object model (not easily available with correct materials and geometrical details), as well as a correct representation of the measurement setup. Therefore, computer simulations should be faced as a complement to measurements, enabling a somewhat easier and less costly alternative.
The faster simulation of the asymptotic solver results in some angles showing larger differences compared with the I-solver (for instance 60º and 120º). Further
reinements in the asymptotic solver, like requiring
higher precision, might better approximate those results in regard of comparisons with the MLFMM. It is usually assumed that both solvers show similar results for regions where a high RCS value is present (main lobes), whereas minor lobes or nulls may present considerable differences. The use of more than one solver comes into play whenever it is necessary to cross-check results from within virtual simulations, i.e., when measurements are not available. If two different numerical methods with two different mesh types give results that are similar (though not absolutely equal),
the user can then achieve a certain degree of conidence
on the simulation.
A comparison showing the performance in terms of required RAM memory and time is shown in Table 2. The computer used was a Quad Core Opteron, 2.51 GHz, with 64 GBytes RAM. It is noticeable that the asymptotic solver presents an advantage by trading the speed for precision (Sadiku, 2001; Huang and Boyle, 2008).
CONCLUSIONS
A study concerning the X-band RCS signature of a real air-to-air missile is presented. Two numerical techniques to perform the computer simulation are shown, alongside with results compared to measurements performed in an outdoor facility. The results showed a reasonable similarity with measurements, considering that the real world measurement setup and the missile were not completely similar to the virtual representation. Since RCS measurements require a complex and sophisticated setup, which is not always available, prediction techniques based on simulation can be implemented in order to complement the real world measurements. The requirements for computer prediction are the software package and a moderately equipped hardware, alongside with mechanical models of the objects that are free from unnecessary details, but they are also accurate in terms of dimensions and shapes.
REFERENCES
Catia, 1998, version 5, Retrieved in Oct, 27th 2011, from
www.3ds.com.
Coelho, L. V., 2007, “Missile Approach Warning System and its application in defense aircraft”, Conference SIGE IX, São José dos Campos, Brazil, in Portuguese.
CST Microwave Studio, version 2010, Retrieved in Oct, 27th 2011, from www.cst.com.
Davidson, D.B., 2005, “Computational Electromagnetics for RF and Microwave Engineering”, Cambridge University Press, Cambridge, England.
Grant, R., 2010, “The radar game: understanding stealth and survivability”, Mitchell Institute Press, Arlington, the US.
Huang, Y., Boyle, K., 2008, “Antennas: from theory to practice”, Ed. Wiley, West Sussex, the UK.
Kouemou, G., 2009, “Radar Technology”, Ed. In-Teh, Vukovar, Croatia.
Munteanu I., Timm M., Weiland T., 2010, “It’s about time”, IEEE Microwave Magazine, Vol. 11, No. 2, p. 60-9.
Comparison Asymptotic MLFMM
Simulation time 4 minutes 9 hours Peak RAM used 48 Mbytes 2.8 GBytes
M.C., 2011, “Measurements in an Outdoor Facility and Numerical Simulation of the Radar Cross Section of Targets at 10 GHz”, Journal of Aerospace Technology and Management, São José dos Campos, Vol. 3, No. 1, p. 73-8.
Pike, E.R., Sabatier P.C., “Scattering”, 2002, Ed. Academic Press, ISBN 0-12-613760-9, London, the UK.
Electromagnetics”, 2nd Edition, CRC Press.
Skolnik, M.I., 1981, “Introduction to Radar Systems”, 2nd Edition, Ed. Mc Graw Hill.