Separation of Light Naphtha for
the Octane Upgrading of Gasoline
Separation of Light Naphtha for
the Octane Upgrading of Gasoline
Adsorption and Membrane Technologies
and New Adsorbents
A dissertation presented to the
Faculdade de Engenharia da Universidade do Porto For the degree of Doctor in Chemical
and Biological Engineering
by
Patrick da Silva Bárcia
Supervisor: Prof. Alírio E. Rodrigues Co-supervisor: Prof. José A.C. Silva
LSRE – Laboratory of Separation and Reaction Engineering Department of Chemical Engineering
University of Porto
Agradecimentos
Akcnowledgements
Aos meus orientadores, Professor Alírio Rodrigues e Professor José Silva, pela oportunidade concedida, acompanhamento científico, dedicação, sabedoria e amizade demonstrada ao longo deste trabalho.
Ao LSRE (Laboratory of Separation and Reaction Engineering), na pessoa do Professor Alírio Rodrigues, e à direcção da Escola Superior de Tecnologia e de Gestão do Instituto Politécnico de Bragança, pelas condições técnicas disponibilizadas.
A todos os colegas do LSRE pela amizade e espírito de camaradagem demonstrada ao longo destes anos. Um agradecimento especial à Patricia, ao Miguel, à Carolina, ao Nuno, à Inês, ao Laurent, ao Carlos Grande, à Carla, e ao Granato.
Ao meus pais, Abílio e Maria Isabel, por tudo, e principalmente pelo apoio que tive e sempre terei. Agradeço também ao meu irmão, aos familiares e amigos, que estiveram sempre do meu lado.
To Professor Sofia Calero and Elena from Universidad Pablo de Olavide (Seville), for their collaboration in the preliminary molecular simulation studies.
To Professor Banglin Chen, from the University of Texas (USA), Professor Gérard Férey and Professor Christian Serre, from Université de Versaille (France), for their collaboration in the synthesis of MOFs.
To Professor Freek Kapteijn and his team, Jorge, Alexandre, and Sonia, for receiving me during my stay at DelftChemTech, and for their cooperation in making possible the introduction at LSRE of technical expertise in the synthesis of zeolite materials and zeolite membranes. Thanks to Johan van den Bergh for the help with the membrane setup. Thank you also to Pedro, Chieh-Chao, Joana, Asun, Ana Rita, Alvaro, Alexandro, Loli… I enjoyed the time I spent in The Netherlands. Thank you guys!
Abstract
The aim of this work is to contribute for the development of adsorption based separation processes with considerable potential for commercial application on the refining industry, namely, in the separation of high research octane number (HRON) paraffins from light naphtha fractions. The development of an adsorption process requires first a detailed knowledge of equilibria and kinetics of adsorption and their impact on the dynamic response of an adsorption column. Accordingly, we start collecting single and mixture adsorption equilibrium isotherms of C6 isomers, n-hexane
(nHEX), 3-methylpentane (3MP), 2,3-dimethylbutane (23DMB), and 2,2-dimethylbutane (22DMB), from breakthrough experiments in zeolite beta. This adsorbent was selected because its pore system posses interesting characteristics for the separation of HRON dibranched C6 from their low research octane number (LRON)
monobranched isomers. It was found that the sorption hierarchy in zeolite beta was most favourable towards the linear isomer and least favourable towards the di-branched ones. Zeolite beta demonstrated significant selectivity to discriminate between mono and dibranched C6 isomers, especially at low coverage. Based on an
analysis of sorption events at the molecular level, a Tri-Site Langmuir model (TSL) was developed to interpret the equilibrium data with good accuracy.
Sorption kinetics studied by zero-length chromatography technique allowed us to find the nature of controlling diffusion mechanism; for nHEX and 3MP macropore diffusion is controlling. For 23DMB and 22DMB, the system is governed apparently by both macropore and micropore diffusion.
The dynamics of equimolar C5/C6 paraffin fractions in a fixed bed of zeolite beta was
studied. Breakthrough experiments demonstrate that the sorption hierarchy is temperature-dependent. At 583 K, an enriched HRON fraction of 22DMB, iso-pentane (iPEN) and 23DMB can be selectively separated from the isomerate feed. For the case of feed mixtures with the typical composition of the hydroisomerization reactor product, the enriched fraction contains LRON n-pentane (nPEN) which decreases the octane quality of the product obtained. However, the use of a layered bed with zeolite 5A and zeolite beta can displace the nPEN from the enriched fraction, resulting in a maximum octane number of about 92.5 points. Aspen Adsim was used to simulate the dynamic behaviour of the C5/C6 fraction in a non-isothermal and non-adiabatic bed
The performance of a layered pressure swing adsorption (PSA) process for the separation of HRON paraffins from a C5/C6 light naphtha fraction is simulated using a
detailed, adiabatic single column PSA model. A zeolite 5A layer is used for selective adsorption of LRON n-paraffins while a zeolite beta layer is used to reduce the concentration of the LRON 3MP in the HRON fraction. The effects of various indepen-dent process variables (zeolite 5A-to-zeolite beta ratio, purge-to-feed ratio, cycle time, depressurization mode and operating temperature) on the process performance (product RON, HRON molecules recovery, HRON purity, and process productivity) are evaluated. It is demonstrated that an optimal zeolite 5A-to-zeolite beta ratio can improve the product average RON of up to 1.0 point comparatively to existing processes using zeolite 5A only. Moreover, process simulations demonstrated that an increase of 20 K in the operating temperature results in octane gain of 0.2 RON.
The study and development of membrane technologies was also included in this work as an alternative to PSA processes. The preparation of supported zeolite beta membranes was successfully achieved by exploring several combinations of seeding techniques and synthesis methods. The surface of the membranes was completely covered by well intergrown crystals. The quality of the membranes was tested by means of pervaporation of ethanol/1,3,5-triisopropylbenzene mixtures together with permporometry experiments. The performance in the vapour separation of quaternary equimolar mixtures of C6 isomers showed that permeate flux decreases as the
branching degree increases following the order: nHEX>>3MP>23DMB>22DMB. In the retentate, the fractions of 3MP and nHEX decrease while the concentration of dibranched isomers is increased compared to the feed composition. The RON of the quaternary mixture was enhanced up to 5 points with the best synthesized membrane.
The potential application of the novel metal-organic frameworks (MOFs) as an alternative to zeolites was also addressed. A screening study for mixtures of C6 isomers
was performed in three different MOFs.The first is a rigid zirconium terephthalate UiO-66, which possesses two types of cages of diameter 12 Å and 9 Å; the second is a chromium trimesate MIL-100(Cr), which possesses a rigid structure with giant cages accessible through 5-9 Å microporous windows; and the third is the flexible Zn2
(BDC)2(H2O)2·(DMF) (MOF-2), in which the pore system contains 1-D large channels.
Multicomponent equimolar experiments show that UiO-66 exhibits inverse shape selectivity for C6 isomers, being the retention governed by the rotational freedom of
Resumo
O objectivo deste trabalho consistiu no desenvolvimento de processos adsorptivos com potencial para a aplicação na indústria de refinação, nomeadamente, na separação de parafinas com elevado índice de octanas (parafinas HRON) a partir de fracções de nafta leve. O desenvolvimento de um processo adsorptivo requer em primeiro lugar o conhecimento detalhado do equilíbrio e da cinética de adsorção e do seu impacto na resposta dinâmica de um leito de partículas de adsorvente. Procedeu-se numa primeira faProcedeu-se, à medição de isotérmicas de equilíbrio de adsorção dos isómeros de C6, n-hexano (nHEX), 3-metilpentano (3MP), 2,3-dimetilbutano (23DMB),
e 2,2-dimetilbutano (22DMB), e correspondente misturas, a partir da medição de curvas de ruptura em zeólito beta. Este adsorvente é produzido em larga escala para processos catalíticos e foi seleccionado porque o seu sistema de poros possui características interessantes para a separação entre os hexanos bi-ramificados e os seus isómeros mono-ramificados de baixo índice de octanas (parafinas LRON). Observou-se que a hierarquia de adsorção no zeólito beta é ditada pelo grau de ramificação dos isómeros, sendo o composto mais adsorvido o nHEX. O zeólito beta mostra um grau de selectividade significativo entre isómeros mono- e bi-ramificados, especialmente na gama de baixa pressão parcial. Foi desenvolvido um modelo denominado Tri-site Langmuir para interpretar com rigor os dados de equilíbrio.
A cinética de sorção, estudada através da técnica cromatográfica ZLC, permitiu encontrar a natureza do mecanismo de difusão controlante. Para nHEX e 3MP, a cinéti-ca é governada pela difusão nos macroporos, enquanto que, para 23DMB e 22DMB, o controlo da cinética é aparentemente repartido entre macroporos e microporos.
O estudo da dinâmica de fracções equimolares C5/C6 num leito fixo de zeólito beta
monstra que a hierarquia de sorção varia com a temperatura. À temperatura de 583 K, uma fracção enriquecida com 22DMB, iPEN (isopentano) e 23DMB, pode ser selectivamente separada do isomerado. No caso em que a alimentação tem a composição típica do produto resultante da hidroisomerização, obtém-se uma fracção enriquecida com uma percentagem significativa de nPEN (n-pentano), o que reduz o índice de octano do produto final. No entanto, a utilização de um leito em camadas, com zeólito 5A e zeolito beta, contribui para a retenção do nPEN, evitando a contaminação da fracção enriquecida. Obtém-se assim, no produto acumulado, um índice de octanas máximo de 92.5 pontos. O comportamento dinâmico da fracção C5/C6 num leito não-isotérmico e não-adiabático foi simulado com o Aspen Adsim. As
O desempenho de um processo de adsorção cíclico, baseado no conceito “Pressure Swing Adsorption” (PSA), para a produção de parafinas HRON a partir de fracções de nafta leve na gama C5/C6, foi simulado utilizando um modelo detalhado. A camada de
zeólito 5A adsorve selectivamente n-parafinas LRON, enquanto que a camada de zeólito beta reduz a concentração do LRON 3MP na fracção enriquecida com compostos HRON. Foi estudado o efeito de diferentes variáveis independentes (razão zeólito 5A/zeólito beta, razão purga/alimentação, tempo de ciclo, modo de despressurização, e temperatura de operação) no desempenho do processo (RON do produto, recuperação de compostos HRON, pureza dos compostos HRON, e produtividade do adsorvente). Demonstrou-se que uma relação óptima entre as quantidades de zeólito 5A e de zeólito beta, permite melhorar o RON do produto até 1.0 ponto, comparativamente ao processo que utiliza exclusivamente zeólito 5A. Além disso, as simulações mostram que um aumento de 20 K na temperatura de operação, resulta num ganho adicional de 0.2 RON.
O estudo e o desenvolvimento de tecnologias de membranas foram também incluídos neste trabalho, como uma alternativa aos processos PSA. A preparação de membranas de zeólito beta foi levada a cabo combinando diferentes técnicas de “seeding and secondary growth”. O desempenho das membranas na separação de vapor de misturas quaternárias equimolares de isómeros C6 mostrou que o fluxo de
permeado diminui com o aumento do grau de ramificação na seguinte ordem: nHEX>> 3MP> 23DMB> 22DMB. No retido, a fracção de isómeros bi-ramificados aumenta relativamente à composição da alimentação. O RON da mistura quaternária foi reforçado até 5 pontos, com a melhor membrana.
A potencial aplicação dos “metal-organic frameworks” (MOFs) como alternativa aos zeólitos foi também abordada neste trabalho. Foi estudada a performance de três diferentes MOFs para a separação de misturas de isómeros C6. O UiO-66, é uma
estrutura rígida constituída por dois tipos de jaulas de diâmetro 12 Å e 9 Å. O MIL-100(Cr), possui uma estrutura rígida com jaulas gigantes, acessível através de janelas com diâmetro entre 5 e 9 Å. O MOF-2, apresenta uma estrutura flexível e um sistema de canais largos 1D. As experiências com misturas equimolares mostram que o UiO-66 exibe selectividade inversa para isómeros C6, sendo a retenção ditada pela liberdade
de rotação das moléculas nas jaulas de 9 Å. No MIL-100(Cr), a hierarquia de adsorção é similar aquela encontrada no zeólito beta. Finalmente, o MOF-2 exibe um mecanismo dinâmico de contracção dos poros, induzido pela presença de adsorbato. Essa contracção resulta na adsorção selectiva de n-parafinas, e na consequente exclusão dos compostos ramificados.
Sommaire
L'objectif de cette thèse est de développer des procédés de séparation par adsorption, avec grand potentiel d’applications sur l'industrie du raffinage, à savoir, pour la séparation des paraffines à indice d'octane élevé (paraffines HRON) à partir des fractions de naphta légère. Le développement d'un processus d'adsorption requiert d'abord une connaissance détaillée des paramètres cinétiques et des équilibres d'adsorption, et de leur impact sur la réponse dynamique d'une colonne d'adsorption. Nous avons commencé par mesurer les isothermes d'équilibre d'adsorption des isomères de C6 purs, n-hexane (nHEX), 3-methylpentane (3MP), 2,3-dimethylbutane
(23DMB), et 2,2-dimethylbutane (22DMB), et de ces mélanges, à partir des courbes de perçage dans la zéolithe bêta. Cet adsorbant a été sélectionné car son système de pores possède des caractéristiques intéressantes pour la séparation des HRON C6
di-branchés, de leurs isomères mono-branchés de faible indice d'octane (paraffines LRON). Il a été constaté que la hiérarchie d'adsorption dans la zéolithe bêta était plus favorable à l’adsorption des isomères peu ramifiés. La zéolithe bêta présente une sélectivité considérable pour la séparation mono-/di-branchés, surtout dans la gamme de basse pression partielle. L’analyse des événements de sorption au niveau moléculaire a servi de support pour le développement d’un modèle Tri-site Langmuir, qui a été utilisé pour interpréter les données d'équilibre avec une bonne précision.
La cinétique de sorption, étudiée par la technique ZLC, nous a permis de trouver la nature du mécanisme de contrôle de la diffusion. Pour nHEX et 3MP, la diffusion dans les macropores est dominante, alors que pour 23DMB et 22DMB, le système est apparemment régi par la diffusion à la fois dans les macropores et les micropores.
La dynamique des fractions équimolaire de paraffines C5/C6 dans un lit fixe de
un lit fixe non-isotherme et non-adiabatique, donnant une bonne description de l'ensemble des données expérimentales.
La performance d'un procédé cyclique d’adsorption, basé sur le concept “Pressure Swing Adsorption” (PSA), pour la production de paraffines HRON à partir d'une fraction de naphta légère C5/C6, a été simulé utilisant un modèle détaillé. Une couche de
zéolithe 5A a été utilisée pour l'adsorption sélective des n-paraffines, tandis qu'une couche de zéolithe bêta a permit de réduire la concentration du LRON 3MP dans le produit enrichie. On a évalué l’effet de diverses variables indépendante (ratio zéolite 5A/zéolithe bêta, ratio purge/alimentation, le temps de cycle, le mode de dépressurisation, et la température d’opération) sur la performance du processus (RON du produit, récupération des composées HRON, pureté des composées HRON, et productivité de l’adsorbant). Il a été montré qu’un ratio optimal zéolithe 5A/zéolithe bêta, peut augmenter le RON du produit jusqu'à 1.0 point, comparativement aux processus traditionnels qui utilisent uniquement la zéolithe 5A. En outre, les simulations montrent que l’augmentation de 20 K sur la température opération, con-tribue à un gain additionnel de 0.2 points dans l’indice d'octane de la fraction enrichie.
L'étude et le développement des technologies membranaires ont été également inclus dans ce travail, comme une alternative aux procédés PSA. Des membranes de zéolithe bêta ont été synthétisées sur des supports céramiques, en utilisant la technique «seeding and secondary growth». Leur performance pour la séparation des mélanges de vapeur équimolaire d'isomères C6 a montré que le flux de perméat
diminue avec le degré de ramification suivant l'ordre. Dans le rétentat, la concentra-tion de composé di-branchées augmente par rapport à la composiconcentra-tion de l'alimenta-tion. Le RON du mélange a été amélioré jusqu'à 5 points avec la meilleure membrane.
Le potentiel des « metal-organique frameworks » (MOFs) a aussi été abordé comme une alternative aux zéolithes. Trois différents MOFs ont été étudiés pour la séparation de mélanges d'isomères C6: la structure rigide, UiO-66, qui possède deux types de
cages de 9 Å et 12 Å ; le MIL-100(Cr), rigide, avec des cages géantes accessible par des fenêtres entre 5 Å et 9 Å ; et le MOF-2, une structure flexible qui contient des canaux larges 1D. Les courbes de perçage des mélanges équimolaires montrent que l’UiO-66 présente une sélectivité inverse pour les isomères C6. La rétention dans la maille du
Table of Contents
LIST OF FIGURES
VII
LIST OF TABLES
XVII
LIST OF SYMBOLS
XX
INTRODUCTION
1-1
1.1 Relevance and Motivation 1-1
1.1.1 The Development of Light Naphtha Isomerization Processes 1-2 1.1.2 Zeolites as Separating Media for Recycling Technologies 1-10
1.1.3 The Zeolite Membrane Alternative 1-13
1.1.4 Metal-Organic Frameworks as an Alternative to Zeolites 1-15
1.2 Objectives and Outline 1-16
1.3 References 1-24
SINGLE ADSORPTION EQUILIBRIUM AND KINETICS OF C
6ISOMERS IN ZEOLITE BETA
2-1
2.1 Introduction 2-2
2.2 Adsorption Equilibria 2-2
2.2.1 Langmuir Model 2-3
2.2.2 Nitta Model 2-4
2.2.3 Dual-site Langmuir Model 2-5
2.2.4 Toth Model 2-6
2.3 Sorption Kinetics 2-6
2.3.1 Modelling ZLC Experiments 2-7
2.5 Zeolite Beta Structure 2-10
2.6 Experimental Section 2-10
2.6.1 Adsorbent Characterization 2-10
2.6.2 Adsorption Equilibrium and ZLC Apparatus 2-15
2.6.3 Experimental Procedure 2-17
2.7 Results and Discussion 2-19
2.7.1 Pure component Breakthrough Curves 2-19
2.7.2 Pure component Equilibrium Data 2-21
2.7.3 Modelling of Pure Component Isotherms 2-28
2.7.4 Kinetics of Sorption 2-32
2.8 Conclusions 2-41
2.9 References 2-42
MULTICOMPONENT ADSORPTION OF C
6ISOMERS IN
ZEOLITE BETA
3-1
3.1 Introduction 3-2
3.2 Theoretical Analysis 3-2
3.2.1 Equilibrium Data from Multicomponent Breakthrough Curves 3-2
3.2.2 Tri-site Langmuir Model 3-3
3.2.3 Support to TSL model Theory from Molecular Simulation 3-6
3.3 Modeling of Breakthrough Experiments 3-10
3.4 Experimental Section 3-15
3.4.1 Experimental Set-up 3-15
3.4.2 Experimental Procedure 3-18
3.5 Results and Discussion 3-20
3.5.1 TSL Model Applied to the Adsorption of C6 Isomers in Zeolite Beta 3-20
3.5.2 Binary Adsorption Isotherms 3-23
3.5.3 Ternary Adsorption Isotherms 3-23
3.5.4 Quaternary Adsorption Isotherms 3-26
3.6 Multicomponent Breakthrough Curves 3-30
3.6.1 Influence of Temperature on Binary Breakthrough Curves of C6 Isomers 3-30 3.6.2 Influence of Temperature on Ternary Breakthrough Curves of C6 Isomers 3-33 3.6.3 Influence of Temperature on Quaternary Breakthrough Curves of C6 Isomers 3-35
3.7 Conclusions 3-37
ADSORPTION DYNAMICS OF C
5/C
6FRACTIONS IN A
LAYERED BED OF ZEOLITE BETA AND ZEOLITE 5A
4-1
4.1 Introduction 4-2
4.2 Migration to Aspen Adsim Simulator 4-4
4.3 Model Development 4-6
4.3.1 Feed Model 4-7
4.3.2 Product Model 4-7
4.3.3 Bed Model 4-8
4.4 Experimental Section 4-17
4.4.1 Adsorbent and Adsorbates 4-17
4.4.2 Experimental Equipment and Procedure 4-17
4.5 Results and Discussion 4-17
4.5.1 Adsorption Equilibrium of C5/C6 Isomers in Zeolite Beta 4-17 4.5.2 Equimolar C5/C6 Six-Component Breakthrough Curves 4-22 4.5.3 Analysis of Heat Effects in Adsorption Column Dynamics 4-25 4.5.4 C5/C6 Six-Component Breakthrough Curve of the Typical Hydroisomerization
Reactor Product 4-27
4.5.5 Simulation of C5/C6 Six-Component Breakthrough Curves on a Layered Bed 4-30
4.6 Conclusions 4-32
4.7 References 4-33
SEPARATION OF C
5/C
6LIGHT NAPHTHA BY LAYERED
PRESSURE SWING ADSORPTION
5-1
5.1 Introduction 5-2
5.2 Study of a Single Column Layered PSA Cycle 5-5
5.2.1 PSA Process Description 5-5
5.2.2 Definition of the Parametric Study 5-10
5.2.3 Process Performance Criteria 5-11
5.3 Model Development 5-12
5.3.1 Feed Model 5-13
5.3.2 Valve Model 5-13
5.3.3 Tank Void Model 5-14
5.3.4 Product Model 5-14
5.3.5 Bed Model 5-14
5.3.6 Cycle Organizer 5-16
5.3.7 Numerical Methods 5-18
5.4.1 Layered PSA –General Dynamics 5-19
5.4.2 Concentration Profiles in the Layered Bed at Cyclic Steady State 5-24 5.4.3 Effect of the P/F Ratio for Different Values of L5A/LB 5-29 5.4.4 Effect of the Cycle Time for Different Values of L5A/LB 5-34 5.4.5 Effect of the Temperature for Different Values of L5A/LB 5-34
5.4.6 Effect of the Depressurization Mode 5-36
5.4.7 General Performance of the Layered PSA Process 5-37
5.5 Conclusions 5-40
5.6 References 5-41
ZEOLITE BETA MEMBRANES FOR THE SEPARATION OF C
6ISOMERS
6-1
6.1 Introduction 6-2
6.2 Experimental 6-5
6.2.1 Preparation of α-Alumina Supported Zeolite Beta Membranes 6-5 6.2.2 Static Characterization of Membranes and Materials 6-8 6.2.3 Dynamic Characterization of Supported Membranes 6-10
6.3 Results and Discussion 6-18
6.3.1 XRD Patterns 6-18
6.3.2 N2 Permeation 6-19
6.3.3 Morphology 6-20
6.3.4 TIPB Pervaporation 6-21
6.3.5 Permporometry 6-26
6.3.6 Mixture Separation Measurements 6-27
6.4 Conclusions 6-33
6.5 References 6-34
SEPARATION OF C
6ISOMERS IN METAL-ORGANIC
FRAMEWORKS
7-1
7.1 Introduction 7-2
7.2 Activation of the MOFs and Preparation of the Adsorption Column 7-3
7.3 Separation of C6 Isomers in the Rigid MOF UiO-66 7-4
7.3.1 Experimental Procedure 7-4
7.3.2 Adsorption of Quaternary Mixtures 7-6
7.4 Separation of C6 Isomers in the Rigid MOF MIL-100(Cr) 7-13
7.4.2 Influence of the Coordinated Water in the Adsorption of C6 Isomers in
MIL-100(Cr) 7-15
7.4.3 Effect of the Pressing/Shaping on the Adsorption of C6 Isomers in the
MIL-100(Cr) 7-18
7.5 Separation of C6 Isomers in the Flexible MOF-2 7-20
7.5.1 Experimental Procedure 7-20
7.5.2 Pure Component Adsorption 7-22
7.5.3 Binary and Ternary Adsorption 7-29
7.6 Conclusions 7-33
7.7 References 7-34
CONCLUSIONS AND SUGGESTIONS FOR FUTURE WORK
8-1
LIST OF PUBLICATIONS
I
APPENDICES
V
Single Sorption Data for nPEN and iPEN in Zeolite Beta Pellets vi
List of Figures
INTRODUCTION
1-1
Figure 1.1. World trends in the refining product demand. Numbers are the
percentage of total demand. Source: IFP (Benazzi and Cameron, 2005). 1-2 Figure 1.2. Equilibrium composition of pentane and hexane isomers as a function of
the isomerization temperature. Solid line represents the liquid phase
and dashed line gas phase equilibrium (Vermeiren and Gilson, 2009). 1-4 Figure 1.3. Simplified scheme of the conventional Total Isomerization Process (TIP):
(I) isomerization reactor; (S) hydrogen separator; (C) compressor; (A)
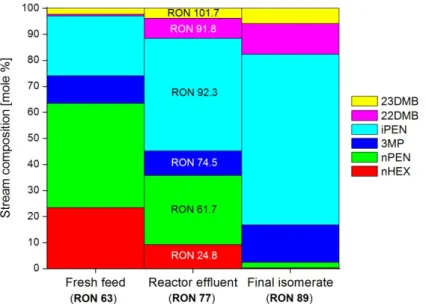
adsorption stage; (D) desorption stage. Adapted from Cusher (2004a). 1-5 Figure 1.4. Typical composition of streams in Figure 1, according to Cusher (2004a). 1-6 Figure 1.5. Variations of the conventional isomerization process: a) post-separation
isomerization process with dual-layer PSA unit (Volles, 1992) and b) basic Ipsorb process with deisopentanizer column, DIP (Minkkinen et al.,
1993). 1-7
Figure 1.6. View of a 10,500 BPSD Ipsorb unit (taken from Watripont and
Domergue, 2003). 1-9
Figure 1.7. Deisohexanizer column: height = 57 m, diameter = 7 m, weight = 221
tons. 1-9
Figure 1.8. Schematic illustration of the molecular sieving effect for normal and
branched paraffins in zeolite 5A. 1-12
Figure 1.9. Commercial application of zeolite membranes: a) Mitsui bio-ethanol pilot plant in Brazil (3.000 l/d); b) Multichannel 4A Smart zeolite membranes produced by Inocermic GmbH; c) Module with 5.8 m2 4A
Smart zeolite membranes. 1-13
Figure 1.10. Pore size tuning exemplified with the IRMOF family (Eddaoudi, 2002). 1-15 Figure 1.11. Hexane isomers: research octane number (RON); boiling point (Tb) and
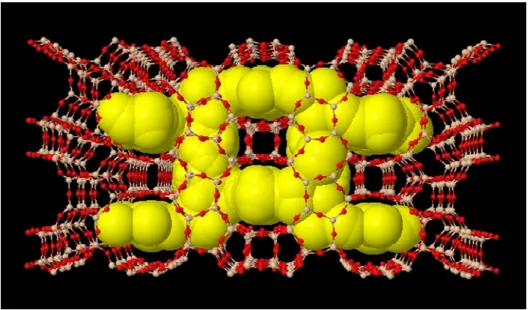
Figure 1.12. Zeolite beta framework and maximum free spheres fitting inside the
channels. 1-19
Figure 1.13. Flowchart for the development of an adsorption process. 1-21
Figure 1.14. Thesis organization. 1-23
SINGLE ADSORPTION EQUILIBRIUM AND KINETICS OF C
6ISOMERS IN ZEOLITE BETA
2-1
Figure 2.1. Porosity levels within an adsorbent particle and associated diffusion
mechanisms. (Adapted from Bárcia, 2006) 2-7
Figure 2.2. Tree-dimensional view, research octane number (RON), boiling point (Tb)
and kinetic diameter (dk) of hexane isomers. 2-9
Figure 2.3. Stereographic drawings and perspectives views of zeolite beta viewed along axis (a) [010], (b) [100] and (c) [001]. The 12-MR pores of straight and zigzag channels were also shown for a good visualization of its
structure. 2-11
Figure 2.4. (A) Zeolite beta pellets provided by Süd-Chemie AG (Si/Al=75). Scaning electron micrographs (SEM): (B) top view of the pellet (50×); (C) and (D)
different view of transversal cut (15.000×). 2-12 Figure 2.5. XRD pattern of the commercial zeolite beta powder compared with the
reference simulated pattern. 2-13
Figure 2.6. Pore size distribution obtained from the N2 desorption data using the
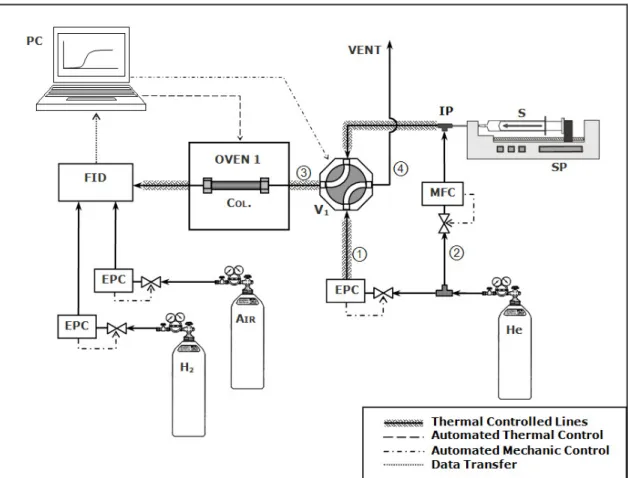
BJH formalism, in the Süd-Chemie AG zeolite beta sample. 2-14 Figure 2.7. Front view of the adsorption equilibrium and ZLC apparatus. 2-15 Figure 2.8. Schematic diagram of the ZLC experiment apparatus used to measure
adsorption equilibibrium and ZLC data. 2-16
Figure 2.9. Schematic diagram showing the method used to calculate the amount
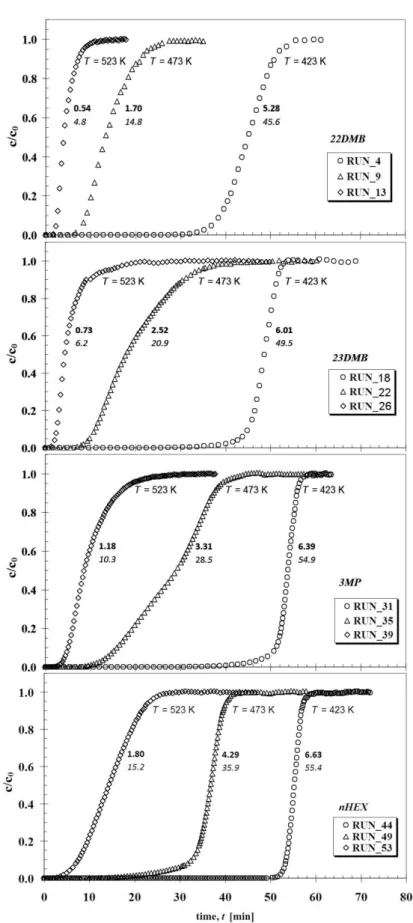
adsorbed from single breakthrough curve experiments. 2-18 Figure 2.10. Single component breakthrough curves at partial pressure near to 12
kPa, for 22DMB, 23DMB, 3MP and nHEX at 423 K, 473 K and 523 K. 2-20 Figure 2.11. Adsorption equilibrium isotherms of hexane isomers on zeolite beta. (a)
22DMB, (b) 23DMB, (c) 3MP and (d) nHEX on pellets of zeolite beta at
423K, 473K and 523K. 2-25
Figure 2.12. Semilog plot of p/q vs. q for analysis of virial isotherm of (a) 22DMB, (b)
Figure 2.13. Coverage dependence of isosteric heat of adsorption. 2-28 Figure 2.14. Adsorption equilibrium isotherm models fitted to experimental data of
(a) 22DMB, (b) 23DMB, (c) 3MP and (d) nHEX on pellets of zeolite beta. The represented models are Langmuir, dual-site Langmuir (DSL), Toth
and Nitta et al. 2-30
Figure 2.15. Effect of temperature on ZLC desorption curves: (a) 22DMB, (b) 23DMB,
(c) 3MP and (d) nHEX. Semilog plot of c/c0 vs time. 2-37 Figure 2.16. Arrhenius plot of τdiffor the hexane isomers. 2-39
MULTICOMPONENT ADSORPTION OF C
6ISOMERS IN
ZEOLITE BETA
3-1
Figure 3.1. Schematic diagram showing the method used to calculate the amount
adsorbed from experimental binary breakthrough curves. 3-3 Figure 3.2. Ternary sorption data (22DMB/23DMB/3MP at T = 423K) cannot be
predicted using the DSL model parameters from the fitting of the pure
component isotherms (Table 2.5). 3-4
Figure 3.3. Schematic representation of the hypothetical distribution of the
sorption sites in the zeolite beta framework. 3-5 Figure 3.4. Energy profiles for the BEA framework and schematic representation of
the adsorption sites: S, straight channels; I, intersection and Z, zigzag
channels. 3-7
Figure 3.5. Snapshots obtained at 100 MPa and at 423 K for a) 22DMB and b)
23DMB. 3-8
Figure 3.6. Snapshot obtained at 100 MPa and at 423 K for c) 3MP and d) nHEX. 3-9 Figure 3.7. Porosity levels in the fixed-bed and corresponding resistance to mass
transfer. 3-10
Figure 3.8. Schematic diagram of the multicomponent breakthrough experimental
apparatus. 3-16
Figure 3.9. View of the multicomponent breakthrough apparatus (a), detailed view of the independent ventilated ovens with adsorbent column (left) and
chromatographic column (right) (b), and 10-loops sample collector (c). 3-17 Figure 3.10. Schematic representation of the experimental procedure used for the
determination of the multicomponent breakthrough curves (e.g.,
Figure 3.11. FID chromatogram of a C6 isomers equimolar mixture analyzed in a 60m MTX-1 capillary column at 313 K and 20 psi helium pressure (FID temp =
523 K). 3-19
Figure 3.12. Pure component adsorption equilibrium isotherm fitted with the TSL
model. 3-21
Figure 3.13. Binary adsorption equilibrium isotherms for an equimolar mixture of (a)
22DMB/3MP and (b) 23DMB/3MP. 3-24
Figure 3.14. Ternary adsorption equilibrium isotherms for an equimolar mixture of
22DMB/23DMB/3MP on pellets of zeolite beta. 3-25
Figure 3.15. Quaternary adsorption equilibrium isotherms for an equimolar mixture
of 22DMB/23DMB/3MP/nHEX on pellets of zeolite beta. 3-27 Figure 3.16. Effect of temperature in the sorption selectivity for an equimolar
quaternary mixture 22DMB/23DMB/3MP/nHEX as a function of a) total
hydrocarbon pressure and b) total hydrocarbon loading. 3-28 Figure 3.17. Effect of temperature on binary breakthrough curves of equimolar
mixtures a) 22DMB/3MP and b) 23DMB/3MP at 1) 423 K, 2) 473 K and 3)
523 K and hydrocarbon pressure near to 14 kPa. 3-31 Figure 3.18. Effect of temperature on ternary breakthrough curves of equimolar
mixtures 22DMB/23DMB/3MP at a) 423 K, b) 473 K and c) 523 K and
hydrocarbon pressure near to 16 kPa. 3-34
Figure 3.19. Effect of temperature on quaternary breakthrough curves of equimolar mixtures 22DMB/23DMB/3MP/nHEX at a) 423 K, b) 473 K and c) 523 K
and hydrocarbon pressure near to 9 kPa. 3-36
ADSORPTION DYNAMICS OF C
5/C
6FRACTIONS IN A
LAYERED BED OF ZEOLITE BETA AND ZEOLITE 5A
4-1
Figure 4.1. a) Simplified scheme of a conventional Total Isomerization Process. b) Typical composition of streams in Figure 4.1a according to Holcombe et
al. (1990). 4-2
Figure 4.2. RON versus kinetic diameter for C5/C6 alkanes. 4-3
Figure 4.3. Aspen Adsim flowsheeting environment. 4-5
Figure 4.4. Breakthrough curve simulated with the FORTRAN code used in chapter 3 (dashed line) and with Aspen Adsim (solid line), using the model
parameters of Table 3.1 and Table 3.3. 4-6
Figure 4.5. Simple flowsheet with three blocks: feed (F1), bed (B1), and product
Figure 4.6. Heat of adsorption predicted from TSL isotherm model as a function of
the loading. 4-19
Figure 4.7. Experimental and fitted adsorption equilibrium isotherm for a C5/C6 six-component equimolar mixture of 22DMB/23DMB/3MP/nHEX/iPEN/ nPEN on pellets of zeolite beta at: a) T = 423K; b) T = 473K and c) T =
523K. 4-21
Figure 4.8. Effect of the temperature on the six-component breakthrough curves of the equimolar feed mixtures iPEN/nPEN/22DMB/23DMB/3MP/nHEX at pmix = 9.8 kPa and a) T = 423 K (Run Eq6_3), b) T = 473 K (Run Eq6_7) and
c) T = 523 K (Run Eq6_10). 4-23
Figure 4.9. Six-component breakthrough curves for an equimolar feed mixture containing iPEN/nPEN/22DMB/23DMB/ 3MP/nHEX at T = 583 K and pmix
= 9.7 kPa (Run Eq6_12). 4-24
Figure 4.10. Isothermal adsorption (dashed lines) versus isothermal and
non-adiabatic adsorption (solid lines). 4-26
Figure 4.11. Six-component breakthrough curve and RON history of the accumulated product for a feed mixture iPEN/nPEN/22DMB/23DMB/3MP/nHEX at T =
473 K and pmix = 10.2 kPa (Run Iso6_2). 4-26
Figure 4.12. Simulation of the six-component breakthrough curve and RON history of the accumulated product for a feed mixture iPEN/nPEN/22DMB/ 23DMB/3MP/nHEX in a layered bed of zeolite 5A and zeolite beta at pmix
= 10.2 kPa: a) at T = 473 K (Run Lay6_1); b) at T = 523 K (Run Lay6_2). 4-31
SEPARATION OF C
5/C
6LIGHT NAPHTHA BY LAYERED
PRESSURE SWING ADSORPTION
5-1
Figure 5.1. Schematic diagram and details of the product obtained through the
process disclosed by a) Minkkinen et al (1993), and b) Volles (1992). 5-3 Figure 5.2. Proposed scheme: TIP process incorporating a dual-layer PSA unit. 5-5 Figure 5.3. Sequence of the 4-steps PSA cycle with (a) countercurrent and (b)
co-current depressurization mode. 5-9
Figure 5.4. Schematic diagram of the single layered bed PSA with input/output
streams and gas_model blocks used for the Aspen Adsim simulations. 5-12 Figure 5.5. Cycle organizer: Steps and cycle description. 5-17 Figure 5.6. Cycle organizer: Manipulated variables. Example given for step 2 (feed). 5-18 Figure 5.7. Historical of the pressure and molar flow obtained at the column outlet
Figure 5.8. Transient variation of the gas phase temperature at the column outlet
and average RON of the accumulated product (Run_32). 5-21 Figure 5.9. Evolution of the gas phase temperature profile at the end of the feed
step with the cycle number (Run_32). 5-22
Figure 5.10. Evolution of the gas velocity profile at the end of the feed step with the
cycle number (Run_32). 5-22
Figure 5.11. Evolution of the gas phase velocity profile obtained along the bed at CSS (Run_32): a) pressurization with feed; b) adsorption; c) co-current
depressurization and d) counter-current purge with pure H2. 5-23 Figure 5.12. Gas phase concentration profile obtained along the bed at the end of
each step at CSS (Run_32): a) pressurization with feed; b) adsorption; c)
co-current depressurization and d) counter-current purge with pure H2. 5-25 Figure 5.13. Solid phase concentration profile obtained along the bed at the end of
each step at CSS (Run_32): a) pressurization with feed; b) adsorption; c)
co-current depressurization and d) counter-current purge with pure H2. 5-26 Figure 5.14. Molar composition of the product stream as a function of the total cycle
time at CSS. 5-27
Figure 5.15. Evolution of the gas phase molar fraction and temperature profiles during the adsorption step at CSS (Run_32): a) tfeed = 0 s, b) tfeed = 20 s, c)
tfeed = 40 s and d) tfeed = 60 s. 5-28
Figure 5.16. Effect of the P/F ratio on the (a) product average RON and (b) adsorbent
productivity, at CSS (T = 423K, tfeed= tpurge= 80 s). 5-30
Figure 5.17. Effect of the P/F ratio on the composition of a) isomerate product, and
b) recycle stream, and corresponding accumulated RON. 5-32 Figure 5.18. Effect of the cycle time on the composition of a) isomerate product, and
b) recycle stream, and corresponding accumulated RON. 5-33 Figure 5.19. Effect of the operating temperature on the composition of a) isomerate
product, and b) recycle stream, and corresponding accumulated product
RON. 5-35
Figure 5.20. Product average RON as a function of the zeolite 5A layer length and
purge-to-feed ratio at T = 523 K and tpress/tfeed = 20/80 s (Run 1-21). 5-38 Figure 5.21. HRON purity as a function of the zeolite 5A layer length and
purge-to-feed ratio at T = 523 K and tpress/tpurge-to-feed = 20/80 s (Run 1-21). 5-38 Figure 5.22. Recovery of HRON molecules as a function of the zeolite 5A layer length
Figure 5.23. Adsorbent productivity as a function of the zeolite 5A layer length and
purge-to-feed ratio at T = 523 K and tpress/tfeed = 20/80 s (Run 1-21). 5-39
ZEOLITE BETA MEMBRANES FOR THE SEPARATION OF C
6ISOMERS
6-1
Figure 6.1. Conceptual design of a novel ZMR process. 6-3 Figure 6.2. Tubular α-Al2O3 support from Inocermic GmbH, and application of glaze
(a); SEM observation of the support cross-section showing the
asymmetric structure (b). 6-6
Figure 6.3. View of the autoclave used for hydrothermal synthesis, with PTFE liner. 6-7 Figure 6.4. Flowchart for the preparation of zeolite membranes. 6-8 Figure 6.5. Views of the membrane module developed at LSRE: (a) cut view; (b)
disassembled module with rings and flange screws; (c) assembled module; (d) ZMR with catalyst packed in the shell side (vol. = 10 cm3); (e)
connection to the 8-way crossover valve of the ZEOPERM unit. 6-11 Figure 6.6. Schematic representation of the ZEOPERM setup operating in the N2
permeance mode. 6-12
Figure 6.7. Schematic representation of the ZEOPERM setup operating in the
pervaporation mode. 6-12
Figure 6.8. Schematic representation of the nano-permporometry setup: BPC –
back pressure controller. 6-14
Figure 6.9. Schematic representation of the ZEOPERM setup operating in the vapour separation mode: a) before permeation (feed analysis); b) during
permeation (permeate and retentate analysis). 6-16 Figure 6.10. Details of the ZEOPERM setup: a1) valves and manometers lateral panel;
a2) close-up of the evaporator; a3) close-up of the microprocessor
controlled temperature regulator for heat tracing. 6-17 Figure 6.11. XRD patterns of uncalcined powder collected from the beta membranes
synthesis compared with the (calcined) reference commercial zeolite
beta. 6-19
Figure 6.12. SEM micrographs of non-calcined beta membrane MB_1: (a) cross
section view; (b) top view. 6-22
Figure 6.13. SEM micrographs of non-calcined beta membrane MB_3: (a) cross
Figure 6.14. SEM micrographs of non-calcined beta membrane MB_10: (a) cross
section view; (b) top view. 6-24
Figure 6.15. SEM micrographs of non-calcined beta membrane MB_16: (a) cross
section view; (b) top view. 6-25
Figure 6.16. Permporometry characterization of the different zeolite beta membranes showing the residual Helium permeance as a measure of
the defect concentration. 6-26
Figure 6.17. Permeate fluxes of 22DMB, 23DMB, 3MP and nHEX equimolar mixture at T = 373 K and pmix = 1 kPa through α-Al2O3 supported zeolite beta
membranes. 6-28
Figure 6.18. Composition of the retentate 22DMB, 23DMB, 3MP and nHEX equimolar mixture at T = 373 K and pmix = 1 kPa through α-Al2O3 supported zeolite
beta membranes. 6-30
Figure 6.19. Composition of the retentate stream and octane enhancement as a function of the temperature for an equimolar mixture 22DMB, 23DMB,
3MP and nHEX through membrane MB_5. 6-32
SEPARATION OF C
6ISOMERS IN METAL-ORGANIC
FRAMEWORKS
7-1
Figure 7.1. Cages in MOF UiO-66. Adapted from Chevreau (2009). 7-5 Figure 7.2. Preparation of agglomerates from a UiO-66 powder sample. 7-5 Figure 7.3. Quaternary breakthrough curves of C6 isomers in UiO-66. 7-8 Figure 7.4. Effect of the temperature in the sorption selectivity in MOF UiO-66 at a)
0.6 kPa, and b) 6.3 kPa. 7-9
Figure 7.5. Van der Waals volume of C6 isomers. 7-10 Figure 7.6. Schematic representations: a) length entropy effect during adsorption of
nHEX, 3MP, 22DMB and 23DMB in the cylindrical channels of AFI (adapted from Smit and Krishna, 2003); b) MWW supercage (taken from
Huang et al. (2009)). 7-11
Figure 7.7. Cages of MIL-100(Cr) (Illustration taken from Llewellyn et al. (2008)). 7-13 Figure 7.8. MOF MIL-100(Cr) a) in powder form, and b) in agglomerate form. 7-14 Figure 7.9. Equimolar quaternary breakthrough curves of C6 isomers in
agglomerates of MIL-100(Cr), at T = 323 K and pisom= 10 kPa: a) with
Figure 7.10. Influence of the coordinated water on the adsorption capacity of
MIL-100(Cr) for an equimolar quaternary mixture. 7-17 Figure 7.11. Influence of the pressing/shaping procedure on the equimolar
quaternary breakthrough curves at T = 323 K and pisom = 4.0 kPa: a)
powder form; b) agglomerate form. 7-19
Figure 7.12. Reversible framework transformation from a) MOF-1 to b) MOF-2, and corresponding topologies c) and d), respectively (taken from Chen et al.
(2009)). 7-21
Figure 7.13. Perspective view of the channels in MOF-2. The structure was generated in CrystalMaker version 2.2.3, using the crystallographic information file
(cif) given in the literature (Chen et al., 2009). 7-21
Figure 7.14. MOF-2 powder packed with glass wool. 7-22
Figure 7.15. Pure component breakthrough curves for 22DMB, 3MP, and nHEX at T =
313 K and a) 6 kPa, and b) 28 kPa. 7-23
Figure 7.16. Pure component adsorption isotherms of 22DMB, 3MP, and nHEX at a)
313 K, and b) 343 K. Lines in nHEX isotherms are to aid the eyes. 7-24 Figure 7.17. Effect of the partial pressure on the single breakthrough curves of a)
3MP, and b) nHEX, at 313 K. 7-26
Figure 7.18. Effect of the partial pressure on the single breakthrough curves of nHEX
at 343 K. 7-27
Figure 7.19. Schematic illustration of the ‘‘breathing’’ effect in MOF-2. 7-28 Figure 7.20. Wavefront propagation through a fixed bed packed with MOF exhibiting
“breathing” effect. 7-29
Figure 7.21. Binary breakthrough curves for equimolar mixtures of 22DMB-3MP at T = 313 K: a) pisom= 0.7 kPa (run_ MOF2_1); b) pisom= 4.8 kPa (run_
MOF2_2); c) pisom= 24.0 kPa (run_ MOF2_3). 7-30
Figure 7.22. Binary breakthrough curves for equimolar mixtures of a) 22DMB-nHEX (run_ MOF2_4), and b) 3MP-nHEX (run_ MOF2_5) at T = 313 K, and
pisom= 4.8 kPa. 7-31
Figure 7.23. Ternary breakthrough curves for equimolar mixture of
22DMB-3MP-nHEX (run_ MOF2_6) at T = 313 K, and pisom= 24.3 kPa. 7-32
CONCLUSIONS AND SUGGESTIONS FOR FUTURE WORK
8-1
Figure 8.1. Novel concept for PSA processes with flexible MOFs: the rapid purge
List of Tables
INTRODUCTION
1-1
Table 1.1. Typical LSR naphtha composition and components properties (Cusher,
2004a). 1-3
Table 1.2. Zeolite structures with industrial application. 1-11
SINGLE ADSORPTION EQUILIBRIUM AND KINETICS OF C
6ISOMERS IN ZEOLITE BETA
2-1
Table 2.1. Physical properties of zeolite beta crystals, mercury porosimetry data
and N2 adsorption data of pellets. 2-14
Table 2.2. Experimental conditions for breakthrough curves and amount adsorbed. 2-21 Table 2.3. Adsorption enthalpy’s at zero coverage (-∆H0) and Henry constants (H)
on beta zeolite at 423 K, 473 K and 523 K for hexane isomers. 2-27 Table 2.4. Selectivities based on Henry’s constant between hexane isomers on
zeolite beta at 423 K, 473 K and 523 K 2-27
Table 2.5. Isotherm models parameters for hexane isomers on pellets of zeolite beta and average deviation between predicted values and experimental
data. 2-31
Table 2.6 Diffusivity and thermodynamic data reported in the literature for C6
isomers in silicalite and zeolite beta. 2-34
Table 2.7. Experimental conditions and model parameters for ZLC experiments. 2-36 Table 2.8. Diffusional time constants and activation energies obtained from ZLC
experimental data. 2-38
Table 2.9. Importance of the diffusion mechanisms, measured by, 2
2
/ ) 1 ( /
p p
c c
R D
K r
D +
=
Table 2.10. Experimental and predicted pore diffusivities of hexane isomers in
zeolite beta. 2-40
MULTICOMPONENT ADSORPTION OF C
6ISOMERS IN
ZEOLITE BETA
3-1
Table 3.1. TSL model parameters and deviations between model and experiments. 3-22 Table 3.2. Experimental conditions for multicomponent breakthrough curves, and
mean absolute deviation between the TSL predictions and the
experimental equilibrium data. 3-29
Table 3.3. Dynamic model parameters for the simulation of multicomponent
breakthrough curves. 3-32
ADSORPTION DYNAMICS OF C
5/C
6FRACTIONS IN A
LAYERED BED OF ZEOLITE BETA AND ZEOLITE 5A
4-1
Table 4.1. Operating parameters for fixed bed adsorption and properties of zeolite
beta and zeolite 5A. 4-16
Table 4.2. TSL model parameters for the adsorption equilibrium of C5/C6 isomers in pellets of zeolite beta. Overall saturation loading and enthalpy at zero
coverage are also represented. 4-18
Table 4.3. Experimental conditions of the six-component breakthrough curves and
amount adsorbed of each component in the mixture† 4-28 Table 4.4. Axial dispersion, macropore diffusion, mass and heat transfer
coefficients. 4-29
SEPARATION OF C
5/C
6LIGHT NAPHTHA BY LAYERED
PRESSURE SWING ADSORPTION
5-1
Table 5.1. Operating parameters common to all simulations for the layered PSA,
and properties of zeolite 5A (Silva, 1998), and zeolite beta (this work). 5-6 Table 5.2. Map of the parametric study for the optimization of the process. 5-10 Table 5.3. Mathematical model for the study of the layered bed PSA cycle. 5-15 Table 5.4. Boundary conditions associated with the 4-steps of the PSA cycle. 5-16 Table 5.5. Operating conditions and process performance of the PSA cycles
simulated. (Pressurization with feed, time of pressurization and
depressurization step = 20 s) 5-20
ZEOLITE BETA MEMBRANES FOR THE SEPARATION OF C
6ISOMERS
6-1
Table 6.1. N2 permeance of the zeolite beta membranes after second synthesis and after calcination. Transmembrane pressure difference of 200 kPa. Room temperature. Si/Al ratio calculated from the composition of the
synthesis mixture. 6-9
Table 6.2. Pervaporation experiments at room temperature with a 10 wt% TIPB
mixture in ethanol. 6-21
Table 6.3. Vapour separation experiments of an equimolar mixture nHEX/3MP/23DMB /22DMB in He as carrier gas 50 ml/min; He sweep
gas 50 ml/min; pmix = 1 kPa. 6-29
SEPARATION OF C
6ISOMERS IN METAL-ORGANIC
FRAMEWORKS
7-1
Table 7.1. Experimental conditions of the multicomponent breakthrough curves in
UiO-66. 7-6
Table 7.2. Experimental conditions for the equimolar quaternary breakthrough
curves, and partial loadings (T = 323 K; pisom= 10.0 kPa). 7-15 Table 7.3. Sorption selectivity obtained from the equimolar quaternary
breakthrough curves shown in Figure 7.9. 7-17
Table 7.4. Experimental conditions for the equimolar quaternary breakthrough curves shown in Figure 7.11, and partial loadings (T = 323 K; pisom= 4.0
kPa). 7-19
Table 7.5. Experimental conditions of the single breakthrough curves in MOF-2. 7-25 Table 7.6. Experimental conditions of the multicomponent breakthrough curves in
MOF-2, and amount adsorbed for each run. 7-32
APPENDICES
Table A.1. Experimental conditions for single component breakthrough curves and
List of Symbols
p
a specific particle surface per unit volume of bed (m2particle/m3bed) b adsorption affinity constant (kPa-1)
0
b frequency factor of the affinity constant (kPa -1)
i
c concentration of solute i in fluid (kmol/m3) 0
c saturation concentration of the ZLC cell (kmol/m3) out
c outlet concentration of the ZLC (kmol/m3) ps
C specific heat capacity of adsorbent (kJ/kg/K) pg
C specific gas phase heat capacity at constant pressure (kJ/kmol/K) pw
C specific heat capacity of column wall (kJ/kg/K)
V
C linear valve constant (kmol/kPa/s)
vg
C specific gas phase heat capacity at constant volume (kJ/kmol/K)
p
d pellet diameter (m)
k
d molecular kinetic diameter (m) B
d internal bed diameter (m) p
d particle diameter (m)
ax
D axial dispersion coefficient (m2/s)
o i
D/ internal/external diameter of tubular supports (m) K
D Knudsen diffusion coefficient (m2/s)
m
D molecular diffusion coefficient (m2/s)
p
D macropore diffusion coefficient (m2/s)
j i
E, interaction energy of component i, in site j (kJ/kmol) 0
i
F molar rate of adsorptive species at the column outlet (mol/s) 0
, i
F molar rate of adsorptive species in the feed (mol/s)
p
h gas-solid heat transfer coefficient (W/m2/K)
w
h gas-wall heat transfer coefficient (W/m2/K)
H Henry’s constant (kg/kgads/kPa)
ad
H dimensionless Henry’s constant
(
=ρpRTH/MW)
H
∆ heat of adsorption (kJ/kmol) 0
H
∆ heat of adsorption at zero coverage (kJ/kmol)
) ( 1
0
β
J Bessel functions of first kind and zero order (-) )
( 1 1 β
J Bessel functions of first kind and first order (-) f
k film mass transfer coefficient (s-1) gz
k effective axial gas phase thermal conductivity (W/m/K)
MTC
k effective mass transfer coefficient (s-1)
sz
k effective axial solid phase thermal conductivity (W/m/K)
w
k thermal conductivity of the column wall (W/m/K)
K capacity factor
(
=(1−εp)Had /εp)
K
K dimensionless Henry’s coefficient
(
=RTρb/εb(∂qi*/∂pi))
L ZLC operating parameter (-)A
L5 length of the zeolite 5A layer (m)
beta
L length of the zeolite beta layer (m) B
L total bed length (m)
ads
m mass of adsorbent (kg)
M number of experimental measurements for fitting procedure (-)
W
M molecular weight (kg/kmol)
n number of actives sites for multisite Langmuir model (-) N number of paraffins in the mixture (-)
w
p partial pressure (kPa)
HC
p total hydrocarbon pressure (kPa)
isom
p total isomers pressure (kPa)
P total system pressure (kPa) H
P high feed pressure (kPa) L
P low purge pressure (kPa)
Pr Prandl number (=µCpg/kgMW)
s
P saturated vapour pressure (kPa)
P
∆ transmembrane pressure difference (kPa)
q adsorbed concentration of sorbate in the adsorbent (kmol/kgads) *
i
q equilibrium amount adsorbed of solute i (kmol/kgads)
i
q average amount of solute i adsorbed (kmol/kgads) m
q saturation loading capacity of sorbate in the adsorbent (kmol/kgads)
mix
q total mixture loading (kmol/kgads)
st
q isosteric heat of sorption (kJ/kmol)
q
∆ mean absolute deviation between model and experimental loading (kmol/kgads)
c
r crystal radius (m)
pore
r pore radius (m)
p
R pellet radius (m)
R universal gas constant (kPa·m3/kmol/K) Re particle Reynolds number (=dpMWρgvg/µ) RON research octane number (-)
s heterogeneity parameter for Toth model (-) BET
S adsorbent BET surface area (m2/kg) Sc component Schmid number (
W g m M D ρ µ/ = )
Sh component Sherwood number (=kfdp/Dm) j
i
S/ sorption selectivity; separation factor (-)
st
t stoichiometric time (s) cycle
t total cycle time (s) dpress
t time of depressurization step (s) feed
t time of feed step (s) press
t time of pressurization step (s) purge
t time of purge step (s) g
T gas-phase temperature (K)
s
T solid-phase temperature (K)
w
T internal wall temperature (K)
∞
T oven temperature (K)
∞
U wall-oven heat transfer coefficient (W/m2/K) g
v gas phase superficial velocity (m/s) B
V effective volume of the bed (m3)
m
V molar volume (m3/mol) x molar fraction (-)
char
x characteristic length (m)
i
y mol fraction of component i in the gas phase (-)
0 ,
i
y mol fraction of component i in the hydrocarbon feed (-)
z axial coordinate (m)
Greek Symbols
w
α
ratio of the internal surface area to the volume of the column wall (m-1)w
'
α
ratio of the log mean surface area to the volume of the column wall (m-1)β radial dispersion factor for packed beds (-)
γ ratio of macropore and micropore diffusional time constants = +2
2 / ) 1 ( / p p c c R D K r D ax
p
Γ tortuosity factor (-)
w
δ
column wall thickness (m)b
ε
interparticle voidage (m3void/m3bed) pε intraparticle voidage (m3pore/m3particle)
t
ε
total bed voidage (m3void + pore/m3bed)θ fractional coverage of the adsorbent (-); contact angle in the Kelvin equation (°)
µ dynamic viscosity (kg/m/s)
Π permeance (mol/m2/s/Pa)
b
ρ
adsorbent bulk density (kg/m3) gρ gas phase molar density (kmol/m3) p
ρ apparent pellet density (kg/m3 pellet)
s
ρ
solid density of pellet (kg/m3 (pellet – pore))w
ρ
wall density (kg/m3)σ
surface tension in the Kelvin equation (N/m) difτ reciprocal time constant of diffusion (s-1)
Subscripts and Superscripts
ads adsorbent C5 pentane isomers C6 hexane isomers HC hydrocarbon
I sorption site located at the intersection between the channels S sorption site located at the straight channels
Z sorption site located at the zigzag channels
List of Abbreviations
BPD barrels per day (1 BPD ≈ 0.159 m3/day) BPSD barrels per stream day
CTD countercurrent depressurization DIH deisohexanizer column
DIP deisopentanizer column DPR depressurization mode DSL dual-site Langmuir
HRON high research octane number iPEN 2-metylbutane (also isopentane) LDF linear driving force
LRON low research octane number LSR light straight-run naphtha MOF metal-organic framework
nHEX n-hexane
nPEN n-pentane
PR pressurization mode PSA pressure swing adsorption TEAOH tetraethylammonium hydroxide TIP total isomerization process TIPB 1,3,5-triisopropylbenzene TSL tri-site Langmuir
Introduction
This chapter provides a general survey and critical evaluation of the technological processes and adsorbent materials currently used in the refining industry for the production of high-octane gasoline. The potential of novel alternative materials and technologies are also introduced. The objectives for the Ph.D. work are established.
1.1
Relevance and Motivation
In a world aware of the environmental concerns, it is time to research for solutions that can provide maximum energy efficiency, fulfilling at the same time the environmental standards imposed. The end of cheap oil will drive the refining industry to optimize even more the performances of their fuels, increasing the efficiency of the vehicle motors. Despite the move towards diesel in Western Europe, the global gasoline demand is forecast to slightly increase in the next decade (see Figure 1.1).
cracking, alkylation, isomer RON of gasoline to about 90 by the addition of high-oct (MTBE) which has been use octane enhancer. However, ethers, because of concern calls for restrictions on its us gasoline will require an extr gasoline feedstock to mainta
Figure 1.1. World tre percentage of tota
1.1.1
The Development
The light straight-run (LSR of the feedstock used for th LSR naphtha are listed in paraffinic, clear of sulphur constituents include C5 an
merization and other processes can be used t t 90. An extra boost of the RON quality is comm
octane oxygenates such as the methyl tertia used in the last twenty years in gasoline to rep
ver, controversy has surrounded its use and b ern over contamination of drinking water supp ts use (McCarthy and Tiemann, 2006). The switc extra effort to produce more high RON compo aintain or even further increase the quality of ga
d trends in the refining product demand. Numbers a total demand. Source: IFP (Benazzi and Cameron, 20
ent of Light Naphtha Isomerization Proc
(LSR) naphtha fraction produced by fractional di r the production of gasoline. The main constitu
Table 1.1. This gasoline blending pool is abo hur and aromatics, and has low benzene con
and C6 normal paraffins which have relati
ed to increase the ommonly obtained ertiary butyl ether replace lead as an d by extension all upplies, leading to witch to MTBE-free mpounds from the
f gasoline.
rs are the , 2005).
rocesses
compared to their branched isomers. Therefore, octane upgrading commonly uses isomerization to rearrange the structure of the linear paraffins into branched components. The first light naphtha isomerization process – the Hysomer process – using a zeolite-based catalyst for the conversion of linear alkanes, was started up by Shell in 1970 in La Spezia, Italy (Cusher, 1986b). Since then, other processes have been commercialized such as the CEPSA’s CKS ISOM process with the Sud-Chemie HYSOPAR catalyst (Schmidt and Köhler, 2002). The paraffin isomerization is performed in a hydrogen atmosphere at moderated pressures (12–20 bar) using a bi-functional catalyst, having a (de)hydrogenation function and an acid function. Nowadays the most commonly used catalysts are platinum loaded mordenite (Pt/H-MOR), platinum on chlorinated alumina (Pt/Al2O3-Cl) and more recently platinum-impregnated
sulphated zirconia (Pt/ZrO2-SO42-) (Weyda and Köhler, 2003).
Table 1.1. Typical LSR naphtha composition and components properties (Cusher, 2004a).
Component Molecular
weight, g/mol
Boiling point, ºC
LSR naphtha,
mol% RON
Isobutane 58.1 -11.7 0.1 100+
n-butane 58.1 -0.5 0.7 93.6
Isopentane 72.1 27.9 17.5 92.3
n-pentane 72.1 36.1 30.5 61.7
Cyclopentane 70.0 49.3 2.2 100.0
2,2-dimethylbutane 86.2 49.7 0.5 91.8
2,3-dimethylbutane 86.2 58.0 1.8 101.7
2-methylpentane 86.2 60.3 11.2 73.4
3-methylpentane 86.2 63.3 8.0 74.5
n-hexane 86.2 68.7 17.7 24.8
Methylcyclopentane 84.2 71.8 2.1 91.3
Cyclohexane 84.2 80.7 3.8 83.0
Benzene 78.1 80.1 2.4 100+
Heptanes 100.2 98.4 1.6 0.0
The hydroisomerization of linear C5/C6 paraffins are equilibrium-limited reactions
generally favoured by low temperatures, this trend is shown in Figure 1.2. The more active the catalyst, the lower the reaction temperature: 130-150ºC for Pt/Al2O3-Cl,
160-210ºC for Pt/ZrO2-SO42- and 250-280ºC for Pt/H-MOR (Weyda and Köhler, 2003).
pre-treatment since they are susceptible to be deactivated by the presence of sulphur and water.
Depending on the feedstock composition and operating conditions, a 10 to 12 RON increase for the light naphtha can be achieved with the Hysomer process resulting in a product RON of about 78–82 points. However, the equilibrium mixture from the hydroisomerization reactor still contains about 30 wt% of low RON molecules such as n-pentane (nPEN) and n-hexane (nHEX).
Figure 1.2. Equilibrium composition of pentane and hexane isomers as a function of the isomerization temperature. Solid line represents the liquid phase and dashed line gas
phase equilibrium (Vermeiren and Gilson, 2009).
The performances of the Hysomer process was substantially enhanced in 1975 with the integration of a UOP (Universal Oil Products) molecular sieve separation process – the IsoSiv process – in a refinery in Kawasaki, Japan (Cusher, 1986a). This unit was one of the earliest applications of a combined catalytic-adsorptive integrated process in the refining industry being marketed as the Total Isomerization Process (TIP). TIP uses zeolite 5A to separate and recycle the normal paraffins to the hydroisomerization reactor (Holcombe, 1980; Cusher 2004b). The conventional TIP is sketched in Figure 1.3 where the integration of reaction and separation units can be seen. The reactor effluent is cooled and flashed in a hydrogen separator drum. The liquid containing
Pt/H-MOR Pt/ZrO2-SO4
some unconverted linear paraffins is vaporized and passed to the IsoSiv unit. Typically the process has two or four adsorption columns packed with zeolite 5A. The continuous processing is accomplished through cyclic operation, using a system of valves actuated in a predetermined sequence. The basic process consists of two essential steps:
Adsorption – The isomerate light naphtha in the vapour phase is fed upward through a column where the n-paraffins are selectively adsorbed in the bed. The non-adsorbed molecules are obtained as a product at the column outlet. The adsorption step finish when the wavefront of the n-paraffins penetrates into about 75% of the bed;
Desorption – The bed saturated with normal paraffins is counter currently
purged with non-adsorbable gas. This counter current purge cleans the bed from normal paraffins and recycles them to the hydroisomerization reactor.
Figure 1.3. Simplified scheme of the conventional Total Isomerization Process (TIP): (I) isomerization reactor; (S) hydrogen separator; (C) compressor; (A) adsorption
Typically, the TIP operates in isobaric mode, i.e., IsoSiv unit operates at the same pressure than the Hysomer reactor, 13 to 34 bar range and in the temperature range of 518 K to 543 K (Holcombe, 1980). Therefore, the hydrogen separated from the reactor effluent must be recompressed before the desorption stage. Both the compression and vaporization stages are important operation cost in this process. Several variations of the basic TIP are commercially available (e.g., Ipsorb or Hexsorb, from Axens). Some of these schemes will be discussed further; however, the intermediate stages previously mentioned are common to all of them.
In terms of performance, the TIP can produce a final isomerate with 87–90 RON, i.e. an improvement of approximately 20 points comparatively to the LSR naphtha. Figure 1.4 shows the typical composition of linear and branched C5/C6 in the fresh feed,
reactor effluent and final isomerate in a TIP. From this Figure it is observed a clear reduction on the composition of the low RON (LRON) molecules nHEX and nPEN – being nHEX practically extinct – and an increase of the high RON (HRON) iPEN, 22DMB and 23DMB and the LRON 3MP. In sum, the LRON molecules represent about 18 wt% of the final product. It must be noted that despite the significant amount of the LRON 2-methylpentane in the LSR naphtha (see Table 1.1) this component was not included in this present study for reasons that will be discussed further.
As previously mentioned, during the last decades alternative schemes and improvements have been developed for the recycling of LRON paraffins (Jensen, 2002). Some includes the adsorption zone before the isomerization one (Volles, 1992), as shown in Figure 1.5a. This patented UOP post-separation isomerization scheme has four layered-beds packed with zeolite 5A and MFI. The second adsorbent is used to separate part of the LRON methylpentanes. Nevertheless, the main drawback of this scheme is the significant amount of HRON iPEN recycled to the reaction section, due to its strong adsorption in zeolite MFI. In addition, the high final product RON* (93) is essentially due to a low adsorbent productivity, 79 mmol/(min·kgads)†.
Figure 1.5. Variations of the conventional isomerization process: a) post-separation isomerization process with dual-layer PSA unit (Volles, 1992) and b) basic Ipsorb
process with deisopentanizer column, DIP (Minkkinen et al., 1993).
The Ipsorb and Hexsorb processes are two advanced recycle technologies for C5/C6
isomerization which are commercialized by Axens – a commercial branch of Institut Français du Pétrole (IFP). These processes combine molecular sieve adsorption technology and fractionation to separate and recycle LRON C5 and C6 paraffins