SACROILIITIS: IMAGING EVALUATION*
Cristiano Montandon1
, Marlos Augusto Bitencourt Costa2
, Tarcísio Nunes Carvalho2
, Marcelo Eustáquio Montandon Júnior1
, Kim-Ir-Sen Santos Teixeira3
Sacroiliitis is a non-infectious inflammatory process involving the sacroiliac joint, and is a diagnostic crite-rion for seronegative spondyloarthropathies. Imaging methods are of great value for confirming the diagno-sis of this condition. The present study is a review of cases included in didactic files and in the literature to illustrate the anatomy, techniques, and main imaging findings in x-ray, computed tomography and magnetic resonance imaging for determining the diagnosis of sacroiliitis, also approaching main differential diagnoses. Keywords: Sacroiliitis; Spondyloarthropathy; X-ray; Computed tomography; Magnetic resonance imaging.
Sacroiliíte: avaliação por imagem.
Sacroiliíte é o processo inflamatório não-infeccioso das articulações sacroilíacas, sendo critério diagnóstico das espondiloartropatias soronegativas. O diagnóstico desta enfermidade requer confirmação pelos méto-dos de imagem. O presente trabalho faz um revisão de casos do arquivo didático e de artigos da literatura para ilustrar a anatomia, a técnica e os principais achados de imagem na radiografia, tomografia computa-dorizada e ressonância magnética, na determinação do diagnóstico de sacroiliíte, abordando inclusive os seus principais diagnóstico diferenciais.
Unitermos: Sacroiliíte; Espondiloartropatia; Raio-X; Tomografia computadorizada; Ressonância magnética. Abstract
Resumo
* Study developed at Clínicas da Imagem e Multimagem, Goiânia, GO, Brazil.
1. MDs, Radiologists at Clínicas da Imagem e Multimagem, Titular Members of Colégio Brasileiro de Radiologia e Diagnóstico por Imagem.
2. MDs, Residents at Department of Imaging Diagnosis and Anatomical Pathology of Faculdade de Medicina da Universi-dade Federal de Goiás.
3. Adjunct Professor Doctor at Department of Imaging Diag-nosis and Anatomical Pathology of Faculdade de Medicina da Universidade Federal de Goiás, Titular Member of Colégio Brasi-leiro de Radiologia e Diagnóstico por Imagem, MD, Radiologist at Clínicas da Imagem e Multimagem.
Mailing Address: Dr. Cristiano Montandon. Avenida Ismerino S. Carvalho, 775, Setor Aeroporto. Goiânia, GO, 74075-040 – Brazil. E-mail: [email protected]
Received March 4, 2005. Accepted after revision May 2, 2005.
Most frequently, spondyloarthropathies occur in young patients, the early diagno-sis being critical for establishment of an appropriate therapy aiming at improving prognosis and working capacity of the pa-tients(3).
Most of times, the clinical diagnosis of sacroiliitis is difficult, depending substan-tially on the confirmation of radiological findings, where conventional x-ray, and currently, computerized tomography (CT) and magnetic resonance imaging (MRI) assume na essential role(4–6).
The objective of the present study was to review and demonstrate the main aspects in sacroiliac joints imaging evaluation, es-pecially on CT and MRI.
MATERIALS AND METHODS
Twenty-five cases with different imag-ing studies for sacroiliac joints evaluation have been retrospectively selected from the files of Clínicas da Imagem e Multimagem, Goiânia, GO, Brazil, aiming at didactically illustrating the anatomy, technique and findings of the main conditions affecting these joints. The studies were performed in equipment of different brands.
X-rays images were obtained in antero-posterior views with caudal and oblique inclinations. The current protocol for CT
studies consists of axial and coronal ob-lique images acquisition in 3.0 mm-thick slices, guided by digital radiography, with-out contrast agent injection (Figure 1).
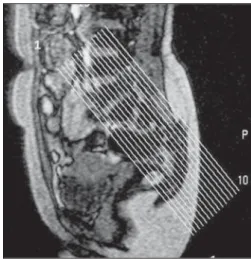
The protocol for MRI also consists of axial and coronal oblique views in 4.0 mm-thick slices, with narrow view field (20–24 cm) and 256 × 512 matrix, in T1, T2-weighted and STIR sequences. Later, T1-weighted sequences with fat saturation are performed, before and after gadolinium injection (Figure 2).
It was not a purpose of this study a sys-tematic analysis of each case separately.
INTRODUCTION
The sacroiliac joints are frequent sites of lumbar pain or lumbosciatalgia com-monly seen in the clinical daily practice, a non-infectious inflammatory process — sacroiliitis — being the most frequent cause of disease in this topography(1).
Seronegative spondyloarthropathies are basically subdivided and differentiated by their clinical features, and are classified into five different entities: ankylosing spondylitis, reactive arthritis, psoriatic ar-thritis, arthritis related with chronic inflam-matory disease and undifferentiated spon-dyloarthropathy. The inflammatory in-volvement of sacroiliac joints is a criterion for diagnosis of these diseases(1–3).
DISCUSSION
The sacroiliac joint presents a complex two-compartment anatomy. The synovial portion of the sacroiliac joint is vertically oriented, while the ligamentous portion presents horizontal-oblique orientation(4,5). Puhakka et al. have demonstrated that, his-tologically, the synovial portion is a sym-physis with some characteristics of a syn-ovial joint being confined to the distal car-tilaginous portion at the iliac side(7).
Several studies indicate that the vertical synovial tissue is better demonstrated by coronal, oblique views(1,4–6). Puhakka et al. have demonstrated that axial, oblique views provide a better visualization of the two-compartment anatomy of this joint, as well as of some anatomic variations, facilitating the interpretation of imaging findings(7).
The normal joint space of the sacroiliac joint measures 2.5–4.0 mm (mean = 3.0 mm)(4,5) (Figure 3).
Conventional x-ray still remains as the imaging method most utilized in the clini-cal practice. An international consensus still remains to be reached regarding the best technique and view for radiographic evaluation of the sacroiliac joint. Antero-posterior views with 25–30º caudal angu-lation of the x-ray tube, and oblique views are the most utilized in our practice, in an attempt to minimize structures overlapping, so facilitating the study interpretation(1,6). The main limitation of the x-ray film is the low sensitivity for detecting abnormali-ties in the early stages of the disease. Ra-diographic signs in sacroiliitis appear only
three to seven years after the initial symp-toms onset, presenting with alterations only in the chronic phase of the disease(1,2,8).
The main radiographic signs are: bone erosions, joint space alterations, subchon-dral sclerosis and ankylosis(6,8–11).
Assessing a patient with suspected sacroiliitis, we may classify the sacroiliac joint into five radiographic grades (modified New York criterion): 0 – normal; 1 – sus-pect, although unclear alterations; 2 – mini-mal erosions and sclerosis, but without joint space alteration; 3 – erosions and scle-rosis, with widening or narrowing of the joint space; 4 – ankylosis(1,6,9,10) (Figure 4). Scintigraphy presents high sensitivity for sacroiliitis, but specificity is low. This study must be interpreted in combination with other radiological study, and is of higher value in cases of unilateral alter-ations. The most significant indication would be for localizing another disease as a cause of lumbar pain(1,6,8).
Imaging methods like CT and MRI are extremely useful, especially in the absence of alterations, or when they are minimal on plain x-ray (grades 0 to 2)(1).
The evaluation of sacroiliitis by CT, in comparison with the conventional x-ray, has shown to be more sensitive, with a better and earlier detection of bone alter-ations, principally because of its capabil-ity to perform sequential slices, so avoid-ing structures overlappavoid-ing(6,7,9,10,12).
The CT shows higher sensitivity for detecting minimal bone erosions and joint space narrowing, however presents the same diagnostic capacity of plain x-rays in
Figure 2 Figure 3
cases of ankylosis(2). Lawson et al. have not found any abnormality on x-ray films that were not defined by CT(5).
The most frequent findings of sacro-iliitis on CT are: joint space narrowing, subchondral sclerosis, bone erosions and ankylosis. Joint space narrowing is charac-terized by a thickness of less than 2.0 mm in synovial tissues (Figure 5). Subchondral sclerosis is found in the presence of an asymmetrical or focal area with increased density (> 5.0 mm on the iliac side, and > 3.0 mm on the sacral side) (Figure 6). Bone erosions are small cortical defects on the synovial portion of the joint (Figure 7). These two latter findings can be seen in both sides of the joint, however, they are frequently seen at the iliac side because this side presents lower thickness and some cartilaginous clefts. The focal or complete fusion of the joint characterizes ankylosis observed in more advanced stages of the disease(4,5) (Figure 8).
Alterations in the ligamentous portion are rare, when compared with the synovial portions. CT is better than MRI for detect-ing bone formation in the enthesis of this topography(3).
CT is comparable to MRI for detecting bone erosion, but is superior for evaluating bone sclerosis and ankylosis, and is indi-cated especially for detecting chronic alter-ations(1).
CT is a method of excellence in demon-strating bone details, besides serving as a guidance tool in percutaneous biopsies, arthrocentesis, and for intra-articular injec-tion of steroids(6,11,12).
Figure 2. Survey on sagittal plane showing the schedule for MRI coro-nal oblique plane views.
Figure 5. Tomographic cuts – coronal oblique plane demonstrating joint space narrowing at right, and preserve at left. Also, subchondral sclerosis is observed at right, more evident in the iliac portion.
A B
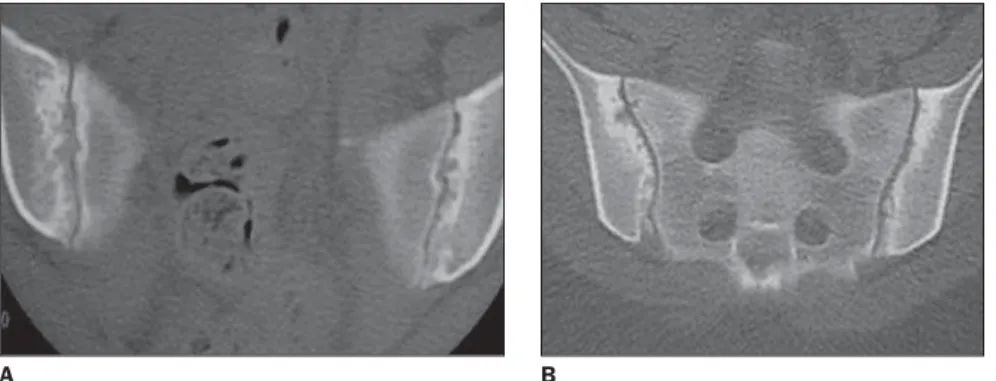
A B
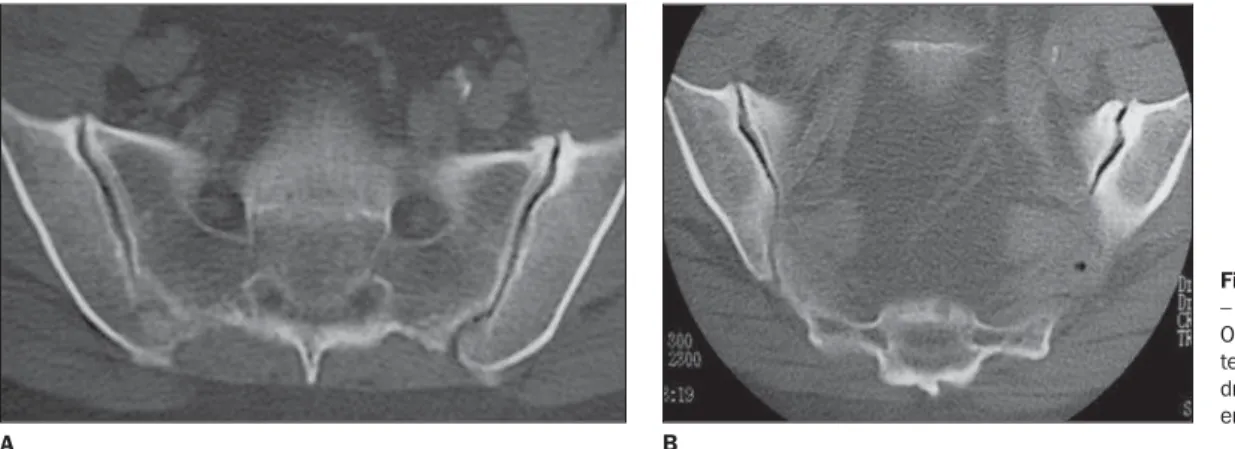
Figure 7. Tomographic cuts – axial view (A) and coronal view (B) showing marginal, bilateral erosions and subchondral sclerosis.
Figure 8. Tomographic cuts – coronal oblique plane demonstrating bilateral, partial fusion.
Figure 6. Tomographic cuts – coronal oblique plane demonstrating irregularity and sclerosis of articu-lar surfaces, predominating in the iliac bone. Figure 4. Radiographic
classifica-tion in the evaluaclassifica-tion of sacroiliac joints. Grade 0 – normal (A); grade I – suspicious; grade II – mild irregu-larity and sclerosis of articular sur-faces, with preserved joint space (B); grade III – joint space narrow-ing, besides intense irregularity and subchondral sclerosis (C); grade IV – bilateral ankylosis (D).
A B
On the other hand, sacroiliac evalua-tions by CT presents some inconveniences like radiation exposure, and incapacity to show alterations in the acute phase, iden-tifying especially the inflammation conse-quences rather than the inflammatory pro-cess activity(2,6,8–10).
Elgafy et al. have demonstrated lower sensitivity and specificity of CT in the evaluation of patients with suspected pain in the sacroiliac joint, since asymptomatic patients, especially the oldest ones, present some findings similar to those of sacro-iliitis, like marginal osteophytes and sub-chondral sclerosis(4) (Figure 9).
MRI has been suggested as a method of choice in the evaluation of sacroiliitis, be-cause of the higher quality of the images, absence of ionizing radiation, and mainly the capacity of detecting and differentiat-ing acute and chronic alterations(2,6,8–11).
Structures comprising the sacroiliac joint are better demonstrated by MRI, and
are seen as follows: 1) cartilage – a thin zone of intermediary signal on T1- and low signal on T2-wieghted sequences, with high signal on T1-weighted, fat-saturated sequences; 2) subchondral cortex – linear zone with signal void on T1- and T2-weighted sequences, is better seen on T1-weighted, fat saturated sequences; 3) sub-chondral medullary – homogeneous, inter-mediary signal on T1- and T2-weighted, and low signal on fat-saturated and STIR sequences; 4) absence of bone marrow uptake after intravenous contrast injection (gadolinium)(2,4,7) (Figure 10).
Main alterations seen on MRI of pa-tients with sacroiliitis are(2,6,8–11)(Table 1): a) Interarticular fluid collection – is bet-ter seen on T2, mainly on T2-weighted, fat-saturated and STIR sequences (Figure 11); b) replacement of articular cartilage by pannus (synovial proliferation), resulting in heterogeneous signal, with areas of fo-cal thickening with hypersignal on
T2-Table 1 Findings of sacroiliitis on MRI.
Acute phase – Intra-articular fluid
– Subchondral bone marrow edema – Articular and periarticular post-gadolinium
enhancement – Soft tissues edema Chronic phase
– Periarticular bone marrow reconversion – Replacement of articular cartilage by pannus – Bone erosion
– Subchondral sclerosis
– Joint space widening or narrowing – Ankylosis
A B
Figure 10. MRI coronal oblique views, T2- and T1-wieghted, fat-saturated sequences after contrast in-jection. Normal aspect – absence of paramagnetic contrast enhancement.
Figure 11. MRI coronal oblique views, STIR se-quence showing intense bilateral subchondral edema (hypersignal).
Figure 9. Tomographic cuts – coronal oblique plane de-monstrating anterior mar-ginal osteophytes, predomi-nating at right, besides sub-chondral sclerosis at left. Frequent findings in asymp-tomatic elders.
A B
weighted sequences and contrast uptake (Figure 12);
Figure 12. MRI coronal oblique views STIR (A) and T1-weighted fat-saturated sequences, before and after gadolinium injection (B,C) showing intense sub-chondral edema (hypersignal on STIR), as well as accentuated contrast enhancement. Also, joint space narrowing, contours irregularities and marginal ero-sions are observed.
A B C
d) subchondral sclerosis characterized by zones with low-intensity signal on T1-and T2-weighted images;
e) subchondral bone marrow edema characterized by low-intensity signal on T1- and high-intensity signal on T2-, espe-cially the T2-weighted fat-saturated and STIR sequences. On T1-weighted fat-satu-rated sequences, after intravenous gado-linium injection, a significant enhance-ment of sacroiliac joint and surrounding bone marrow can be observed, and this finding is highly suggestive of an active disease (Figure 12);
f) signs of focal or diffuse, periarticu-lar in chronic phases, bone marrow recon-version (fat collection) (Figure 13);
g) bone ankylosis represented by low-intensity signal through the sacroiliac joint, permeated by areas of intermediary sign representing bone marrow.
In 1990, Ahlström et al.(13) described two types of lesions identified by MRI.
Type I lesions were characterized by low-intensity on T1-weighted, and high-inten-sity signals on T2-weighted sequences and on images acquired after gadolinium injec-tion. Type II lesions were characterized by low-intensity signal in all of the sequences. This observation has suggested that MRI is able to differentiate lesions with high hy-dric contents (inflammatory edema) from those with fibrous tissue or sclerosis, i.e., differentiating acute from chronic alter-ations. Type II lesions are associated with fat collections(13).
The study developed by Hanly et al.(9) has proposed that subchondral bone mar-row edema is the earliest manifestation of the acute sacroiliitis, since 57% of their patients with subchondral bone edema did not present any sign of articular cartilagi-nous alteration. This theory is histopatho-logically corroborated by another study, by means of open biopsy in patients with ini-tial stage of disease, where the earliest
find-ing was subchondral inflammation. The sequence with highest sensitivity and specificity in detecting periarticular bone marrow edema is the STIR sequence, since, differently from the conventional T2-weighted spin-echo sequence, it saturates de fat, differentiating it from fluid(6,8,12).
The limitation of this finding — sub-chondral bone marrow edema — is that it also occurs in early phases of the degenera-tive process resulting from vascularization of fibrous tissue. For differentiating them, it is important to observe the site of the edema, i.e., hypersignal on the synovial portion of the sacroiliac joint indicates in-flammatory disease, and, on the ligamen-tous portion, indicates degenerative dis-ease(8).
The use of dynamic post-contrast se-quence in the evaluation of inflammatory processes has been reported in several stud-ies, but this has not been easily done in the daily practice(3).
Figure 13. MRI coronal oblique views T1-weighted (A) and T1-weighted fat-satu-rated sequences (B) demonstrating yel-low bone marrow collection (fat) in sub-chondral bone, more evident at left (hypersignal on T1), with signal loss in the fat-saturated sequence.
Puhakka et al. have demonstrated some anatomical variations, like synovial re-cesses, bony and cartilage clefts, situated in the transition between the two proximal one-thirds and the distal one-third of the dorsal aspect of the iliac side of the joint that may mimic bone erosion, contrast-en-hancement on the ligamentous portions as a result of the intense vascularization, and fat infiltration of the sacral bone marrow without pathological significance(7).
Oostveen et al. have demonstrated a 60% positive predictive value of MRI for sacroiliitis development after three years, with 85% sensitivity and 47% specific-ity(14). On the other hand, Battafarano et al. have demonstrated high MRI sensitivity and specificity (100%) for type I alter-ations, and, respectively 69% and 46%, in the evaluation of type II alterations.
The main disadvantages of MRI are: high cost, low availability, and long dura-tion of examinadura-tion (30 minutes), although the latter is well tolerated by the majority
of patients, in pediatric examinations in-cluded(1,2,6,11).
DIFFERENTIAL DIAGNOSES
The main differential radiographic diag-nosis of sacroiliitis is condensing iliac os-teitis, that usually presents bilaterally and symmetrically in female, asymptomatic patients, manifesting on images as sclero-sis of the ventro-caudal portions of the sac-roiliac joint(14) (Figure 14).
Other relevant differential radiographic diagnoses include metabolic diseases like hyperparathyroidism and gout. Usually, in cases of hyperparathyroidism the condition manifests bilaterally and symmetrically, either in its primary form or in its second-ary forma (renal osteodystrophy), charac-terized by subchondral bone reabsorption with irregularity on the bone surface, some-times with adjacent sclerosis and widening of the joint space. In cases of chronic tophaceous gout, the condition may
mani-fest symmetrically or asymmetrically, some-times unilateral, characterized by large, destructive erosion with a sclerotic halo, but with preserved join space(15).
In the evaluation of the sacroiliac joint, the patient ’s age should be taken into con-sideration, since osteoarthrosis is frequent in elder, asymptomatic patients. These al-terations are characterized by marginal osteophytes, subchondral sclerosis, and eventually articular fusion(1,3) (Figure 15). Erosion, subchondral cysts and ankylosis are rarely seen in the degenerative pro-cess(4). Early in the initial phase of the pro-cess, periarticular subchondral bone mar-row edema can be seen representing fi-brous, vascularized tissue(8). Fat deposition also may be seen in normal elder individu-als, and in patients with degenerative dis-ease(16) (Figure 16).
Other important differential diagnosis is infectious sacroiliitis, particularly the pyogenic type. Infectious sacroiliitis is quite rare, prevailing in injectable drugs users and in individuals with skin, pulmo-nary and genitouripulmo-nary infections, and have as its most frequent etiologic agent the Staphylococcus aureus. The diagnosis of infectious sacroiliitis is difficult, many times delayed because of its insidious clinical presentation with non-specific and poorly localized signs, frequently simulat-ing abdominal syndromes, lumbar disco-pathies or lumbosciatalgia. CT and MRI allow an earlier diagnosis, but are not able to define the etiologic agent. Generally, ra-diographic alterations can be observed only two or three weeks after the first symptoms onset, while on contrast-en-hanced MRI, alterations can be observed Figure 14. X-ray film showing sclerosis in the ventro-caudal portions of iliac bones in female,
asymptom-atic patient, characterizing condensing iliac osteitis. Note that joint spaces are normal.
Figure 15. Tomographic cuts – axial and coronal planes. Osteoarthrosis – anterior os-teophytes with mild subchon-dral sclerosis. Also, note bilat-eral vacuum phenomenon.
Figure 17. Tomographic cuts – Axial view, non-contrast enhanced on the bone window (A) and after contrast agent injection, on the soft tissue window (B,C). Infectious sacroiliitis – unilateral lesion characterized by accentuated irregularity and sclerosis of articular surfaces, besides periarticular abscess.
A B C
Figure 16. Elder patient with back pain. MRI coronal oblique views, T1 (A) and T1-weighted, fat-saturated sequences (B) showing diffuse bone marrow reconversion (hypersignal on T1), with signal loss in the fat-saturated sequence.
A B
within up to three days, showing MRI higher sensitivity(2,6,15).
CT findings in the infectious process are the same of those observed in the sacro-iliitis of spondyloarthropathies, except for the juxtarticular bone demineralization, considered as the earliest finding, besides signs suggestive of soft tissues involve-ment and unilaterality of the process(12). MRI, besides determining alterations in the affected sacroiliac joint and in the contigu-ous bone, also clearly demonstrates the involvement of adjacent soft tissues or collections, frequently posteriorly to the iliopsoas muscle, these findings being highly suggestive of infectious involve-ment, and not seen in spondyloarthro-pathies(6,12,13,15,16). The intravenous gado-linium injection can more accurately define these soft tissues involvement(12,13,16) (Fig-ures 17 and 18).
CONCLUSION
The conventional x-ray remains as the method of choice in the primary evaluation and follow-up of patients with sacroiliitis. The MRI plays an essential role in better
demonstrating early alterations and inflam-matory activity of this process. On the other hand, CT is superior in quantifying chronic alterations.
REFERENCES
1. Braun J, van der Heijde D. Imaging and scoring in ankylosing spondylitis. Best Pract Res Clin Rheumatol 2002;16:573–604.
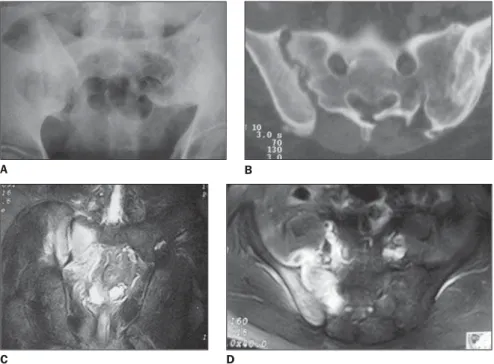
Figure 18. Plain x-ray (A), axial CT view (B), coronal MRI view, STIR (C) and axial MRI view, T1-weighted, fat-saturated sequence after contrast injection (D). Right infectious sacroiliitis – accentuated irregularity of articular surfaces, joint space widening, intense subchondral edema (hypersignal on STIR) and accen-tuated contrast-enhancement including adjacent soft tissues. Signs of traumatic at left.
B A
2. Oostveen JCM, van de Laar MAFJ. Magnetic resonance imaging in rheumatic disorders of the spine and sacroiliac joints. Semin Arthritis Rheum 2000;30:52–69.
3. Puhakka KB, Jurik AG, Egund N, et al. Imaging of sacroiliitis in early seronegative spondylar-thropathy. Assessment of abnormalities by MR in comparison with radiography and CT. Acta Radiol 2003;44:218–229.
4. Elgafy H, Semaan HB, Ebraheim NA, Coombs RJ. Computed tomography findings in patients with sacroiliac pain. Clin Orthop Relat Res 2001; 382:112–118.
5. Lawson TL, Foley WD, Carrera GF, Berland LL. The sacroiliac joints: anatomic, plain roentgeno-graphic, and computed tomographic analysis. J Comput Assist Tomogr 1982;6:307–314. 6. Braun J, Sieper J, Bollow M. Imaging of
sacroili-itis. Clin Rheumatol 2000;19:51–57. 7. Puhakka KB, Melsen F, Jurik AG, Boel LW,
Vesterby A, Egund N. MR imaging of the normal
sacroiliac joint with correlation to histology. Skel-etal Radiol 2004;33:15–28.
8. Battafarano DF, West SG, Rak KM, Fortenbery EJ, Chantelois AE. Comparison of bone scan, com-puted tomography, and magnetic resonance im-aging in the diagnosis of active sacroiliitis. Semin Arthritis Rheum 1993;23:161–176.
9. Hanly JG, Mitchell MJ, Barnes DC, MacMillan L. Early recognition of sacroiliitis by magnetic resonance imaging and single photon emission computed tomography. J Rheumatol 1994;21: 2088–2095.
10. Blum U, Buitrago-Tellez C, Mundinger A, et al. Magnetic resonance imaging (MRI) for detection of active sacroiliitis: a prospective study compar-ing conventional radiography, scintigraphy, and contrast enhanced MRI. J Rheumatol 1996;23: 2107–2115.
11. Bollow M, Biedermann T, Kannenberg J, et al. Use of dynamic magnetic resonance imaging to detect sacroiliitis in HLA-B27 positive and
nega-tive children with juvenile arthritides. J Rheu-matol 1998;25:556–564.
12. Bellussi A, Busi Rizzi E, Schininá V, De Santis A, Bibbolino C. STIR sequence in infectious sacroiliitis in three patients. Clin Imaging 2002; 26:212–215.
13. Ahlström H, Feltelius N, Nyman R, Hallgren R. Magnetic resonance imaging of sacroiliac joint inflammation. Arthritis Rheum 1990;33:1763– 1769.
14. Oostveen J, Prevo R, den Boer J, van de Laar M. Early detection of sacroiliitis on magnetic reso-nance imaging and subsequent development of sacroiliitis on plain radiography. J Rheumatol 1999;26:1953–1958.
15. Resnick D. Bone and joint imaging. 2nd ed. Phila-delphia: WB Saunders,1996.