INTRODUCTION
In the aerospace industry, the two routes of manufacturing technologies for structures have been constantly improved. One of them is the employment of polymer matrix composite materials in aircraft structures, which has been growing over the years (Mangalgiri, 1999). The other one is the use of conventional metallic materials with enhanced mechanical and physical properties (King et al., 2009). This later could be considered as a safer route due to the very large experience of metallic alloys engineering use.
The rising competition between composites and metals took the aluminum alloys producers to develop, jointly with aircraft manufacturers, lighter alloys, with high mechanical strength and high damage tolerance. The aluminum-copper-lithium alloy AA2198 is an example of these new generation
alloys. Typically, the AA2198 alloy composition is 3.2% Cu and 1.0% Li, falling in the Al solid solution above 500 °C. Aging at lower temperatures promotes the formation of intermetallics responsible by strengthening effect (Bordesoules, 2007).
In addition to these new alloys, materials-joint techniques have been improved aiming at the reduction of weight, costs, and lead-time. Although the riveting process is highly automated, which is largely used by aircraft manufacturers, this process reached its development potential limit, and no VLJQL¿FDQWDGYDQFHVLQSURGXFWLYLW\QRULQZHLJKWUHGXFWLRQ can be expected. Thus, many joint techniques that could SURPRWHVLJQL¿FDQWFKDQJHVWRWKHSURGXFWLRQSURFHVVZHUH FRQVLGHUHGIRFXVLQJRQWKHVSHFL¿FQHHGVRIWKHDHURVSDFH industry, adding low weight and mechanical properties suitable with structural demands during aircraft lifetime operation. Among the available welding processes, friction stir welding (FSW) and laser beam welding (LBW) have presented advances over the past years, becoming attractive for the aerospace industry worldwide.
Occurrence of Defects in Laser Beam Welded Al-Cu-Li Sheets
ZLWK7-RLQW&RQ¿JXUDWLRQ
$QGUp/XL]GH&DUYDOKR+LJDVKL10LOWRQ6pUJLR)HUQDQGHVGH/LPD1,2* 1Instituto Tecnológico de Aeronáutica – São José dos Campos/SP – Brazil
2Instituto de Estudos Avançados – São José dos Campos/SP – Brazil
Abstract: In the aerospace industry, laser beam welding has been considered as one of the most promising routes among the new manufacturing processes. Substitution of riveting by laser beam welding of aircraft structures has contributed to weight and cost savings. Concurrently, new aluminum alloys have been developed with the addition of lithium with better mechanical properties and lower density. The Al-3.5%Cu-1.1%Li alloy (AA2198) is one of these new generation alloys. However, laser beam welding of Al-alloys expectations might be greatly reduced by the occurrence of two main defects: SRURVLW\DQGKRWFUDFNLQJ3RURVLW\LVPDLQO\FDXVHGE\WKHHQWUDSPHQWRIOLWKLXPJDVHVIROORZHGE\UDSLGVROLGL¿FDWLRQ On the other hand, hot cracking happens due to the conjunction of tensile stresses, which are transmitted to the mushy ]RQHE\WKHFRKHUHQWVROLGXQGHUQHDWKDQGWRDQLQVXI¿FLHQWOLTXLGIHHGLQJWRFRPSHQVDWHIRUWKHYROXPHWULFFKDQJHV7KLV ZRUNLQWHQGHGWRFRQWULEXWHWRZDUGVWKHNQRZOHGJHRI$$ZHOGLQJPHWDOOXUJ\XWLOL]LQJDN:\WWHUELXPGRSHG¿EHU ODVHU7KH7MRLQWFRQ¿JXUDWLRQZHOGVZHUHSHUIRUPHGDXWRJHQRXVO\RUZLWKWKHDGGLWLRQRIDQ$$¿OOHUULEERQ$OO the weld beads presented high porosity level, but with a decreasing tendency when welding from both sides. The use of the ¿OOHUPDWHULDOFRXOGVROYHKRWFUDFNLQJSUREOHP7KHEHVWUHVXOWVDUHREVHUYHGXVLQJWZRUXQVERWKVLGHVZLWK¿OOHUDQGD VSHHGRIPPLQDQGSRZHURI:7KH7SXOOWHQVLOHVWUHQJWKREWDLQHGXQGHUWKHVHFRQGLWLRQVZDV03DZKLFK LVEHORZWKHWHQVLOHVWUHQJWKRIWKHXQZHOGHG$$VKHHWEXWKLJKHUWKDQWKH$$ZHOGHGLQVLPLODUFRQGLWLRQV
Keywords: Laser, Laser beam welding, Aluminum alloys, Aerospace.
Received: 11/07/12 Accepted: 04/09/12 DXWKRUIRUFRUUHVSRQGHQFHPVÀLPD#\DKRRFRPEU
LBW already found its place in industrial production, with a market in full expansion. Initially, the automotive industry developed LBW processes for sheets of different thicknesses prior to forming, which are called tailored-blanks welding, and then body-in-white laser welding. The portfolio of available ÀDWDQGVKDSHGSURGXFWVLQFOXGHVDOXPLQXPDQGPDJQHVLXP alloys, presenting productivity and welding quality gains (Pallett and Lark, 2001).
Afterwards, the aerospace structure manufacturers began to substitute some riveted panels by laser-welded ones. The utilization of laser as a welding process allows not only weight reductions, but also the development of optimized panels, decreasing the manufacturing lead-time. If compared to the typical riveting speeds (200 to 400 mm/min), the laser welding clearly shows itself more productive, reaching speeds exceeding 6 m/min. Even with more rigorous inspections and SURFHVVFRQWUROLWLVVWLOOSUR¿WDEOH)XUWKHUPRUHWKHVWUXFWXUH become less susceptible to corrosion, since holes in the skin are avoided and gaps in butt joints are eliminated (Rötzer, 2007).
In spite of these advantages, LBW like other fusion methods is subject to common metallurgical problems, such as hot cracking and porosities. The control of welding defects is of utmost importance to control the mechanical properties under the extreme conditions aerospace materials are subjected to. Two of the major problems in fusion welding of aluminum alloys are related to porosity and hot cracks. These problems will be further analyzed.
Porosities are intrinsically related to the weld, occurring due to a large number of factors: alloy composition, surface contaminants, improper gas shielding, keyhole collapse, and hydrogen release. In case of alloys with highly volatile elements, such as Li in the present case, boiling could also happen. Pores in Al-Li welds beads had been previously reported (ASM, 1993) as a result of hydrogen contamination leading to interdendritic microporosity.
+RWFUDFNLQJDOVRNQRZQDVVROLGL¿FDWLRQFUDFNLQJLVRQH RIWKHPDMRUGHIHFWVWKDWFDQRFFXUGXULQJVROLGL¿FDWLRQRI metallic alloys. This is the result of inadequate melt feeding initiating micropores and severe deformation leading to the opening and propagation of such defects. This type of LPSHUIHFWLRQDSSHDUVDWWKHHQGRIWKHVROLGL¿FDWLRQZKHQWKH solid fraction is high (Piwonka and Flemmings, 1966). A large VROLGL¿FDWLRQLQWHUYDOOHDGVWRDKLJKXQGHUSUHVVXUHDWWKH dendrite roots increasing the tendency to hot cracking. 7KHFUDFNLQJVXVFHSWLELOLW\FRHI¿FLHQWSURSRVHGE\&O\QH and Davies (1981) is formulated as the ratio between the vulnerable time period (tv), and the time available for
stress-relief process (tR), i.e. the time spent in the interdendritic IHHGLQJVWDJHGH¿QHGDVWKHLQWHUYDOEHWZHHQDQGVROLG fraction. Equation 1 presents the hot cracking susceptibility (HCS) followed by Clyne and Davies (1981).
HCS
t
t
t
t
t
t
R V
90 40 99 90
=
=
-(1)
Since the solid fraction is a function of temperature and DOOR\FRPSRVLWLRQWKHPRGL¿FDWLRQRIWKHOLTXLGFRPSRVLWLRQ is a suitable way to decrease the vulnerable time. This is usually accomplished when an eutectic forming compound is added to the weld. For example, it is well known that silicon reduces tv LQ DOXPLQXP DOOR\V EHFDXVH WKH VROLGL¿FDWLRQ LQWHUYDO LV reduced and the fraction of the eutectic phase is increased.
Drezet et al. (2008) also proposed that hot cracking could be diminished when two laser sources are used together. The main HIIHFWRIWKHVHKHDWVRXUFHVLVWRFUHDWHD¿QHHTXLD[HGUHJLRQDW the middle of the weld bead, so the liquid permeability increases and the thermal gradient decreases. It has been proved that a process using two laser sources improves the high temperature toughness of the AA6013 aluminum joints (Lima et al., 2001).
The use of two laser sources could be unpractical in some weld geometries, but using two weld runs could reduce the WKHUPDOJUDGLHQW,QWKHFDVHRI7MRLQWFRQ¿JXUDWLRQW\SLFDO of an aircraft panel, two runs could be envisaged: one at the joint between skin and stringer and another in the opposite face. For this, two challenges must be attained: the laser beam must be very accurately positioned at the interface between WKHSLHFHVDQGDWDFRUUHFWDQJOHDQGWKH¿OOHUPDWHULDOPXVWEH inserted in some way it is not obstructing the beam. Therefore, WKH¿UVWFKDOOHQJHLVJRLQJWREHDFFRPSOLVKHGE\WKHKLJK TXDOLW\¿EHUODVHUEHDP7KHVHFRQGRQHFRXOGEHRYHUFRPH E\XVLQJD¿OOHUULEERQLQVWHDGRID¿OOHUZLUHDQGE\LQVHUWLQJ this ribbon directly at the joint intersection.
This work intended at contributing to the study of ZHOGDELOLW\ RI WKH$$ DOOR\ XVLQJ D ¿EHU ODVHU 7KH experimental results of the weldability are missing in the OLWHUDWXUHDQGWKHXVHRIDQHZODVHUVRXUFH¿EHUODVHUFRXOG produce a new insight on the matter. The weld geometry is similar to that of a stringer-skin T-joint both autogenous and ¿OOHGZLWKDQ$O6LDOOR\ULEERQ
MATERIALS AND METHODS
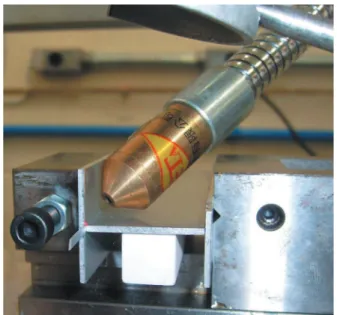
ZHOGVSHUIRUPHGZLWK¿OOHUWKHDOXPLQXPDOOR\$$ZDV utilized and its composition is shown in Table 2. Wires of 1.0 mm in diameter were cold rolled to ribbons of 1.6 mm of width and 0.2 mm thickness. The ribbons were placed between the sheets DQG¿UPO\DWWDFKHGXVLQJDEHQFKYLVHLQD7MRLQWFRQ¿JXUDWLRQ as depicted in Fig. 1. Based on previous studies, the angle EHWZHHQWKHODVHUEHDPDQGWKHVNLQVXUIDFHZDV¿[HGDW $ N:FRQWLQXRXV ZDYH ¿EHU ODVHU SURGXFHG E\ ,3* Co. (USA) was used. The laser radiation is generated in a PPGLDPHWHU¿EHUGRSHGZLWK\WWHUELXP7KHGRSHG¿EHU LVFRQQHFWHGWRDSURFHVV¿EHUZLWKPPGLDPHWHUZKLFK is then connected to an Optoskand processing head. The focal length was 157 mm with a minimum spot diameter at the focus of 100 mm.
3XUHKHOLXPJDVDWOPLQÀRZUDWHZDVXVHGWRSURWHFW the surface against oxidation. The protection gas was delivered through a rounded copper tube of 2 mm internal diameter directly over the irradiated area (Fig. 1). A computer numerical control (CNC) table carries out the sample movement. Right before welding, the sample surface was grounded with a
SiC 600 paper to remove oxidation and then washed with distilled water and ethanol.
Microstructural analyses were carried out using optical microscopy (OM) and scanning electron microscopy (SEM). 7KH20LVDUHÀHFWHGOLJKW5HLFKHUW3RO\YDU*HUPDQ\ equipped with acquisition system and image processing VRIWZDUH7KH6(0LVD=HLVV0RGHO/(29SL*HUPDQ\
The equipment for mechanical tests was an MTS 810 tensile machine (USA) having a loading cell with 250 kN capacity. The mechanical testing was carried out in T-pull mode, as described in Fig. 2. The load is realized by pulling the stringer at constant speed of 1.0 mm/min. The sample dimensions for T-pull testing were: 3(W)x3(H)x2(L) cm.
In order to understand the thermal and mechanical EHKDYLRUV GXULQJ ZHOGLQJ D ¿QLWH HOHPHQW DQDO\VLV ZDV SHUIRUPHGXVLQJWKH(6,*URXS6\VZHOGVRIWZDUH)UDQFH As the physical properties of AlCuLi alloy are missing in the literature, the simulation had been performed using the constants of an AlSiMg alloy class AA6061. One and two-sided welding conditions were simulated in autogenous condition. In order to reproduce experimental conditions, the simulated sheets were rigidly attached to the borders, and the time between the start of each weld, for the two sides welds, was ten seconds. The mechanical formalism is based on Von Mises strain and stresses (Wikipedia, 2012).
)LJXUH ([SHULPHQWDOVHWXSVKRZLQJDOXPLQXPSDUWV¿[HGDWWKH bench. The white block is an alumina calibrated support,
and the rounded nozzle is responsible for gas shielding.
stringer
skin
F
×
Figure 2. T-pull mechanical testing schematics. The skin part of the MRLQWLVDWWDFKHGWRDWDEOHZLWKWZRVFUHZV¿[HGFOLSV The force (F) is applied parallel to the stringer direction. Table 1. AA2198 alloy composition in weight percent (Al as the balance).
Element Cu Mg Li Ag Zr Mn Si Zi Ti Fe Other
% wt. 3.50 0.80 1.10 0.50 0.18 0.50 0.08 0.35 0.10 0.10 0.15
Table 2. AA4047 alloy composition in weight percent.
Element Al Cu Mg Mn Si Fe
After a number of free trials, some experimental conditions have been retained for a detailed study. Table 3 presents the experimental conditions for the welds, where the run could be one or two depending if one or both sides were exposed to the beam. The heat input is the ratio of power per speed for each run.
RESULTS AND DISCUSSION
In the present work, the parameters affecting the heat input provided by the laser, speed (v) and power (P) were studied. In general, the combination of P and v of the welds generated weld beads of reasonably similar dimensions. )RUWKH7MRLQWFRQ¿JXUDWLRQWKHODVHUEHDPFDPHIURPRQH (Fig. 3a) or two sides (Fig. 3b), however the welded zones were always asymmetric. All samples presented epitaxial growth of grains from the base/molten metal interface WRZDUGV WKH EHDG WRS 7KH VORZHU VROLGL¿FDWLRQ QH[W WR
the base material promoted the coarser dendrite formation with columnar structure. Near the bead top, where cooling rate was higher, the grains had not preferential orientation SURYLGLQJHTXLD[LDOJURZWKRI¿QHUGHQGULWHV
As can be seen in Fig. 3, a great quantity of pores is presented in all weld beads. Some of them presented large toes (Figs. 3a and 3b), which can be explained by the large number of pores within them. Microporosity as much as macro-porosity were present in the welded zone, indicating one or more mechanisms RISRUHIRUPDWLRQ3RUHVDUHYHUL¿HGDOODORQJWKHH[WHQVLRQRI the welds, however the volume fraction of pores does not have statistical meaning because of large variations in their density from one cross-section to the other.
These pores are mainly linked to the lithium degassing during melting and are frequently associated with poor weldability of Al-Li alloys. The welds with both side seams, as presented in Fig. 3b, showed smaller pores, indicating that the Li vapor had more time to leave the molten pool. Other possible sources of porosity to be considered are surface and gas contaminants. The current careful control RI VXUIDFH ¿QLVKLQJ GHFUHDVHV WKH SRVVLELOLW\ RI VXUIDFH contaminant, thus having a minor role in the porosity. Additionally, other types of aluminum alloys had been welded in the same experimental conditions (Siqueira et al., 2012), including use of the bench vise and the gas nozzle as presented in Fig. 1. Usually, these welds present only few small pores. Therefore, it is much likely that pores are due to Li degassing and, to an unknown extent, to hydrogen nucleation (ASM, 1993).
Figure 4 presents a closer look of a separate pore cross-section using secondary scanning electron microscopy. It
(a) (b)
Figure 3. Optical micrographic images of the weld seams. (a): one side beam, condition: one run – 1,400 W/3 m/min. (b): two runs – 1,200
W/4 m/min.
Table 3. Process parameters.
Power (W)
Speed (m/min.)
Heat input
(J/mm) Condition
1,200 2 36 Autogenous/two runs
1,200 2 36 Autogenous/one run
1,200 2 36 :LWK¿OOHUWZRUXQV
1,200 2 36 :LWK¿OOHURQHUXQ
1,400 3 28 Autogenous/one run
1,400 3 28 :LWK¿OOHURQHUXQ
1,400 3 28 :LWK¿OOHURQHUXQ
can be seen that the porosity is perfectly spherical with inner VXUIDFH ¿QHO\ GHFRUDWHG ZLWK GHQGULWH DUPV 7KH UHJLRQ DURXQGWKHREVHUYDEOHFLUFOHSUHVHQWV¿QHHTXLD[HGJUDLQV with epitaxial growth from the disc to the surroundings. This observation indicates that pores inoculate the liquid with ORZHQHUJ\QXFOHDWLRQVLWHVWKDWKHOS¿QHJUDLQJURZWK,Q Fig. 5a it could be seen a pore in the middle of an isolated grain (arrow). Page and Sear (2006) also showed that pores are preferred sites for heterogeneous nucleation of new phases. The same mechanism of metal nucleation around pores is also observed in metal foams. Duarte and Banhart YHUL¿HGWKHQXFOHDWLRQRIDOSKDJUDLQVDURXQGSRUHV in the foam-processed aluminum alloys classes AlSi7 and $$$VJUDLQUH¿QHUVWKHVPDOOSRUHVFRXOGLQFUHDVHWKH weld seams toughness, particularly in high temperatures in which hot cracks appears. However, the large pores observed here act as stress concentrators and probably hide the positive HIIHFWVRI¿QHSRUHLQRFXODWLRQ
7KHXVHRI$O6L¿OOHUVHHPVWRGHFUHDVHWKHWHDUWHQGHQF\ in the fusion zone. The welds performed with laser power of
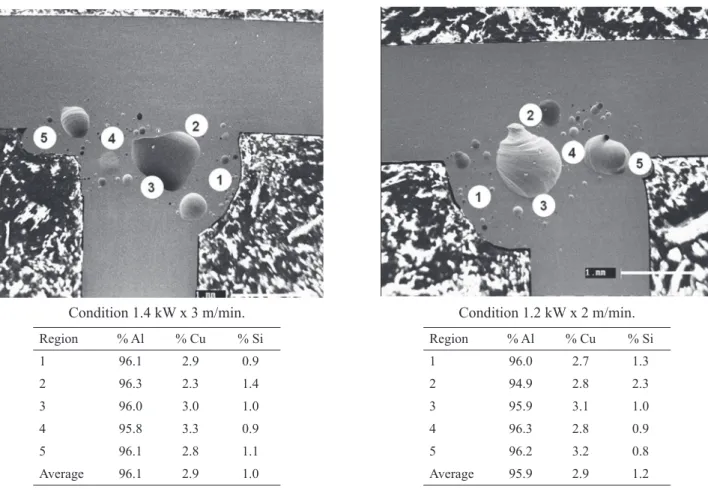
1,200 W and 2 m/min speed did not present hot cracking with ¿OOHUDGGLWLRQXQOLNHO\WKHDXWRJHQRXVFRQGLWLRQ)LJXUHVD DQGEVKRZWKHDXWRJHQRXVZHOGDQGZHOGZLWKWKH¿OOHU respectively. Thus, the HCS was reduced to this condition ZLWKWKHDGGLWLRQRIWKH$$¿OOHUULEERQ$FFRUGLQJWRWKH current theories (Campbell, 2003), the chemical composition is FKDQJHGUHGXFLQJWKHYXOQHUDEOHVROLGL¿FDWLRQLQWHUYDO,WLVQRW possible to accurately measure the actual composition of the welded zone using the energy-dispersive X-ray spectroscope of the scanning electron microscope (SEM-EDS), since many alloying elements were well-below 1 weight percent and the second most important alloying element (Li) was too light to be detected. Nevertheless, semiquantitative chemical analyses were performed, and are presented in Fig. 6 for two samples with Al-Si additions. It could be seen that silicon distribution is approximately homogeneous in all areas, but at the bottom region, next to the skin, called “2” in Fig. 6. The accumulation of Si in these regions could be explained due to the absence of KLJKOLTXLGFRQYHFWLRQÀX[HVLQODWHUDOUHJLRQVRIWKHZHOGSRRO
Through SEM-EDS imaging analyses, the composition of two side-welded beads was obtained. The content of silicon RIWKH¿OOHUZLUHZKLFKFRPSRVLWLRQLVDSSUR[LPDWHO\WKH eutectic Al-12% Si) was diluted in the bead during welding. 7KHPROWHQPHWDOFRQYHFWLRQÀRZVSHUPLWWHGWKHVROXWHVWR dilute out over the entire bead during welding.
$ SRVVLEOH ZD\ WR VWXG\ WKH LQÀXHQFH RI FKHPLFDO composition on hot cracking is to compare the ratio of vulnerable to stress-relief times, as presented in Eq. 1. With regards to the same cooling conditions, one could compare the temperature interval, related to tv and tR, between an alloy composed Al-2.9%Cu-1.1%Si (Fig. 6) and another with Al-3.5%Cu. Thermocalc (1994) computations provided the results presented in Table 4, and as can be seen the HCS drops )LJXUH 3RUHREVHUYHGDWFRQGLWLRQZLWK¿OOHU:PPLQ
one run.
(a) (b)
)LJXUH +RWFUDFNLQJLQWKHZHOGHG]RQHVDDXWRJHQRXVZHOGVHDPFRQGLWLRQRI:PPLQEZHOGVHDPZLWK¿OOHUIUHHRI
cracking, condition of 1,200 W/2 m/min.
IURPWRZKHQXVLQJ¿OOHUPDWHULDO7KHVHQXPEHUVDUH RQO\LQGLFDWLYHEHFDXVHWKHUHDOVROLGL¿FDWLRQLQWHUYDOGHSHQGV on the actual melt composition and cooling conditions. $V +&6 LV OLQNHG WR WKH UDWLR RI WKH VROLGL¿FDWLRQ intervals (Table 4) and the mechanical strains during the ¿QDOVWDJHVRIVROLGL¿FDWLRQWKHQRQHQHHGWRHYDOXDWHWKH thermomechanical evolution during welding by computer VLPXODWLRQ7KH¿QLWHHOHPHQWPRGHOLQJZDVFDUULHGRXWXVLQJ WKH6\VZHOGVRIWZDUHIRUWKH7MRLQWZHOGLQJLQVLPLODU
conditions to the experimental setup. One-side welding temperature and mechanical response were simulated with power of 1,400 W and a speed of 3 m/min. For the simulation of two-side weld, the chosen parameters were power of 1,200 W and speed of 4 m/min. The current thermal inputs were 28 and 18 J/mm per run (Table 3), for one and two-side welds, respectively. These simulation parameters were similar to those experimentally observed in Fig. 3. Figure 7 presents data plots as a function of processing time. For the two-side welds, the second curve begins at ten seconds because the second run started at this time.
$VVHHQLQ)LJDWHPSHUDWXUHYHUVXVWLPHSUR¿OHZDV quite similar at the beginning of the welding process. The second run, for the two-side weld, produces a second peak, which after ten seconds attains about 580 °C, approximately the solidusWHPSHUDWXUHVIRUWKH$O&X/LDQGWKH$O6L¿OOHUV
Indeed, the second run promotes a melt depth up to the oppo-site surface as shown in Fig. 3b. Since two melting periods are expected, the liquid had additional time for Li degassing in comparison to the one side run. Therefore, less porosity was obtained with two runs.
Condition 1.4 kW x 3 m/min. Condition 1.2 kW x 2 m/min.
Region % Al % Cu % Si
1 96.1 2.9 0.9
2 96.3 2.3 1.4
3 96.0 3.0 1.0
4 95.8 3.3 0.9
5 96.1 2.8 1.1
Average 96.1 2.9 1.0
Region % Al % Cu % Si
1 96.0 2.7 1.3
2 94.9 2.8 2.3
3 95.9 3.1 1.0
4 96.3 2.8 0.9
5 96.2 3.2 0.8
Average 95.9 2.9 1.2
)LJXUH (QHUJ\GLVSHUVLYH;UD\VSHFWURPHWU\FKHPLFDODQDO\VHVRIWZRZHOGEHDGV¿OOHGZLWKWKH$O6LULEERQ7KHWDEOHVEHORZHDFK
picture indicate the chemical composition for each region.
Table 4. Calculation of temperature intervals in different
compositions. T(fs) means temperature in Kelvin at a
given solid fraction. HCS: hot cracking susceptibility.
Temperature (K)
:HOGLQJZLWK$O6L¿OOHU
Al-2.9%Cu-1.1%Si
Welding without
$O6L¿OOHU$O&X
T (fs=99%) 837.04 857.04
T (fs=90%) 869.93 887.01
T (fs=40%) 912.57 919.51
HCS
(Equation 1) 0.77 0.92
The displacement (Fig. 7b) represents the shift in posi-tion during welding of a point at the centerline exactly at the interface between the sheets. The measurement position is
UHSUHVHQWHGE\³[´LQ)LJ$VWKHVKHHWVZHUH¿UPO\DWWDFKHG
to the bench (Fig. 1), these movements were highly constrained leading to residual stresses. The rigid clamping had therefore
LQÀXHQFHVRQWKHVWUDLQVDQGVWUHVVHVDVVKRZQLQ)LJVFDQG
7d. The calculated strain during welding attained 5 x 10⁻⁵ for the
¿UVWUXQDQGDERXW[-5 for the second. The most important
feature for cracking is the strain rate. A very high strain rate creates porosities at the root of dendrites, thus developing hot cracking (Rappaz et al., 1999). The value attained at the second run was 0.02 s-1. This value is very low and considered safe, at
least for the AA6061 aluminum alloy (Drezet et al., 2008). The effect of different weld procedures on the mechanical stresses is presented in Fig. 7d. The low heat input of the two-side method compared to the one-two-side allowed a lower level of residual stress up to ten seconds. The residual stresses at ten seconds were 0.09 and 0.07 MPa, respectively. After the second run, the difference was even larger, 0.09 and 0.04 MPa.
These stress levels are very low compared to the elastic proper-ties of aluminum alloys and thus the distortion should be very small. Indeed, the T-sets did not show distortions after welding.
All these simulation results had been developed using an
$$DOOR\GDWDEDVHDQGWKH¿OOHUDGGLWLRQVKDGQRWEHHQ
considered. Therefore, the results must be considered only in a qualitative way. Notwithstanding these results, it could be estimated that the T-joint with better chances to be used in
DSSOLFDWLRQVLVWKDWZLWK¿OOHUDQGWZRUXQV1RZRQHQHHG
to understand if the observed massive porosity produces an unsuitable weld from the mechanical point of view.
The mechanical characterizations of the welds were presented in Figs. 8 and 9. For clarity reasons, the stress is presented in logarithm scale. Figure 8 presents a direct
strain-VWUHVV FXUYH FRPSDULVRQ EHWZHHQ DQ DXWRJHQRXV DQG ¿OOHU
T-joint, when welded from one side to the other. As can be seen, the curves were very similar with a plateau up to 3.2 mm
HORQJDWLRQFRUUHVSRQGLQJWRWKHÀH[LRQRIWKHVNLQVKHHWDW
low stresses. It is easy to see in Fig. 2 that the skin sheet will bend creating a three-point load scheme at the beginning of 0 100 200 300 400 500 600 700 800 900 1000
0 5 10 15 20
time (s) te m p e ra tu re ( °C ) one side two sides one side two sides 0 0.01 0.02 0.03 0.04 0.05 0.06 0.07
0 5 10 15 20
time (s) di sp la ce m e nt s (1 0
-3 cm
)
(a) (b)
0 0.01 0.02 0.03 0.04 0.05 0.06 0.07 0.08 0.09
0 5 10 15 20
time (s) St ra in ( 1 0 -3) one side two sides 0 0.02 0.04 0.06 0.08 0.1 0.12 0.14 0.16
0 5 10 15 20
time (s) st re ss (M P a ) one side two sides
(c) (d)
the mechanical testing. The tensile stress and maximum elon-gation seems to be approximately the same, regardless the use
RI¿OOHUIRURQHUXQMRLQWV
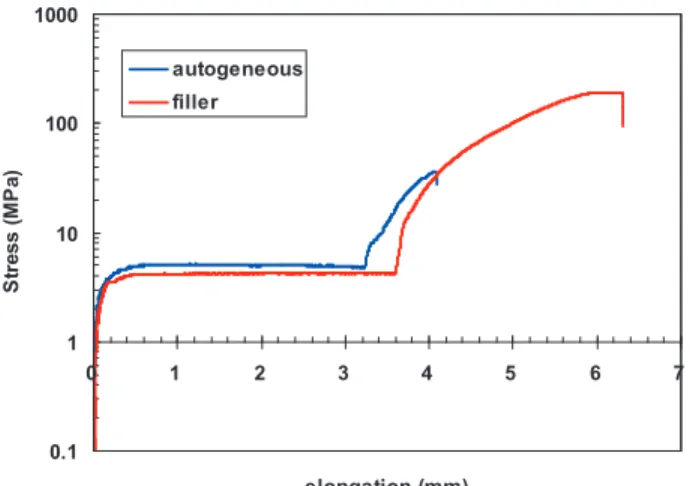
The mechanical behavior was completely different when welding from both sides (Fig. 9). Compared to the two-side
DXWRJHQRXVZHOGWKHXVHRI¿OOHUWRJHWKHUZLWKWKHGRXEOHVLGH
welding increased the tensile strength from 19 to 178 MPa, and the total elongation from 4.1 to 6.3 mm. The increased toughness, more than ten times, had been linked to the chemi-cal changing of the liquid bath, since the thermomechanichemi-cal behavior (Fig. 7) was about the same.
0.1 1 10 100 1000
0 1 2 3 4 5 6 7
elongation (mm)
St
re
s
s
(
M
Pa
)
autogeneous
filler
Figure 9. Comparison of the mechanical behavior between an
DXWRJHQHRXVDQG¿OOHUDGGHGZHOGHG&RQGLWLRQVERWK
sides welded (two runs), P=1,200 W, v=2 m/min.
It is worthwhile to compare the best result obtained in the present work with the two cases. Firstly, the AA2198 sheet without welding as the maximum attainable value. Secondly,
another aerospace alloy, AA6013, welded in similar T-joint conditions, welded one-side and autogenously. These results are presented in Fig. 10.
700
600
500
400
300
200
100
0
0 2 (b)
(c) (a)
4 6
elongation (mm)
Stress
(MPa)
8 10 12
Figure 10. Comparison of the tensile mechanical behavior. Conditions: (a) unwelded AA2198 sheet (maximum attainable condition); (b) Welded on both sides (two runs), P=1,200 W, v=2 m/min; (c) AA6013 aluminum alloy autogenously welded on one side.
The AA2198 welded coupons presented lower tensile strength and total elongation in comparison to the AA2198 unwelded coupon. This is due to the stress concentrator factor caused by the weld bead.
Comparing the best results obtained in T-joint welds for AA2198 and AA6013, it could be seen that the tensile strength was much higher in the first case. The AA2198 welded coupon attained 178 MPa, compared to only 46 MPa of the AA6013 case. On the other hand, the total elongations were 9.2 from AA6013 and 2.8 mm for AA2198, indicating a hardening effect of the filler material in the present case.
CONCLUSIONS
Even with a careful control of surface preparation, all the AA2198 T-joint welds presented pores, which were linked to the degassing of Li during melting.
$GGLQJ D ¿OOHU ULEERQ RI$$ DOOR\ EHWZHHQ WKH
parts to be joined could solve the hot cracking problem. The decrease of the vulnerable to stress relief time during
VROLGL¿FDWLRQZDVSRLQWHGRXWDVWKHUHDVRQIURPWKHORZHU
susceptibility for hot cracking.
The results from thermomechanical and chemical analyses, and tensile T-pull strength testing indicated that welded by
0.1 1 10 100 1000
0 1 2 3 4 5 6 7
elongation (mm)
St
re
s
s
(
M
Pa
)
autogeneous filler
WZRUXQVRQERWKVLGHVDQGE\XVLQJWKH¿OOHUULEERQSURGXFH
tougher joints.
The welds at 2 m/min and 1,200 W under these conditions were showing most promising properties, even in comparison to T-joined autogeneous AA6013 alloy.
Because of high pore density, it is safer to consider less critical applications than the aerospace one. Depending on other results, such as fatigue behavior, the AA2198 welded parts could be used, for example, in land transportation systems.
ACKNOWLEDGMENTS
The authors thank EMBRAER for providing the aluminum sheets, Financiadora de Fundos e Projetos (FINEP) and
)XQGDomR GH$PSDUR j 3HVTXLVD GR (VWDGR GH 6mR 3DXOR
(FAPESP) for partial funding.
5()(5(1&(6
ASM – American Society of Materials, 1993, “Metals Handbook – Volume 6: Welding, Brazing, and Soldering”, 10nd ed., Metals Park (Ohio), ASM International, pp. 1392-1393.
Bordesoules, I. et al., 2007, “Trends in developments of Aluminium solutions for aerospace applications”, In: Proceedings of the European Workshop on Short Distance Welding Concepts for Airframes frames – WEL-AIR, Hamburg, 13-15 june 2007, CD-Rom.
Campbell, J., 2003, “Castings”, 2nd ed., Oxford: Elsevier Pergamon, 332p.
&O\QH 7: DQG 'DYLHV *- ³$ 4XDQWLWLYH 6ROLGL¿FDWLRQ7HVWIRU&DVWLQJDQG$Q(YDOXDWLRQRI&UDFNLQJ
in Aluminium-Magnesium Alloys”, The British Foundryman, Vol. 68, pp. 238-254.
Drezet, J.M. et al., 2008, “Crack-free aluminium alloy welds using a twin laser process, In: 61st International Conference
RIWKH,QWHUQDWLRQDO,QVWLWXWHRI:HOGLQJ´*UD]6DIHW\DQG
reliability of welded components in energy and processing
LQGXVWU\*UD]$XVWULD78*UD]SS
Duarte, I. and Banhart, J., 2000, “A study of aluminium foam formation-kinetics and microstructure”, Acta Materialia, Vol. 48, pp. 2349-2362.
King, D. et al., 2009, “Advanced aerospace materials: past, present and future, Aviation and The Environment”, Vol. 3, pp. 22-27.
Lima, M.S.F. et al., 2000, “Advanced laser welding process”, European patent no. 01810986.8.
Mangalgiri, P.D., 1999, “Composite materials for aerospace applications”, Bulletin of Materials Science, Vol. 22, pp. 657-664.
Page, A.J. and Sear, R.P., 2006, “Heterogeneous Nucleation in and out of Pores”, Physical Review Letters, Vol. 97, pp. 065701-1-065701-4.
Pallett, R.J. and Lark, R.J., 2001, “The use of tailored blanks in the manufacture of constuction components”, Journal of Materials Processing Technology, Vol. 117, pp. 249-254.
Piwonka, T.S. and Flemings M.C., 1966, “Pore formation
GXULQJVROLGL¿FDWLRQ´7UDQVDFWLRQVRI0HWDOOXUJLFDO6RFLHW\
AIME, Vol. 236, pp. 1157-1165.
Rappaz, M. et al., 1999, “A new hot tearing criterion”, Metallurgical and Materials Transactions, Vol. 30A, pp. 449-455.
Rötzer I., 2005, “Laser-beam welding maker aircraft lighter”, Fraunhofer Magazine, Vol. 1, pp. 36-37.
Siqueira, R.H.M. et al., 2012, “Microstructural and Mechanical Characterization of Laser Welded and Heat-Treated AA6013 Aluminum Alloy”, In: Proceedings of XI Brazilian MRS Meeting, CD-Rom.
ThermoCalc thermodynamic database, 1994, version J, Stockholm Royal Institute, Sweden.