ACPD
10, 14947–14968, 2010Detection of volcanic plumes
H. Flentje et al.
Title Page
Abstract Introduction
Conclusions References
Tables Figures
◭ ◮
◭ ◮
Back Close
Full Screen / Esc
Printer-friendly Version Interactive Discussion
Discussion
P
a
per
|
Dis
cussion
P
a
per
|
Discussion
P
a
per
|
Discussio
n
P
a
per
|
Atmos. Chem. Phys. Discuss., 10, 14947–14968, 2010 www.atmos-chem-phys-discuss.net/10/14947/2010/ doi:10.5194/acpd-10-14947-2010
© Author(s) 2010. CC Attribution 3.0 License.
Atmospheric Chemistry and Physics Discussions
This discussion paper is/has been under review for the journal Atmospheric Chemistry and Physics (ACP). Please refer to the corresponding final paper in ACP if available.
The Eyjafjallaj ¨okull eruption in April 2010
– detection of volcanic plume using
in-situ measurements, ozone sondes and
a new generation ceilometer network
H. Flentje, H. Claude, T. Elste, S. Gilge, U. K ¨ohler, C. Plass-D ¨ulmer, W. Steinbrecht, W. Thomas, A. Werner, and W. Fricke
Deutscher Wetterdienst, Meteorologisches Observatorium Hohenpeissenberg, 82383 Hohenpeissenberg, Albin-Schwaiger-Weg 10, Germany
Received: 21 May 2010 – Accepted: 9 June 2010 – Published: 18 June 2010 Correspondence to: W. Thomas ([email protected])
ACPD
10, 14947–14968, 2010Detection of volcanic plumes
H. Flentje et al.
Title Page
Abstract Introduction
Conclusions References
Tables Figures
◭ ◮
◭ ◮
Back Close
Full Screen / Esc
Printer-friendly Version Interactive Discussion
Discussion
P
a
per
|
Dis
cussion
P
a
per
|
Discussion
P
a
per
|
Discussio
n
P
a
per
Abstract
Volcanic emissions from the Eyjafjallaj ¨okull volcano on the Southern fringe of Iceland were detected at different places in Germany by means of in-situ measurements, ozone sondes and a dense network of ceilometers of the German Meteorological Service (DWD). In-situ measurements of sulphur dioxide and particulate matter were performed
5
at the Global Atmosphere Watch (GAW) station Zugspitze/Hohenpeissenberg. At Ho-henpeissenberg, a number of reactive gases, e.g. sulphuric acid, carbon monoxide and nitrogen oxides were additionally measured during the period of interest. Also ozone sondes were launched at Hohenpeissenberg in the pre-alpine area. A newly established network of ceilometers (Jenoptik CHM15K) at currently 36 meteorological
10
stations in Germany provided the temporal evolution of emissions over Germany. The sensitivity of these instruments with respect to atmospheric aerosols further allowed the inversion of gathered backscatter profiles, and aerosol extinction coefficients and particle mass concentration were finally obtained.
1 Introduction
15
After months of enhanced seismic activity and crustal deformation close to the vol-cano summit, the Eyjafjallaj ¨okull volvol-cano located in the south of Iceland (63◦38′0′′N, 19◦36′0′′W, summit 1660 m) erupted on 20 March 2010; it was the first major out-break after a relatively silent period of nearly 190 years. Fire fountains, lava jets and eruptions where visually observed but volcanic emissions remained in the lower
atmo-20
sphere. A major outbreak of the central crater under the covering ice cap followed on 14 April 2010 (IES, 2010). The eruption was enforced when water from the melting ice cap of the summit and surrounding glaciers met the lava. A large volcanic ash plume rising up to the tropopause level (∼10 km) was observed by satellite instruments.
A high pressure system over Iceland on 16 April and later Western Scandinavia
fa-25
ACPD
10, 14947–14968, 2010Detection of volcanic plumes
H. Flentje et al.
Title Page
Abstract Introduction
Conclusions References
Tables Figures
◭ ◮
◭ ◮
Back Close
Full Screen / Esc
Printer-friendly Version Interactive Discussion
Discussion
P
a
per
|
Dis
cussion
P
a
per
|
Discussion
P
a
per
|
Discussio
n
P
a
per
|
typically volcanic ash, water vapour, and sulphur dioxide (SO2), across the North At-lantic towards the British Islands, Scandinavia and later on to Central Europe. Such plumes may heavily affect aircrafts (Miller and Casadevall, 2000) and the detection and tracking of plumes by satellites for aviation hazard mitigation supports the work of Vol-canic Ash Advisory Centers (VAAC) (Carn et al., 2008; Prata, 2008). The London VAAC
5
being responsible for the Northern European sector including Iceland issued warnings about the ash plume and consequently the majority of European airports were closed from 15 April to 21 April 2010. Since then the Eyjafjallaj ¨okull showed variable activ-ity and series of eruptions caused further volcanic emissions that reached the British Islands, the Iberian peninsula, the Azores, and Italy interrupting air traffic again, e.g.
10
from 5 May to 8 May 2010, 10 May to 12 May 2010.
The first eruptive period of the Eyjafjallaj ¨okull between 14 April and 19 April caused volcanic ash plumes reaching Northern Germany between 2 and 7 km altitude during the night from 15 April to 16 April; it subsided and spread southward on 16 and 17 April. By noon of 17 April it was entrained into the planetary boundary layer. The air mass was
15
further deflected towards west and east at the Alps and resided over Central Europe for several days thereafter.
We describe in this study the temporal evolution of this event, using collocated in-situ measurements of trace gases and aerosol particles, ozone sondes and a newly established network of ceilometers, typically used for cloud base height detection, that
20
was used here for aerosol profiling.
2 Measurements of volcanic emissions
2.1 The DWD ceilometer network
The spatial and temporal evolution of volcanic emissions over Germany was observed by the German ceilometer network operated by the German Weather Service (DWD)
25
ACPD
10, 14947–14968, 2010Detection of volcanic plumes
H. Flentje et al.
Title Page
Abstract Introduction
Conclusions References
Tables Figures
◭ ◮
◭ ◮
Back Close
Full Screen / Esc
Printer-friendly Version Interactive Discussion
Discussion
P
a
per
|
Dis
cussion
P
a
per
|
Discussion
P
a
per
|
Discussio
n
P
a
per
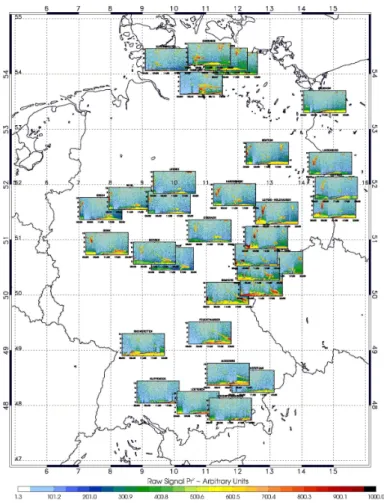
height monitoring, the new generation of instruments (CHM15K, Jenoptik) allows the detection of aerosol layers with extinction coefficients down to about 5×10⁻⁶m−1. The current (spring 2010) geographical position of now 36 ceilometers in Germany is indi-cated in Fig. 1 by so-called curtain plots.
The CHM15K uses a diode-pumped Nd-YAG solid state laser at 1064 nm yielding
5
about 8 µJ/pulse at a 5–7 kHz repetition rate. The pulsed laser beam (divergence 100 µrad or about 20 s of arc) is emitted off-axis of a Newton-type receiving telescope with an aperture of again 100 µrad. Back-scattered radiation is collimated, then filtered with a narrow-band interference filter before it is detected with an avalanche photodi-ode run in photon counting mphotodi-ode. Limited by the overlap between the laser beam and
10
the telescope field of view, the signal can be used from about 600 m above ground level up to 15 km with a vertical resolution of 15 m.
The CHM15K ceilometers provide profiles of particle and molecular back-scattering in an atmospheric column by solving the lidar equation for the backscatter coefficient profile (e.g., Klett, 1981). It requires independent information on the
backscatter-to-15
extinction ratio (lidar ratio, LR profile) and on the backscatter coefficient at a reference height. As mostly no height resolved particle information is available, the LR is usually taken from corresponding closure studies (e.g., Mattis et al., 2004) and regarded as height independent. The wavelength of 1064 nm provides relatively large contrast to molecular scattering, thus highlighting aerosol structures, but the scattering efficiency
20
drops sharply for particles with radii well below 1 µm, which limits the accuracy of a sin-gle profile.
2.2 In-situ measurements
In-situ measurements of volcanic emissions are typically confined to particle measure-ments and sulphur dioxide concentrations in ambient air. Furthermore, the chemical
25
ACPD
10, 14947–14968, 2010Detection of volcanic plumes
H. Flentje et al.
Title Page
Abstract Introduction
Conclusions References
Tables Figures
◭ ◮
◭ ◮
Back Close
Full Screen / Esc
Printer-friendly Version Interactive Discussion
Discussion
P
a
per
|
Dis
cussion
P
a
per
|
Discussion
P
a
per
|
Discussio
n
P
a
per
|
de/e-ufs.htm, 47.4◦N, 11.0◦E 2650 m a.s.l., 300 m below the Zugspitze summit) in the Northern alpine area, and at the Hohenpeissenberg Meteorological Observatory HPB (http://www.dwd.de/gaw, 47.8◦N, 11.0◦E 985 m a.s.l., 300 m above the surrounding countryside) located in the Northern pre-alpine area of Germany (Mannschreck et al., 2004).
5
Sulphur dioxide is measured with UV pulsed fluorescence analyzers by Thermo In-struments Inc., (model TE43i TLE at UFS and TE43 CTL at HPB), both with detection limits of about 50 ppt (parts per trillion=picomole/mole). Furthermore, measurements (only at HPB) of sulfuric acid (H2SO4) are performed by a Chemical Ion Mass
Spec-trometer (CIMS) instrument involving continuous sampling of ambient air, followed by
10
chemical ionisation with NO−3 ions, cluster dissociation, and mass selective detection (Berresheim et al., 2003). Sulphur dioxide in-situ measurements are performed since 1995 at the Hohenpeissenberg Observatory and since 2000 also at the “Schneefern-erhaus”. CIMS observations of H2SO4 started in the late nineties and are operated
routinely for more than 10 years now.
15
Particle number concentration is measured at the UFS since 2000 by a Buthanol-based condensation particle counter (model TSI CPC 3025a). At HPB, particle mea-surements (total particle mass, particle number concentration, scattering coefficient) for particles larger than 3 nm are continuously available since 1995 (TSI CPC 3025a, 3762, 3772, 3776). The scattering coefficient is measured by a three wavelengths
20
nephelometer (center wavelengths 450 nm, 550 nm, 700 nm, model TSI 3563). An optical particle counter (GRIMM-OPC) complements measurements at HPB of the particle number concentration of larger particles with diameters between 0.3 µm and 30 µm. Smaller particles (between 10 nm and 900 nm) are observed since June 2007 by a Scanning Mobility Particle Sizer (SMPS) which was recently (2009) equipped with
25
ACPD
10, 14947–14968, 2010Detection of volcanic plumes
H. Flentje et al.
Title Page
Abstract Introduction
Conclusions References
Tables Figures
◭ ◮
◭ ◮
Back Close
Full Screen / Esc
Printer-friendly Version Interactive Discussion
Discussion
P
a
per
|
Dis
cussion
P
a
per
|
Discussion
P
a
per
|
Discussio
n
P
a
per
2.3 Ozone sondes and sulphur dioxide column measurements
The Hohenpeissenberg observatory acts as the Regional Ozone Center of the Re-gional Association VI (RA) of the World Meteorological Organization (WMO). As part of this activity a Brewer spectrometer is operated since 1983. These types of instru-ments are partly sensitive to sulphur dioxide and can be used to estimate the total
5
atmospheric SO2 content. The Brewer instruments are however designed to mea-sure primarily the atmospheric ozone content while the retrieval of sulphur dioxide is a side effect of these measurements being necessary for correct ozone measurements. A larger uncertainty of sulphur dioxide amounts retrieved from Brewer data is therefore expected, as it is discussed in detail by Fioletov et al. (1998).
10
The ozone center at the Hohenpeissenberg observatory launches ozone sondes (Brewer Mast) regularly since 1967, e.g. supporting international programmes moni-toring the evolution of the atmospheric ozone content. Brewer Mast ozone sondes are being coupled with Vaisala RS92 radiosondes and are normally launched 2–3 times per week. The sonde measures ozone partial pressure, temperature, pressure,
humid-15
ity, windspeed and -direction every second. Geographical coordinates and geometrical altitude are provided by a GPS module. During flight the data stream is transmitted in real-time to the ground station.
3 Results and discussion
3.1 Ceilometer observations
20
The eruption of the Icelandic Eyjafjallaj ¨okull volcano on 14 April 2010 and later on massively injected particles into the troposphere up to about 10 km altitude. The DWD ceilometer network well tracked the Eyjafjallaj ¨okull ash layers over Germany. The Northern German ceilometer stations observed the plume first in about 7 km altitude on 16 April (Fig. 2). It further crossed Germany from North to South on the frontside of an
ACPD
10, 14947–14968, 2010Detection of volcanic plumes
H. Flentje et al.
Title Page
Abstract Introduction
Conclusions References
Tables Figures
◭ ◮
◭ ◮
Back Close
Full Screen / Esc
Printer-friendly Version Interactive Discussion
Discussion
P
a
per
|
Dis
cussion
P
a
per
|
Discussion
P
a
per
|
Discussio
n
P
a
per
|
extended Azores High. At the middle and southern ceilometer stations the front of the ash layer arrived in about 6–7 km height but after several hours the layer concentrated between 2–4 km altitude only, forming a dense, roughly one km thick layer. In the small figures inside Fig. 1 this appears as a down tilting red-coloured layer. Note that the seemly intermittence of the layer at many stations is due to low clouds which prevented
5
the observation of the ash-layer above.
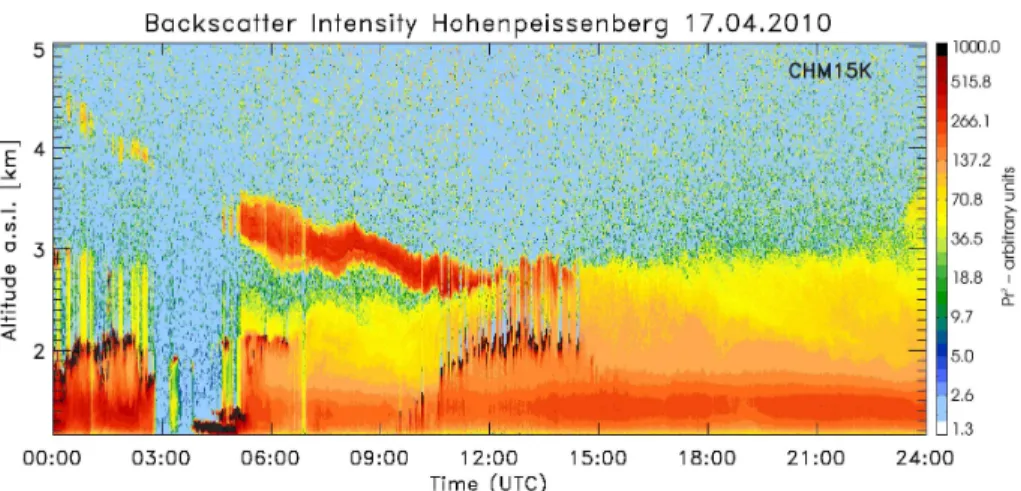
On 17 April the ash layer was only observed over the mainly cloud-free parts of Southern Germany where it was entrained into the convective PBL from noon onwards (Fig. 2). The main event from 17 April till 20 April as seen by the HPB ceilometer is depicted in Fig. 3. At Hohenpeissenberg the peak extinction coefficients and the mass
10
concentrations on 17 April were roughly estimated to be 4 (±2) 10−4m−1 and 500– 750 (±300) µg/m3, respectively, based on co-located aerosol optical depth and neph-elometer (scattering coefficient) measurements (see details in Flentje et al., 2010).
3.2 Ground-based in-situ observations
The global atmospheric sulphur dioxide budget is controlled by natural emissions from
15
volcanoes, the oceans (formation of SO2from dimethylsulfide, H2S) and anthropogenic
emissions (Graf et al., 1997), and the removal of SO2 by wet deposition and reaction
with the OH radical mainly in the troposphere. Due to its tropospheric life time of typically several days it is an excellent tracer of long-range transport of volcanic emis-sions but also for anthropogenic emisemis-sions. In volcanic ash plumes, sulphur dioxide
20
is substantially enhanced and subsequently sulphuric acid may be formed during day (photochemistry), thus giving rise to secondary particle formation. Accordingly, num-ber concentrations in ash plums are generally enhanced due to primary ash particles (µm size range) and occasionally newly generated smaller particles.
Simultaneously with the arrival of the ash plume, the surface concentrations of SO2 25
ACPD
10, 14947–14968, 2010Detection of volcanic plumes
H. Flentje et al.
Title Page
Abstract Introduction
Conclusions References
Tables Figures
◭ ◮
◭ ◮
Back Close
Full Screen / Esc
Printer-friendly Version Interactive Discussion
Discussion
P
a
per
|
Dis
cussion
P
a
per
|
Discussion
P
a
per
|
Discussio
n
P
a
per
about 3.5 ppb (parts per billion) in April since the beginning of the measurements was recorded (Fig. 4). The higher SO2 values at the UFS support the finding (from the ceilometer measurements) that the volcanic plume subsided from higher atmospheric levels into the planetary boundary layer (PBL). After reaching their first maximum dur-ing the night 17/18 April, SO2decreased on 18 April but exhibited a second maximum
5
in the afternoon of 19 April. The concentrations fell back to background levels during 21 April. The particle number concentration of particles larger than 3 nm are highly cor-related with SO2 measurements (as well as corresponding PM10 values measured by the Federal Environmental Agency UBA, personnel communication L. Ries, not shown here). Aerosol parameters and SO2show both a coincident maximum and similar tem-10
poral variation.
At HPB, 40 km north of the UFS and situated in the PBL, also clear signs of volcanic impact were observed, though partially masked by enhanced anthropogenic back-ground. Sulphur dioxide mixing ratios rose from the afternoon of 17 April (14:30 CEST) to several consecutive peaks around 1.5 ppb on 19–22 April in five distinct maxima (see
15
Fig. 5). Highest values of about 2.3 ppb were seen during morning hours on 21 April (Fig. 5), being higher than the 99 percentile for hourly measurements in April between 2000 and 2007. The daily pattern of anthropogenic tracers such as carbon monoxide (CO), nitrogen oxides (NO, NOy) and ozone (O3) did not not show any unusual
tem-poral changes, indicating that the enhanced SO2 at HPB is not due to anthropogenic
20
emissions. Dust events on the other side (e.g. from the Saharan) would not be associ-ated with enhanced SO2concentrations. We therefore interpret our measurements in
the sense that we indeed monitored the volcanic ash plume.
Parallel observations of the CIMS instrument at HPB allowed measurements of the ambient concentration of sulfuric acid. Enhanced levels of SO2are expected to further 25
translate into higher values of H2SO4. Oxidation of sulphur dioxide by the OH radical is the main atmospheric sink of SO2 and this process is more efficient for higher solar
radiation. Associated with high SO2and intensive photochemistry, peak sulphuric acid
ACPD
10, 14947–14968, 2010Detection of volcanic plumes
H. Flentje et al.
Title Page
Abstract Introduction
Conclusions References
Tables Figures
◭ ◮
◭ ◮
Back Close
Full Screen / Esc
Printer-friendly Version Interactive Discussion
Discussion
P
a
per
|
Dis
cussion
P
a
per
|
Discussion
P
a
per
|
Discussio
n
P
a
per
|
The arrival of the plume is also observed in the number concentration of parti-cles of 1–4 µm diameter which represents the typical size range of aged volcanic ash plumes. The size-resolved particle number concentration measured by an optical par-ticle counter (see above) at HPB from 13 April to 23 April is shown in Fig. 7. On 17 April the concentration of larger particles (>1 µm) suddenly rises and values were enhanced
5
for the next six days. The increasing particle number concentration of large particles is temporally in phase with the corresponding ambient SO2enhancement. The amount of
smaller particles around 0.5 µm was not affected, as expected, since volcanic ash typi-cally consists of larger particles. Precipitation on 18 April and 20 April led to decreasing particle concentrations. Due to enhanced sulphuric acid concentrations in volcanic ash
10
plumes, coating of the primarily hydrophobic ash particles is expected to achieve hy-drophilic surfaces. Hence, these could act as condensation nuclei or become attached to cloud drops and subsequently be washed out of the atmosphere. Thus, removal of ash particles is expected to proceed more rapidly than due to simple sedimentation alone.
15
Other measurements within the GAW measurement programme at HPB, the chem-ical analysis of rain water probes and water-soluble aerosols, support the presence of volcanic emissions as well. Enhanced concentrations and deposition of heavy metals ions (iron, manganese) were found in weekly rain water probes, although not being extraordinary high if compared to other samples during the last 1.5 years. Daily rain
20
water probes analyzed by ion chromatography showed higher (but not unusually high) amounts of sulphate, fluorine and calcium ions indicating altogether the presence of volcanic emissions.
3.3 Ozone sondes and total column measurements
Ozone sondes were launched daily between 14 April and 25 April 2010 (excluding
25
ACPD
10, 14947–14968, 2010Detection of volcanic plumes
H. Flentje et al.
Title Page
Abstract Introduction
Conclusions References
Tables Figures
◭ ◮
◭ ◮
Back Close
Full Screen / Esc
Printer-friendly Version Interactive Discussion
Discussion
P
a
per
|
Dis
cussion
P
a
per
|
Discussion
P
a
per
|
Discussio
n
P
a
per
dioxide (and precursor components) on ozone sonde measurements (Schenkel and Broder, 1982).
The retrieved ozone profile from 17 April showed a severely disturbed ozone profile in the lower troposphere between 2.5 km and 7 km a.s.l. (Fig. 8). Layers with reduced ozone appeared also during the following days, but not as pronounced as on Saturday,
5
17 April. In fact, such a distorted profile was never recorded before in the more than 40 years history of ozone sondes launched at Hohenpeissenberg. Also, the ozone sonde launched by the Koninklijk Nederlands Meteorologisch Instituut (KNMI) at DeBilt on 16 April (one day earlier) showed a similar pattern in the lower troposphere between 2 km and 5 km (V. Huijnen, pers. communication). At that time the ash plume arrived
10
from north-westerly direction at the Netherlands and Northern Germany. Part of the registered low ozone values maybe caused by SO2 interfering with the wet-chemical
measurement: 1 ppb SO2 is registered as −1 ppb O3 (Schenkel and Broder, 1982).
Effects of volcanic ash on the measurement can also not be excluded. It is however plausible that substantial ozone amounts were destroyed in the Eyjafjallaj ¨okull plume.
15
Enhanced ozone depletion was also observed by aircraft measurements in the plume on 3 May 2010 (Schumann et al., 2010). Figure 8 shows the last sounding before arrival of the plume, the sounding through the main plume, and two later soundings. For comparison, the white and grey areas show the range of ozone values observed in April 2007 to 2009.
20
The SO2 observations at the UFS coincide further with the SO2 columnar
mea-surements of the Brewer spectrometer at Hohenpeissenberg (Fig. 9). The Brewer spectrometer detected a columnar content of 0.7 DU (Dobson units) on 17 April (daily mean). This corresponds to a layer of about 3 km thickness at a concentration of 3 ppb SO2, or a 1 km layer at 10 ppb SO2. The latter concentration/layer combination better 25
ACPD
10, 14947–14968, 2010Detection of volcanic plumes
H. Flentje et al.
Title Page
Abstract Introduction
Conclusions References
Tables Figures
◭ ◮
◭ ◮
Back Close
Full Screen / Esc
Printer-friendly Version Interactive Discussion
Discussion
P
a
per
|
Dis
cussion
P
a
per
|
Discussion
P
a
per
|
Discussio
n
P
a
per
|
later at the UFS and it therefore appears plausible that the volcanic emissions have started to interfere and mix into the planetary boundary layer causing reduced concen-trations. The “Schneefernerhaus” might have been additionally influenced by upslope winds with potentially lower SO2mixing ratios. A second relative maximum of the SO2 column of about 0.4 DU was observed on 20 April which corresponds to enhanced
5
SO2levels in ambient air at Hohenpeissenberg. The low total SO2columns on 18 April
and 19 April are probably due to precipitation at Hohenpeissenberg during the evening hours on 18 April (1.8 mm).
4 Conclusions
Our study shows that measurements collected at the GAW global station
10
Zugspitze/Hohenpeissenberg and data from Germany’s national ceilometer network can be used together to describe the spatial and temporal evolution of the Eyjafjal-laj ¨okull ash plume that passed Central Europe from 16 April to 23 April 2010. We con-clude that combined observations of SO2 and particles backed by measurements of
anthropogenic trace gases (CO, NO, NO2) form a unique tracer to detect volcanic ash 15
layers in the atmosphere. Other sources of enhanced particle concentrations due to anthropogenic emissions and dust could be ruled out by missing coincident increases of CO and nitrogen oxides in case of anthropogenic plumes.
The ceilometer network detected the ash plume first over Northern Germany. Within one day and being qualitatively in line with model predictions the plume crossed
Ger-20
many from North-West to South-East and various in-situ measurements responded to the changed atmospheric composition. Although error bars seem large, the uncer-tainties are small enough to make use of the network for aviation advisories, indicating whether the legal flight ban threshold of presently 4 mg/m3is imminent to be exceeded. The particle mass concentrations retrieved are comparable to in-situ measurements
25
ACPD
10, 14947–14968, 2010Detection of volcanic plumes
H. Flentje et al.
Title Page
Abstract Introduction
Conclusions References
Tables Figures
◭ ◮
◭ ◮
Back Close
Full Screen / Esc
Printer-friendly Version Interactive Discussion
Discussion
P
a
per
|
Dis
cussion
P
a
per
|
Discussion
P
a
per
|
Discussio
n
P
a
per
other in-situ measurements gathered at HPB and UFS. Simultaneous increases of the SO2and H2SO4concentrations as well as the number concentration of larger particles
(d >1–4 µm) and the chemical composition of rain water confirm the volcanic origin of the analysed layers.
Under clear sky conditions, optical remote sensing instruments from the ground can
5
retrieve the vertical distributions of volcanic ash (ceilometers, aerosol lidars, MAX-DOAS) or the total column in case of SO2(Brewer, MAXDOAS). For an unquestionable identification of volcanic ash plumes, however, in-situ measurements of such layers from high mountain stations and aircrafts, where concentrations of the volcanic ash can be determined directly, are highly recommended. High-altitude observations also
10
allow measurements when low clouds hinder the use of optical remote sensing instru-ments from ground stations.
Acknowledgements. This work was partially supported by the European 6th Framework
Pro-gramme MACC (Monitoring Atmospheric Composition and Climate). We thank our colleagues of Deutscher Wetterdienst at Offenbach and the meteorological observatory Lindenberg for pro-15
viding analysis data and support for the analysis of the ceilometer data. Special thanks to all our colleagues from the Hohenpeissenberg Meteorological observatory, especially M. Adelwart, M. Fricke and N. Kreitner, and the Zugspitze weather station making this study possible by their continuous technical and engineering support.
References
20
Eruption in Eyjafjallaj ¨okull 20 March to present, http://www.earthice.hi.is/page/ies EYJO compiled, 2010. 14948
Berresheim, H., Plass-D ¨ulmer, C., Elste, T., Mihalopoulos, N., and Rohrer, F.: OH in the coastal boundary layer of Crete during MINOS: Measurements and relationship with ozone photoly-sis, Atmos. Chem. Phys., 3, 639–649, doi:10.5194/acp-3-639-2003, 2003. 14951
25
ACPD
10, 14947–14968, 2010Detection of volcanic plumes
H. Flentje et al.
Title Page
Abstract Introduction
Conclusions References
Tables Figures
◭ ◮
◭ ◮
Back Close
Full Screen / Esc
Printer-friendly Version Interactive Discussion
Discussion
P
a
per
|
Dis
cussion
P
a
per
|
Discussion
P
a
per
|
Discussio
n
P
a
per
|
Fioletov, V., Griffioen, E., Kerr, J., Wardle, D., and Uchino, O.: Influence of volcanic sulfur dioxide on spectral UV irradiance as measured by Brewer spectrophotometers, Geophys. Res. Lett., 25, 1665–1668, 1998. 14952
Flentje, H., Heese, B., Reichardt, J., and Thomas, W.: Aerosol Profiling using the Ceilometer Network of the German Meteorological Service, submitted to Atm. Meas. Tech. Discuss, 5
2010. 14949, 14953
Graf, H.-F., Feichter, J., and Langmann, B.: Volcanic sulfur emissions: estimates of source strength and its contribution to the global sulfate distribution, J. Geophys. Res., 102, 10727– 10738, 1997. 14953
Klett, J.: Stable analytical inversion solution for processing lidar returns, Appl. Optics, 20, 211– 10
220, 1981. 14950
Mannschreck, K., Gilge, S., Plass-Duelmer, C., Fricke, W., and Berresheim, H.: Assess-ment of the applicability of NO-NO2-O3 photostationary state to long-term measurements at the Hohenpeissenberg GAW Station, Germany, Atmos. Chem. Phys., 4, 1265–1277, doi:10.5194/acp-4-1265-2004, 2004. 14951
15
Mattis, I., Ansmann, A., M ¨uller, D., Wandinger, U., and Althausen, D.: Multiyear aerosol obser-vations with dual-wavelength Raman lidar in the framework of EARLINET, J. Geophys. Res., 109, D13203, doi:10:1029/2004JD004600, 2004. 14950
Miller, T. and Casadevall, T.: Encyclopedia of Volcanoes, chap. Volcanic ash hazards to avia-tion, 915–930, Elsevier, H. Sigurdsson, New York, 2000. 14949
20
Prata, A.: Satellite detection of hazardous volcanic ash clouds and the risk to global air traffic, Nat. Hazards, doi:10.1007/s11096-008-9273-z, 2008. 14949
Schenkel, A. and Broder, B.: Interference of some trace gases with ozone measurements by the KI-method., Atmos. Environ., 16, 2187–2190, 1982. 14956
Schumann, U., Schlager, H., Weinzierl, B., Reitebuch, O., Minikin, A., and Forster, C.: Volcanic 25
Ash Cloud Observations with the DLR-Falcon over Mid-Europe during and after Airspace Closure, in: EGU 2010, EGU, Vienna, 2010. 14956
Zerefos, C., Nastos, P., Balis, D., Papayannis, A., Kelepertsis, A., Kanelopoulou, E., Niko-lakis, D., Eleftheratos, C., Thomas, W., and Varotsos, C.: A complex study of Etna’s volcanic plume from ground-based, in-situ and space-borne observations, Int. J. Remote Sens., 27, 30
ACPD
10, 14947–14968, 2010Detection of volcanic plumes
H. Flentje et al.
Title Page
Abstract Introduction
Conclusions References
Tables Figures
◭ ◮
◭ ◮
Back Close
Full Screen / Esc
Printer-friendly Version Interactive Discussion
Discussion
P
a
per
|
Dis
cussion
P
a
per
|
Discussion
P
a
per
|
Discussio
n
P
a
per
|
ACPD
10, 14947–14968, 2010Detection of volcanic plumes
H. Flentje et al.
Title Page
Abstract Introduction
Conclusions References
Tables Figures
◭ ◮
◭ ◮
Back Close
Full Screen / Esc
Printer-friendly Version Interactive Discussion
Discussion
P
a
per
|
Dis
cussion
P
a
per
|
Discussion
P
a
per
|
Discussio
n
P
a
per
|
ACPD
10, 14947–14968, 2010Detection of volcanic plumes
H. Flentje et al.
Title Page
Abstract Introduction
Conclusions References
Tables Figures
◭ ◮
◭ ◮
Back Close
Full Screen / Esc
Printer-friendly Version Interactive Discussion
Discussion
P
a
per
|
Dis
cussion
P
a
per
|
Discussion
P
a
per
|
Discussio
n
P
a
per
|
ACPD
10, 14947–14968, 2010Detection of volcanic plumes
H. Flentje et al.
Title Page
Abstract Introduction
Conclusions References
Tables Figures
◭ ◮
◭ ◮
Back Close
Full Screen / Esc
Printer-friendly Version Interactive Discussion
Discussion
P
a
per
|
Dis
cussion
P
a
per
|
Discussion
P
a
per
|
Discussio
n
P
a
per
|
ACPD
10, 14947–14968, 2010Detection of volcanic plumes
H. Flentje et al.
Title Page
Abstract Introduction
Conclusions References
Tables Figures
◭ ◮
◭ ◮
Back Close
Full Screen / Esc
Printer-friendly Version Interactive Discussion
Discussion
P
a
per
|
Dis
cussion
P
a
per
|
Discussion
P
a
per
|
Discussio
n
P
a
per