Article
Printed in Brazil - ©2014 Sociedade Brasileira de Química 0103 - 5053 $6.00+0.00
A
*e-mail: [email protected]
Chemotaxonomy of
Marsypianthes
Mart. ex Benth.
Based on Essential Oil
Variability
Márcia Y. Hashimoto,a Deomar P. Costa,b Maria T. Faria,a Heleno D. Ferreira,a
Suzana C. Santos,b José R. Paula,c José C. Seraphind and Pedro H. Ferri*,b
aInstituto de Ciências Biológicas, bInstituto de Química, cFaculdade de Farmácia and dInstituto de Matemática e Estatística, Universidade Federal de Goiás,
CP 131, 74001-970 Goiânia-GO, Brazil
Os óleos essenciais de quatro espécies de Marsypianthes (Lamiaceae) foram investigados
por meio de cromatografia gasosa e análise multivariada. Cada espécie foi representada por duas
a sete populações, totalizando dezessete populações. β-Elemeno, (E)-cariofileno, α-humuleno,
germacreno D, biciclogermacreno, δ-cadineno, espatulenol, óxido de cariofileno e globulol
ocorreram em todas as amostras. As análises de componentes principais e de agrupamento
hierárquico evidenciaram a presença de duas seções, uma contendo M. chamaedrys/M. montana
(seção A) e a outra contendo M. burchellii (seção B). M. foliolosa apresentou maior complexidade,
dividindo-se nas duas seções. Resultados similares foram obtidos de acordo com os esqueletos carbônicos biosssintéticos. Germacranos e biciclogermacranos preponderaram na seção A, enquanto aromadendranos e guaianos caracterizaram a seção B. A análise de redundância canônica mostrou que os agrupamentos não foram influenciados por variáveis edáficas dos locais de amostragem.
Essential oils of four species of Marsypianthes (Lamiaceae) were investigated via gas
chromatography and multivariate analysis. Each species was represented by two to seven
populations, totaling seventeen populations. β-Elemene, (E)-caryophyllene, α-humulene,
germacrene D, bicyclogermacrene, δ-cadinene, spathulenol, caryophyllene oxide, and globulol were
found in all samples. Principal component and hierarchical cluster analyses revealed the presence
of two sections, one containing M. chamaedrys/M. montana (section A) and the other M. burchellii
(section B). M. foliolosa showed higher complexity, being divided in both sections. Similar results
were obtained according to biosynthetic carbon skeletons. Germacranes and bicyclogermacranes predominated in section A, whereas aromadendranes, bourbonanes and guaianes characterized section B. Canonical redundancy analysis revealed that clusters were not influenced by edaphic factors in sampling sites.
Keywords:Marsypianthes, essential oils, chemical variability, chemotaxonomy
Introduction
Essential oils comprise a class of natural products whose biosynthesis involves genetic control, even though environmental factors influence a wide variety of plant species.1 This phenotypic plasticity often occurs under
conditions of biotic or abiotic stress and plays an important role in an individual’s adaptation to the environment. Adaptive characteristics of essential oils affect the structure of a community in terms of chemical, genetic, and ecological aspects.2 Such knowledge of populational
structure may thus contribute to chemotaxonomy, conservation, and management of plant species.3
In Brazilian Cerrado areas, the family Lamiaceae is represented mainly by subtribe Hyptidinea, tribe Ocimeae, whose taxonomic and floristic patterns resulted in endemic genera, forming a large number of new species.4 Nine
Peltodon, based on morphological and molecular markers.5
Marsypianthes contains about five species, which grow in Brazil’s Cerrado regions, extending into Paraguay and Argentina. Its species have been little studied regarding botanical and chemical aspects. M. chamaedrys (Vahl) Kuntze, a species distributed from Mexico and the Caribbean to Argentina, is the only representative to have its chemical data reported.6,7 This species has been the
object of several past studies, which researched biologically active constituents against snake bites and analgesic and anti-inflammatory actions;8 moreover, it has been the only
species investigated on the essential oil composition of the genus.7
Therefore, this research investigates the chemical constituents of essential oils of four Marsypianthes species collected from central Brazilian Cerrado by gas chromatography (GC/FID and GC/MS). Matrices containing chemical constituents and those from soil sampling sites were subjected to multivariate statistical techniques; this led to the detection of genetic variability patterns and to the assessment of the influence of the environmental gradient as contributions to the genus’ chemotaxonomic classification.
Experimental
Botanical material
Marsypianthes spp. samples at the flowering stage were collected from October 2011 to December 2012 in Goiás State, Brazil. All species were collected from different sampling sites to assess the edaphic influence on oil compositions. Specimens were identified by one of the authors (M. Y. H.) and by Dr Raymond M. Harley from the Royal Botanic Gardens, Kew. Voucher specimens were deposited at the Conservation Unit of the Herbarium of Universidade Federal de Goiás (UFG), Goiás State, Brazil. A list of the taxa investigated as well as provenance and voucher specimens is shown in Supplementary Information (SI) (Table S1).
Extraction and essential oil analysis
To assess essential oils, 2-4 individuals from each species originated from 2-7 local populations were pooled and dried at room temperature for seven days at 30 °C until constant weight. After powdering, each sample’s dried aerial part (10-30 g) was submitted to hydrodistillation (3 h) using a modified Clevenger-type apparatus. At the end of each distillation, oils were collected with hexane (0.5 mL)
and dried with anhydrous Na2SO4, then transferred to glass
flasks, where they were kept at a temperature of –18 °C. A Varian CP3900 gas chromatograph equipped with a flame ionization detector (FID) was used for the compositional analysis of the essential oils. Samples (0.4 µL in hexane 20% v/v) were injected in the split mode in a DB-5 (J&W Scientific) fused silica capillary column of 30 m × 0.25 mm; 0.25 µm film thickness (5% phenylmethylpolisiloxane). The chromatographic conditions were as follows: injector port and detector temperature were 220 °C and 240 °C, respectively; column temperature was programmed from 60 °C to 246 °C at 3 °C min–1, then 10 °C min–1 to 260 °C. The carrier gas
was N2 at a flow of 1.0 mL min–1. The relative percentages
of constituents were determined from their GC peak areas without correction factors. Gas chromatography-mass spectrometry (GC/MS) analyses were performed with a Shimadzu QP505A using a CBP-5 (Shimadzu) fused silica capillary column of 30 m × 0.25 mm; 0.25 µm film thickness (5% phenylmethylpolisiloxane) and maintaining a flow rate of 1.0 mL min–1 (helium); injector, interface,
and programmed heating temperatures were the same as above. Samples’ injection volume was 0.4 µL in hexane (20% v/v) with a 1:20 ratio. The analysis was conducted in scan mode at 70 eV, mass range of 40-400 m/z,and speed of 1.0 scan s–1.
Identifying oil constituents involved comparing mass spectra and Arithmetic Indices (AI),9 co-injection
with commercial standards, and essential oils such as ylang-ylang (Cananga odorata (Lam.) Hook. F. & Thoms., Annonaceae) and clary sage (Salvia sclarea L., Lamiaceae). Arithmetic indices were calculated by linear hydrocarbon (C8-C32)co-injection and expressed
as average retention index values.10 GC results were
expressed as a matrix containing the identified compounds (17 populations × 71 constituents) and the biosynthetic carbon skeletons of oil constituents (17 × 27) which were used in subsequent chemometric analyses.
Soil analysis
Three soil samples were also collected at a 0-20 cm depth around each sample and pooled together to form a composite sample for each local population; they were subsequently air-dried, thoroughly mixed, and sieved (2 mm). The portion finer than 2 mm was kept for physical and chemical analysis, resulting in a total of 16 parameters. The pH was determined in a 1:1 soil-water volume ratio. Ca2+, Mg2+, and Al3+ were extracted with 1 mol L–1 KCl,
and P, K+, Zn2+, Cu2+, Fe2+, and Mn2+ were extracted
Mg2+, Cu2+, Fe2+, Mn2+, and Zn2+ were measured by flame
atomic absorption spectrometry (AAS, Perkin Elmer), and phosphorous was determined by spectrophotometry (DU-70 Spectrophotometer, Bekmann). Organic matter (OM), cationic exchange capacity (CEC), potential acidity (H+ + Al3+), Al3+, and soil texture (clay, sand, and silt)
were determined by applying the usual methods,11 and
were arranged in a matrix (SI, Table S2) with 17 lines (populations) and 16 columns (soil variables).
Statistical analysis
The matrix containing the chemical constituents of essential oils was submitted to principal component analysis (PCA) using the SPAD package.12 For the variable
selection, the number of residual eigenvalues (≤ 0.70) was used to determine the maximum number of variables to be removed without significant alteration to the original data (17 × 71). The eliminated variables expressed the highest loadings in residual eigenvalues and contributed with ≤ 0.30% to the chemical profiles (mean values). PCA allowed the final matrix (17 × 50) to be projected on the first factorial plan, retaining a significant variance percentage in PC1 × PC2 axes. Subsequently, hierarchical clustering analysis (HCA) was applied to the study of similarity between individuals (populations) based on the distribution of chemical constituents using scores for the first ten PCA axes according to the SPAD default option. Nearest neighbour complete linkage technique by Benzécri algorithm was used as an index of similarity and hierarchical clustering was performed according to Ward’s variance minimizing method.13 This methodology was
also applied to biosynthetic carbon skeletons. Canonical discriminant analysis (CDA) was used to validate clusters. CDA was conducted in the SAS.14 The analysis of variance
(ANOVA) was used for multiple comparisons of means in clusters. Homoscedasticity of variance was verified by Hartley’s test using angular or rank transformation (when violated). When the difference between means was established in ANOVA, Tukey’s test at 5% probability was applied. P-values < 0.05 were considered significant.
To assess environmental influence on essential oils’ chemical variability, canonical redundancy analysis (RDA) was applied to examine the relationship between chemical and environmental matrices, i.e., essential oil constituents (response variables), conditioned by the characteristics of soil samples defined as explanatory variables (16 variables). RDA employed the CANOCO 5 package.15 Prior to the
multivariate analyses, oil constituents along soil texture (clay, sand, and silt) and organic matter were converted by angular transformation. Soil macro and micronutrients were
transformed by log (x +1). All variables were preprocessed by mean centering and auto-scaling.
Results and Discussion
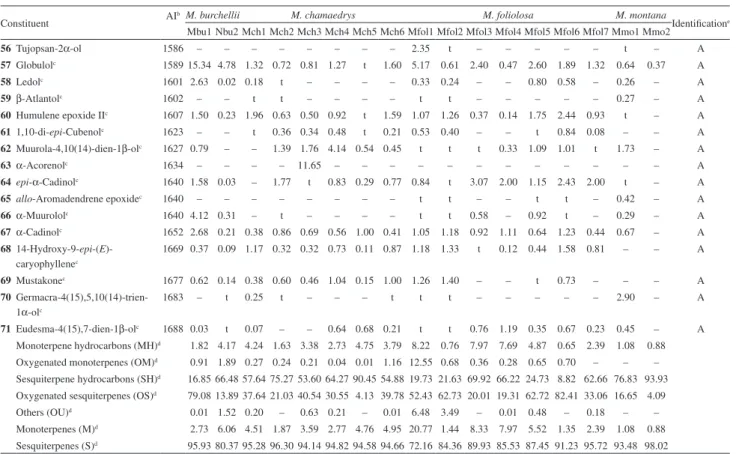
The chemical compositions of essential oils of four Marsypianthes species from 17 populations were analyzed by GC/FID and GC/MS. A total of 71 chemical constituents were identified with the majority consisting of terpenes, of which 21 were monoterpenes, 43 were sesquiterpenes, and 7 included other constituents (Table 1). Among those identified, only 9 were observed for all samples: β-elemene (29), (E)-caryophyllene (32), α-humulene (35), germacrene D (39), bicyclogermacrene (42), δ-cadinene (47), spathulenol (54), caryophyllene oxide (55) and globulol (57). Germacrene D (total mean value of 18.68 ± 13.77%), spathulenol (18.54 ± 16.00%), and bicyclogermacrene (13.46 ± 13.75%) were the main constituents in the data set.
When analyzing the distribution of chemical constituents in different populations, trans-limonene oxide (15), acora-3,7(14)-diene (31), allo-aromadendrene (37), and α-acorenol (63) occurred in a single populations, whereas β-pinene (5), α-copaene (26), β-bourbonene (28), and α-cadinol (67) were absent from one population (Mmo2). These unique occurrences (absence) in terpenoid biosynthesis may be considered positive (negative) autapomorphies, and their evolution in species represents the emergence of an additional substance or the loss of a substance always present.16 These changes may also
result from alterations in terpene synthases, in which some terpenes are redirected over others, as has been suggested by some researchers.17 Nevertheless, it is possible that low
terpenoid concentrations are currently traces of substances that have functioned in the past against herbivores.18
In this sense, essential oil chemical variability may contribute to the phylogeny and chemotaxonomy of the genus Marsypianthes. In fact, chemical polymorphism in essential oils has helped to identify taxonomic relationships in various Lamiaceae genera, as well as intraspecific variability when analyzing more than one population per taxon.19
Table 1. Chemical composition of essential oils from 17 populations of Marsypianthes Mart. ex Benth. in central Brazilian Cerrado
Constituent AIb M. burchellii M. chamaedrys M. foliolosa M. montanaIdentificatione
Mbu1 Nbu2 Mch1 Mch2 Mch3 Mch4 Mch5 Mch6 Mfol1 Mfol2 Mfol3 Mfol4 Mfol5 Mfol6 Mfol7 Mmo1 Mmo2
1 Tricyclene 919 t – – 0.21 0.01 0.01 – t 0.57 0.34 t 0.04 t t – 0.12 – A
2 α-Pinene 929 0.06 1.16 0.10 – 0.02 0.05 0.07 0.21 0.90 – 0.30 0.71 0.45 – t – – A, B
3 Camphenec 944 t 0.61 0.10 – – – 0.02 – 3.57 t 0.09 1.10 0.65 0.41 – t – A
4 Sabinene 969 – 0.06 0.20 – – – 0.03 – – – 0.08 – – – – 0.08 – A
5 β-Pinenec 973 1.76 1.68 0.81 0.47 1.60 1.52 0.15 0.80 1.59 t 3.56 3.20 2.78 0.24 t 0.37 – A, B
6 2-Pentylfuran 986 0.01 0.99 – – – – – – – 0.23 – – – – – – – A
7 Myrcenec 987 – – 0.43 0.16 0.07 0.02 1.19 0.34 0.73 t 0.36 0.33 0.16 – – – – A, D
8 Limonenec 1024 t 0.46 2.35 0.21 0.38 – 2.42 2.21 0.86 0.42 0.07 t – – – 0.08 – A, B
9 1,8-Cineole 1028 t 1.46 – – 0.17 – – 0.06 t – – – – – – – – A, B
10(Z)-β-Ocimenec 1033 – – – – 0.15 0.05 0.05 t – – 0.22 0.17 0.06 – 0.09 t – A
11(E)-β-Ocimenec 1043 – 0.20 0.25 0.58 1.15 1.08 0.82 0.23 – – 3.29 2.14 0.77 – 2.30 0.43 0.88 A
12Linaloolc 1096 0.42 0.43 – 0.24 0.04 0.02 – 0.06 1.03 0.48 0.18 – 0.27 0.24 t t – A, D
13n-Nonanal 1100 – 0.14 0.10 – – 0.21 – 0.01 0.27 0.76 t 0.01 0.04 t t t – A
14trans-Pinocarveol 1135 0.25 – – – – – – – 1.10 t t t t t t – – A
15trans-Limonene oxide 1140 – – – – – – – – 0.59 – – – – – – – – A
16trans-Sabinol 1142 0.04 – – – – – – – 0.71 – t t t 0.46 t – – A
17Pinocarvone 1158 – – – – – – – – 0.27 0.06 t t t t t – – A
18Borneolc 1162 – – – – – – – 0.32 5.16 0.14 t t t t t t – A
19Naphthalene 1177 – 0.39 0.10 – – – – – t 0.75 – – – – – – – A, B
20α-Terpineol 1188 0.08 t – – – – – – – – – – – – – – – A, D
21Myrtenol 1192 0.14 t – – – – – – – – – – – – – – – A
22Myrtenal 1194 0.06 t – – – – – – – – – – – – – – – A
23cis-hydrosabinene acetate 1224 – – 0.27 – – t t 0.72 0.86 t 0.12 0.28 0.01 t – t – A
24Isobornyl acetatec 1282 – – t t t 0.02 0.01 t 2.83 t 0.06 – 0.37 t t t – A
25δ-Elemenec 1334 t t t 1.68 0.43 2.16 0.91 0.59 0.97 t 0.10 t 0.04 t – 2.14 – A 26α-Copaenec 1373 1.03 1.48 2.10 4.03 2.13 4.18 4.17 2.16 1.39 t 0.54 0.52 0.18 t t 0.54 – A, C 27β-Cubebenec 1382 t t 0.25 0.41 0.43 0.98 0.76 0.21 0.11 0.24 t 0.24 0.10 – – t – A 28β-Bourbonenec 1384 1.63 3.60 3.25 0.35 3.80 2.53 2.16 1.66 4.09 11.13 2.26 4.04 5.51 2.95 0.26 1.61 – A 29β-Elemenec 1390 t 0.19 0.53 0.82 1.53 1.00 0.90 0.61 t 0.68 0.91 1.02 t t t 0.73 0.81 A, C
30Longifolenec 1412 t 8.64 – – – – – – – – – – – – – – – A
31Acora-3,7(14)-dienec 1412 – 7.33 – – – – – – – – – – – – – – – A
32(E)-Caryophyllenec 1417 0.53 7.98 14.39 12.98 7.31 9.57 17.26 7.41 6.11 2.91 12.94 6.18 1.42 t 19.22 10.07 6.82 A, B 33β-Copaenec 1427 – – 0.49 – 0.31 0.23 0.25 0.18 t t 0.16 0.37 0.18 t t t – A, B
34α-trans-Bergamotenec 1434 – – 0.51 0.42 t 0.97 0.73 0.35 t – – – – – 0.06 t – A
35α-Humulenec 1452 0.11 1.58 2.31 2.88 1.18 2.05 3.36 1.31 t 0.40 1.44 0.58 0.17 1.14 2.68 0.55 0.69 A, C
36Geranylacetone 1452 – – t t 0.63 t – – t 1.10 – – 0.44 – 0.18 – – A
37allo-Aromadendrenec 1453 – – – – – – – – – – – – – – – – 0.40 A, B
38γ-Gurjunenec 1472 0.42 3.78 t – – – – – t 1.39 – – – 0.65 – t – A 39Germacrene Dc 1483 1.29 23.49 22.52 25.90 15.74 17.35 46.06 25.45 1.05 2.13 39.57 34.92 5.56 1.67 4.83 26.53 23.52 A, C
40(E)-β-Ionone 1485 – – – – – – – – t 0.65 – – – – – – – A
41β-Selinenec 1487 0.85 0.14 0.38 0.24 0.11 0.79 – 0.54 0.42 0.53 – – t – – 0.77 1.71 A 42Bicyclogermacrenec 1497 3.11 4.33 8.54 16.95 15.40 17.45 3.17 10.47 1.15 1.60 2.35 17.60 8.73 0.92 34.23 30.33 52.50 A 43α-Muurolene 1497 1.74 0.06 – – – – – – 0.28 – – – – – – – – A
44Germacrene Ac 1505 t 1.04 1.33 2.09 1.58 1.79 2.96 1.10 1.26 t 1.40 – – 0.21 0.70 1.25 1.50 A 45γ-Cadinenec 1511 0.46 0.24 t 0.78 t t t – 0.87 t – – 1.35 t 0.13 0.46 – A
466-Methyl-α-iononec 1517 – – t – – – – – 6.21 t – – – – – t – A
47δ-Cadinenec 1521 5.22 2.54 1.04 3.61 0.72 2.39 3.11 2.06 2.03 0.62 1.21 0.75 1.03 0.22 0.25 1.85 0.74 A, C
48Zonarene 1535 – – – 1.02 – – – – t – – – – – 0.06 – – A
49cis-Sesquisabinene hydratec 1547 – – 1.17 0.21 – – – t 1.24 0.85 1.28 t t – – – – A
50Germacrene Bc 1555 0.46 0.06 – 1.11 2.93 0.83 4.65 0.78 – – 7.04 t 0.46 1.06 0.24 t 5.24 A
511-nor-Bourbonanonec 1557 0.25 0.07 0.46 t t – – – 1.15 3.22 – t t 3.29 – – – A
52(E)-Nerolidol 1565 – – 0.46 – – – – – t t – – – – t t – A
53Palustrolc 1566 2.34 2.07 – – – – – – 1.53 t – – – 0.52 0.16 t – A
PC2 distinguished Mch1-Mch6 and Mfol1/Mfol2/Mfol6 according to the highest monoterpene content (M). Thus, five clusters were obtained by PCA/HCA: I, with all
M. chamaedrys populations; II, incorporating populations Mfol3-Mfol5 and Mfol7 of M. foliolosa; III, representing M. montana; IV, separating M. burchellii and V, containing the remaining populations of M. foliolosa (Mfol1, Mfol2, and Mfol6).
The similarity between populations shown by the HCA dendrogram is represented by Figure 2. M. burchellii and about half of M. foliolosa populations showed great similarity (section B), whereas M. chamaedrys, M. montana, and other populations of M. foliolosa were clustered in section A. The division of M. foliolosa populations is consistent with the greater complexity of this species.5
In fact, quantitative differences in essential oil composition exist among clusters. Cluster I is mainly characterized by the accumulation of (E)-caryophyllene (32) (11.49 ± 3.69%, p = 0.048) and α-copaene (26) (3.13 ± 1.00%, p = 0.0001 ); cluster II showed the highest contents of β-pinene (5) (2.39 ± 1.40%, p = 0.009) and (E)-β-ocimene (11) (2.13 ± 0.90%, p = 0.001); cluster III revealed high contents of bicyclogermacrene (42) (41.42 ± 11.09%, p = 0.001); cluster IV had the highest
Constituent AIb M. burchellii M. chamaedrys M. foliolosa M. montanaIdentificatione
Mbu1 Nbu2 Mch1 Mch2 Mch3 Mch4 Mch5 Mch6 Mfol1 Mfol2 Mfol3 Mfol4 Mfol5 Mfol6 Mfol7 Mmo1 Mmo2
56Tujopsan-2α-ol 1586 – – – – – – – – 2.35 t – – – – – t – A
57Globulolc 1589 15.34 4.78 1.32 0.72 0.81 1.27 t 1.60 5.17 0.61 2.40 0.47 2.60 1.89 1.32 0.64 0.37 A
58Ledolc 1601 2.63 0.02 0.18 t – – – – 0.33 0.24 – – 0.80 0.58 – 0.26 – A
59β-Atlantolc 1602 – – t t – – – – t t – – – – – 0.27 – A 60Humulene epoxide IIc 1607 1.50 0.23 1.96 0.63 0.50 0.92 t 1.59 1.07 1.26 0.37 0.14 1.75 2.44 0.93 t – A
611,10-di-epi-Cubenolc 1623 – – t 0.36 0.34 0.48 t 0.21 0.53 0.40 – – t 0.84 0.08 – – A
62Muurola-4,10(14)-dien-1β-olc 1627 0.79 – – 1.39 1.76 4.14 0.54 0.45 t t t 0.33 1.09 1.01 t 1.73 – A 63α-Acorenolc 1634 – – – – 11.65 – – – – – – – – – – – – A 64epi-α-Cadinolc 1640 1.58 0.03 – 1.77 t 0.83 0.29 0.77 0.84 t 3.07 2.00 1.15 2.43 2.00 t – A
65allo-Aromadendrene epoxidec 1640 – – – – – – – – t t – – t t – 0.42 – A
66α-Muurololc 1640 4.12 0.31 – t – – – – t t 0.58 – 0.92 t – 0.29 – A 67α-Cadinolc 1652 2.68 0.21 0.38 0.86 0.69 0.56 1.00 0.41 1.05 1.18 0.92 1.11 0.64 1.23 0.44 0.67 – A 6814-Hydroxy-9-epi-(E
)-caryophyllenec
1669 0.37 0.09 1.17 0.32 0.32 0.73 0.11 0.87 1.18 1.33 t 0.12 0.44 1.58 0.81 – – A
69Mustakonec 1677 0.62 0.14 0.38 0.60 0.46 1.04 0.15 1.00 1.26 1.40 – – t 0.73 – – – A
70 Germacra-4(15),5,10(14)-trien-1α-olc
1683 – t 0.25 t – – – t t t – – – – – 2.90 – A
71Eudesma-4(15),7-dien-1β-olc 1688 0.03 t 0.07 – – 0.64 0.68 0.21 t t 0.76 1.19 0.35 0.67 0.23 0.45 – A
Monoterpene hydrocarbons (MH)d 1.82 4.17 4.24 1.63 3.38 2.73 4.75 3.79 8.22 0.76 7.97 7.69 4.87 0.65 2.39 1.08 0.88
Oxygenated monoterpenes (OM)d 0.91 1.89 0.27 0.24 0.21 0.04 0.01 1.16 12.55 0.68 0.36 0.28 0.65 0.70 – – –
Sesquiterpene hydrocarbons (SH)d 16.85 66.48 57.64 75.27 53.60 64.27 90.45 54.88 19.73 21.63 69.92 66.22 24.73 8.82 62.66 76.83 93.93
Oxygenated sesquiterpenes (OS)d 79.08 13.89 37.64 21.03 40.54 30.55 4.13 39.78 52.43 62.73 20.01 19.31 62.72 82.41 33.06 16.65 4.09
Others (OU)d 0.01 1.52 0.20 – 0.63 0.21 – 0.01 6.48 3.49 – 0.01 0.48 – 0.18 – –
Monoterpenes (M)d 2.73 6.06 4.51 1.87 3.59 2.77 4.76 4.95 20.77 1.44 8.33 7.97 5.52 1.35 2.39 1.08 0.88
Sesquiterpenes (S)d 95.93 80.37 95.28 96.30 94.14 94.82 94.58 94.66 72.16 84.36 89.93 85.53 87.45 91.23 95.72 93.48 98.02
aPercentage values; baverage arithmetic index;10cselected for PCA/HCA; dsupplementary variables in PCA;t = trace; – = not detected ; ethe reliability of the identification or
structural proposal is indicated by: A-mass spectrum and arithmetic index consistent with those found in literature;9 B-mass spectrum and retention time consistent with standard;
C-mass spectrum and retention time consistent with those of ylang-ylang (Cananga odorata) essential oil;9 D-mass spectrum and retention time consistent with those of clare
sagy (Salvia sclarea) essential oil.9 Table 1. continuation
levels of globulol (57) (10.06 ± 5.28%, p = 0.001) and
δ-cadinene (47) (3.88 ± 1.34%, p = 0.008); cluster V featured high levels of spathulenol (54) (36.34 ± 14.56%, p = 0.020) and caryophyllene oxide (55) (14.38 ± 2.08%, p = 0.002).
The validation of the HCA results was obtained by canonical discriminant analysis (CDA). An axial representation of CDA discriminated all clusters based only on the contents of (E)-β-ocimene (11), α-copaene,
β-selinene (41), 1-nor-bourbonanone (51) and palustrol (53), as predictor variables (Table 2).
CDA model showed high canonical correlation (RF1 = 0.992, RF2 = 0.930) and a low value for Wilks’ lambda (Λ(F1) = 0.0002, Λ(F2) = 0.0138), thus demonstrating
the excellent ability of predictor variables on clusters differentiation. Discriminant functions F1 and F2
differentiated (p < 0.0001) cluster IV due to positive palustrol scores, whereas cluster I was distinguished by its high negative (F2) α-copaene score. Cluster V was characterized by high positive (F1) and negative (F2) scores for 1-nor-bourbonanone and β-selinene, respectively. In turn, increasing levels of (E)-β-ocimene distinguished clusters II from III (SI, Figure S1). It was also possible to make an accurate prediction of 88% correct classification in the original clusters by cross-validation approach. This technique consider a slightly reduced number of samples from the parent data set, estimate parameters from each of these modified data sets, and then calculate the precision of predictions for the samples previously removed by the resulting models. Two samples belonging to clusters I and V were classified as mismatched, because they had different contents of α-copaene and 1-nor-bourbonanone, respectively, which is typical of such clusters. Percentages of oil constituents in clustered samples are shown in SI (Table S3).
In another analysis of sample classification, chemical constituents were reorganized according to biosynthetic carbon skeletons. This strategy reduces the uncontrolled factors affecting oil quantitative variations and may assimilate the overall trends in terpenoid biosynthesis in essential oils from Marsypianthes populations in a more satisfactory way. The normalized percentage of carbon skeletons (SI, Table S4) showed a preponderance of aromadendranes (mean 22.7 ± 19.3%), germacranes (22.1 ± 16.0%), caryophyllanes (17.1 ± 5.85%), and bicyclogermacranes (13.9 ± 14.0%) in Marsypianthes oils. The analysis of PCA/HCA applied to this matrix led to the same differences between M. chamaedrys/M. montana and M. burchellii, with M. foliolosa being divided in the two
Figure 2. HCA dendrogram of similarity between Marsypianthes Mart. ex Benth. populations according to essential oil constituents: cluster I (), II (), III () IV (), and V (), and their chemical sections A and B.
Table 2. CDA summary for clustered Marsypianthes Mart. ex Benth. populations
A. Canonical function Eigenvalue percentageRelative correlationCanonical Wilks’ lambda (Λ) χ2a DFb P
F1 61.544 85.2 0.992 0.0002 92.62 20; 27 0.0001
F2 6.396 8.9 0.930 0.0138 47.13 12; 24 0.0001
B. Standardized coefficient (E)-β-Ocimene α-Copaene β-Selinene 1-nor-Bourbonanone Palustrol
F1 −0.08 0.35 0.06 2.17 2.04
F2 0.57 −1.04 −0.24 −0.33 0.33
C. Cluster baricenter I II III IV V
F1 −3.49 −5.04 −4.86 10.06 10.23
F2 −2.44 2.96 0.65 1.52 −0.51
D. Cluster validation Percentage of well-classification
I II III IV V Total
100 75 100 100 67 88
aChi-square; bdegrees of freedom; total samples = 17; cluster: I (n = 6): Mcha1-Mcha6; II (n = 4): Mfol3-Mfol5, Mfol7; III (n = 2): Mmo1, Mmo2;
sections (SI, Figure S3), as previously defined. The latter presented a composition similar to that observed with chemical constituents as variables, although population Mfol5 did not follow the same trend.
These results support the existence of two chemical sections for Marsypianthes. In section A, germacranes (30.1 ± 12.8%, p = 0.003) and bicyclogermacranes (19.5 ± 14.5%, p = 0.015) were the most prevalent, whereas section B was characterized by higher values of aromadendranes (41.9 ± 18.9%, p = 0.002), bourbonanes (6.68 ± 4.47%, p = 0.008) and guaianes (1.16 ± 1.50%, p = 0.017). Elemanes, bergamotanes and camphanes, despite minor values, proved important for chemotaxonomy, leading to 94% correct classification of samples between sections A and B using CDA (Λ(F1) = 0.409, p = 0.021;
canonical correlation, RF1 = 0.769). Section A was marked by the absence of guaianes, as well as the highest levels of elemanes (1.57%) and bergamotanes (0.28%), whereas these biosynthetic carbon skeletons showed the lowest content (elemanes) or absence (bergamotanes) in section B.
To evaluate environmental influence on essential oil variability, especially on M. foliolosa populations, RDA was performed assuming oil constituents as response variables, which in turn were conditioned by soil characteristics as explanatory variables. In RDA, the oil-environmental correlation equals the correlation between sampled site scores that are weighted sums of oil and site scores, which in turn are a linear combination of environmental variables.20 RDA canonical axis is similar to PCA, but it
has a restriction on sampled site scores.
RDA results indicated that edaphic factors have not been able to explain chemical variability in all Marsypianthes species (p = 0.663) or in the subset comprising only M. foliolosa populations (p = 0.728). This finding suggests the presence of two M. foliolosa chemotypes. However, populations in cluster I (M. chamaedrys) may be associated with a higher pressure of herbivory, due to the well-known defensive action of (E)-caryophyllene, found in higher amounts in the essential oils from this cluster’s samples.21 Contents of the main chemical constituents of
M. chamaedrys were similar to those described for the essential oils of this species collected in northeastern Brazil.7
The influence of environmental and genetic factors on the chemical variability of essential oils is widely known.1
The occurrence of chemotypes,22 ecotypes,23 and biotypes
has been described in native central Cerrado species,24
specially in Goiás State. Additionally, terpenes have been described as chemomarkers in other genera, such as Helichrysum (Asteraceae) and Curcuma (Zingiberaceae),25 and have proved particularly useful for accessing the taxonomy of Lamiaceae.3,19,26
Results suggest the need for an anatomical study of M. foliolosa in view of the significant differences found in the chemical composition of essential oils between the clustered populations. These differences in essential oils also suggest a possible division of the genus into two chemical sections, which may contribute to the taxonomy of the genus, whose species have been the object of few studies as regards morphological and anatomical aspects. In addition, differences in oil composition may prove useful towards better understanding phylogenetic relationships in the subtribe Hyptidinae.
Conclusion
Essential oil chemical variability from the aerial parts of 17 populations, distributed in four Marsypianthes species revealed high polymorphism, which is related to genetic influences. Results indicated that clustered samples based on multivariate analyses of oil chemovariations support the division of species into two taxonomic sections. M. burchellii differed from M. chamaedrys/M. montana, whereas M. foliolosa populations were divided in the two sections, a finding which suggests that the latter species may be submitted to further botanical investigation.
Supplementary Information
Supplementary data (Figures S1-S3 and Tables S1-S4) is available free of charge at http://jbcs.sbq.org.br as a PDF file.
Acknowledgements
We wish to express our thanks to Dr Raymond M. Harley, for kindly assisting us with the botanical identification, and to Dr Anita J. Marsaioli (IQ-Unicamp), for supplying the standards. We are also indebted to Conselho Nacional de Desenvolvimento Científico e Tecnológico (CNPq, process number 301167/2011-7), Programa de Apoio ao Desenvolvimento Científico e Tecnológico (PADCT III) and Fundação de Apoio à Pesquisa (FUNAPE/UFG) for their financial support.
References
1. Franz, C.; Novak, J. In Handbook of Essential Oils. Science, Technology, and Applications; Baser, K. H. C.; Buchbauer, G., eds.; CRC Press: Boca Raton, 2010, ch. 3.
2. Vilela, E. C.; Carvalho, T. C.; Duarte, A. R.; Naves, R. R.; Santos, S. C.; Seraphin, J. C.; Ferri, P. H.; J. Braz. Chem. Soc.
3. Silva, J. G.; Faria, M. T.; Oliveira, E. R.; Rezende, M. H.; Ribeiro, D. G.; Ferreira, H. D.; Santos, S. C.; Seraphin, J. C.; Ferri, P. H.; J. Braz. Chem. Soc. 2011, 22, 955; Faria, M. T.; Costa, D. P.; Vilela, E. C.; Ferreira, H. D.; Ribeiro, D. G.; Santos, S. C.; Seraphin, J. C.; Ferri, P. H.; J. Braz. Chem. Soc. 2012, 23, 1844.
4. Harley, R. M.; Atkins, S.; Budantsev, A. L.; Cantino, P. D.; Conn, B. J.; Grayer, R.; Harley, M. M.; De Kok, R.; Krestovskaja, T.; Morales, R.; Paton, A. J.; Ryding, O.; Upson, T. In The Families and Genera of Vascular Plants, vol. 7; Kubitzki, K.; Kadereit, J. W., eds.; Springer-Verlag: Berlin, 2004, ch. 11.
5. Pastore, J. F. B.; Harley, R. M.; Forrest, F.; Paton, A. J.; Van Den Berg, C.; Taxon 2011, 60, 1317; Harley, R. M.; Pastore, J. F. B.; Phytotaxa2012, 58, 1.
6. Menezes, F. S.; Borsatto, A. S.; Pereira, N. A.; Matos, F. J. A.; Kaplan, M. A. C.; Phytochemistry 1998, 48, 323; Menezes, F. S.; Silva, C. S.; Pereira, N. A.; Matos, F. J. A.; Borsatto, A. S.; Kaplan, M. A. C.; Phytother. Res. 1999, 13, 433; Pedersen, J. A.; Biochem. Syst. Ecol. 2000, 28, 229.
7. Matos, F. J. A.; Machado, M. I. L.; Craveiro, A. A.; Alencar, J. W.; Meneses, F. S.; J. Essent. Oil Res.2001, 13, 45. 8. Ruppelt, B. M.; Pereira, E. F.; Gonçalves, L. C.; Pereira, N. A.;
Mem. Inst. Oswaldo Cruz 1991, 86 (Suppl.), 2203; Castro, K. N. C.; Carvalho, A. L. O.; Almeida, A. P.; Oliveira, D. B.; Borba, H. R.; Costa, S. S.; Zingali, R. B.; Toxicon 2003, 41, 929; Magalhães, A.; Santos, G. B.; Verdam, M. C. S.; Fraporti, L.; Malheiro, A.; Lima, E. S.; Santos, M. C.; J. Ethnopharmacol.
2011, 134, 82.
9. National Institute of Standards and Technology (NIH), PC Version of the NIST/EPA/NIH Mass Spectral Database, Department of Commerce: Gaithersburg, 1998; Kubeczka, K.-H.; Formáček, V.; Essential Oils Analysis by Capillary Gas Chromatography and Carbon-13 NMR Spectroscopy, 2nd ed.; John Wiley & Sons: New York, 2002; Adams, R. P.; Identification of Essential Oil Components by Gas Chromatography/Quadrupole Mass Spectroscopy, 4th ed.; Allured Corp.: Carol Stream, 2007.
10. Dool, H. V. D.; Kratz, P. D.; J. Chromatogr.1963, 11, 463. 11. Silva, S. C.; Manual de Análises Químicas de Solos, Plantas e
Fertilizantes; Embrapa: Brasília, 1999.
12. SPAD, Portable System Data Analysis, version 5.5. International Center for Applied Statistics and Computing: Saint-Mandé, 2002.
13. Ward, J. H.; J. Am. Stat. Assoc. 1963, 58, 238; Benzécri, J. P.; L’Analyse des Données: la Taxinomie, Tome 1; Dunod: Paris, 1980.
14. SAS: Statistical Analysis System, version 6.12. SAS Institute Incorp.: Cary, NC, 1996.
15. ter Braak, C. J. F.; Šmilauer, P.; Canonical Reference Manual and User’s Guide: Software for Ordination, version 5.0. Microcomputer Power: Ithaca, NY, 2012.
16. Petrakis, P. V.; Couladis, M.; Roussis, V.; Biochem. Syst. Ecol.
2005, 33, 873.
17. Giannasi, D. E.; Crawford, D. J.; Evol. Biol. 1986, 20, 25; Croteau, R.; Chem. Rev. 1987, 87, 929.
18. Cronquist, A.; Plant Syst. Evol. 1977, 1, 179.
19. Skaltsa, H. D.; Mavrommati, A.; Constantinidis, T.; Phytochemistry2001, 57, 235; Oliveira, M. J.; Campos, I. F. P.; Oliveira, C. B. A.; Santos, M. R.; Souza, P. S.; Santos, S. C.; Seraphin, J. C.; Ferri, P. H.; Biochem. Syst. Ecol.2005, 33, 275; Bezic, N.; Samanic, I.; Dunkic, V.; Besendorfer, V.; Puizina, J.; Molecules2009, 14, 925;
20. Legendre, P.; Legendre, L.; Numerical Ecology, 2nd ed.; Elsevier Science: Amsterdam, 2003.
21. Love, A.; Naik, D.; Basak, S. K.; Babu, S.; Pathak, N.; Babu, C. R.; Chem. Biodiversity2009, 6, 2263; Kleine, S.; Muller, C.; Oecologia 2011, 166, 175.
22. Paula, J. A. M.; Paula, J. R.; Sá, F. A. S.; Tresvenzol, L. M. F.; Bara, M. T. F.; Ferri, P. H.; Biochem. Syst. Ecol.2011, 39, 643; Lyra, C. C. V. G.; Oliveira, C. B. A.; Vieira, R. F.; Santos, S. C.; Seraphin, J. C.; Ferri, P. H.; J. Braz. Chem. Soc.2008, 19, 842. 23. Duarte, A. R.; Santos, S. C.; Seraphin, J. C.; Ferri, P. H.;
J. Braz. Chem. Soc.2010, 21, 1672; Duarte, A. R.; Santos, S. C.; Seraphin, J. C.; Ferri, P. H.; J. Braz. Chem. Soc. 2012, 23, 737. 24. Costa, D. P.; Alves, E. G.; Silva, L. M. A.; Santos, S. C.; Naves, R. V.; Seraphin, J. C.; Ferri, P. H.; J. Braz. Chem. Soc.2009, 20, 1287; Costa, D. P.; Alves, E. G.; Silva, L. M. A.; Santos, S. C.; Naves, R. V.; Seraphin, J. C.; Ferri, P. H.; J. Braz. Chem. Soc.
2010, 21, 851.
25. Morone-Fortunato, I.; Montemurro, C.; Ruta, C.; Perrini, R.; Sabetta, W.; Blanco, A.; Lorusso, E.; Avato, P.; Ind. Crops Prod.2010, 32, 639; Xiang, Z.; Wang, X.; Cai, X.; Zeng, S.; Phytochem. Anal.2011, 22, 411.
26. Sanz, J.; Mus, M.; Rosselló, J.; Bot. J. Linn. Soc.2000, 132, 253; Mohan, L.; Pant, C. C.; Melkani, A. B.; Dev, V.; Nat. Prod. Commun. 2010, 5, 939.
Submitted on: March 9, 2014