The Effect of Temperature and LiClO
4
in the Water
Structure: A Raman Spectroscopy Study
Ana Maria Pereira Neto and Oswaldo Sala
Instituto de Qu´ımica, Universidade de S˜ao Paulo, C.P. 26077, 05513-970 S˜ao Paulo-SP, Brazil
Received on 10 October, 2003.
A method to obtain the components of the broad Raman band assigned to the OH stretching vibrations of liquid water was developed, by considering the subtraction of spectra at several temperatures. From these subtractions a set of six components, that we denominate “basis”, was determined corresponding to several water structures. This procedure fixes the number of components in the fitting as well as the values of the frequencies, generating a set of six gaussian bands from which the water spectrum can be calculated at any temperature. With such bands the spectrum of lithium perchlorate was calculated at several concentrations and temperatures. It was verified that the spectrum so obtained was identical to that of pure water at a higher temperature. The presence of an isosbestic point is a proof of the existence of equilibrium between the several structures. The enthalpy and entropy values were determined for the isosbestic point and for pairs of structures corresponding to the gaussian bands.
1
Introduction
Water should be a simple example of molecular structure, with three vibrational normal modes: a bending and the symmetric and anti-symmetric stretching. However its H-bonding ability results in a very complex system until now not completely elucidated [1]. The molecule has two-donation and one acceptor center, originating a network of H-bonding that is temperature dependent; for instance, at low temperature a tetrahedral structure is observed. Increas-ing the temperature some of the H-bonds are disrupt causIncreas-ing in the Raman spectra a very broad band in the OH stretching vibrations (2700-4000 cm−1)with the shape of its contour depending on the temperature.
The analysis of the Raman band contour of the ν (O-H) vibration usually employs a fit of components by least square method; nevertheless large discrepancy exists in the literature [2-5] about the number of components in the fit. In this work a method to obtain the components of this con-tour, based on the subtraction of spectra at different temper-atures, is described. A set of gaussians bands was derived, corresponding to different structures of water, which allows through a combination to reproduce the spectra of water at any temperature. Also, a combination of these gaussians can be used to reproduce the Raman spectrum of aqueous lithium perchlorate (LiClO4)solution and the spectrum so
obtained corresponds to the spectrum of water at a tempera-ture higher than that of the solution.
2
Experimental
The Raman spectra in the region of the ν(OH) stretch-ing were obtained in a Jobin Yvon U-1000 spectrometer, equipped with a RCA C31034A-02 phototube, with a res-olution of 4 cm−1. The exciting radiation was the 514.5 nm of an Ar+ Coherent Innova 90 laser, keeping the power at
400 mw.
The sample reservoir was kept in a box connected to a thermostat with temperature control of 1oC.
3
Results and Discussion
The broad band in the OH stretching region (2700-4000 cm−1)can be considered as a continuous distribution of hy-drogen bonds concerning both energetic and geometric pa-rameters. Such distribution is temperature dependent, since a typical hydrogen bond becomes weaker at higher temper-atures. Similar effects occur by the presence of eletrolytes. In the case of LiClO4the spectra is similar to those of pure
water at a higher temperature and the effect is probably en-hanced by ionic pair formation.
Figure 1 shows the effect of LiClO4concentration, at 85 oC, compared with the spectrum of water at 10oC.
explained by changes in the density and polarizability with the temperature. So, it is convenient to correct the spectra by these two factors.
Figure 1. Raman spectra of water and of LiClO4solution at the
indicated temperature and concentration.
The Raman intensity is proportional to the product of density and polarizability, I∝ρ|α|2. The water density
val-ues as a function of temperature can be found in the liter-ature [6]. Here the Raman intensity is represented by the complete integrated area under the contour in the spectra; so the “total” polarizability(|α|2)can be obtained from this
intensity: |α|2= I/ρ. The spectra can now be corrected by
multiplying for these factors to eliminate the dependence of the area with the temperature.
In Table 1 are the correction factors 1/ρand1/|α|2 for
which the spectra must be multiplied. The spectra at several temperatures without and with these corrections for density and polarizability are shown in Figs. 2 and 3, respectively.
Table 1. The correction factors 1/ρand1/|α|2as function
of temperature.
T (oC) 1/ρ[6] 1/|α|2
15 1.00090 1.00000
30 1.00437 1.01582
45 1.00983 1.03393
60 1.01707 1.05351
75 1.02581 1.07657
90 1.03594 1.09882
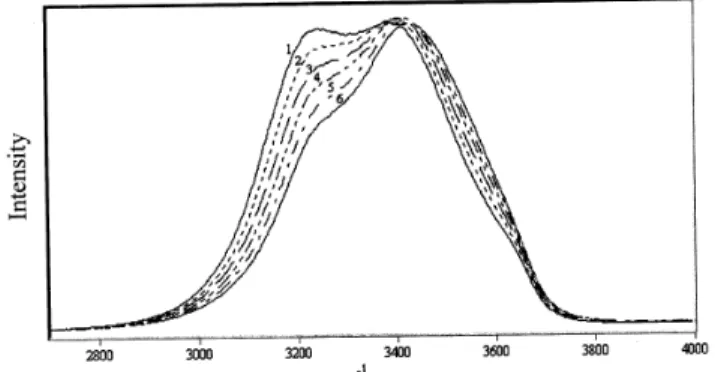
It is noticeable in Fig. 2 the decrease in the area in the region of frequencies lower than ca. 3400 cm−1 when the temperature increases. At the side of frequencies higher than this value there is an increase of the area but not in the same proportion. For the corrected spectra, show in Fig. 3, the total area remains constant, independent of the temperature. The decreasing of the area in the region under 3350 cm−1is equal to the increasing in the area after this point.
Figure 2. Water spectra without correction at the temperatures: (1) 15oC, (2) 30oC, (3) 45oC, (4) 60oC, (5) 75oC and (6) 90oC.
Figure 3. Water spectra corrected for density and polarizability, at the temperatures: (1) 15oC, (2) 30oC, (3) 45oC, (4) 60oC, (5) 75 o
C and (6) 90o
C. The isosbestic point is indicated.
The most impressive fact in the corrected spectra (Fig. 3) is the presence of an isosbestic point (3356 cm−1), which characterizes the existence of equilibrium between several structures of liquid water. As it was mentioned, it is ob-served in this figure a decrease of area at the low frequen-cies side and an increase of area at high frequenfrequen-cies side in relation to the isosbestic point. This can be rationalized con-sidering an equilibrium between structures having more H-bonding (OHbonded)and structures having less H-bonding
(OHf ree).
Once obtained the corrected spectra the method of sub-traction at different temperatures can now be considered. This can be done more easily through an example, as the one shown in Fig. 4. In this example the spectrum of water at 15
oC was subtracted from that at 90oC. The resultant shows
two peaks, at 3180 and 3555 cm−1, corresponding to partic-ular components of the “basis”. From the spectra at 15 and 30oC these same components and one more, at 3634 cm−1, were obtained. Following this procedure at other tempera-tures a set of six frequencies, at 3060, 3180, 3240, 3418, 3555 and 3634 cm−1, were obtained. For the 3060 cm−1 the subtraction was done between the spectrum of water at –2oC and that for a 4.5M LiClO
4solution at 85oC. These
bands are determined and they will be used to calculate the spectra at any temperature. An important fact is that all the half-widths of these gaussians presented the same value.
Figure 4. Resulting curve ( )of the subtraction of the water spec-tra at 15oC from the one at 90oC; the peaks at 3180 and 3555 cm−1correspond to particular components of the “basis”.
It is important to notice that the change in the shape of the contour in the spectra with the variation of temperature (Fig. 3) is only due to equilibrium condition and not to shift of frequencies; an inversion in the order of the intensities with the temperature is observed in the spectra below and after the isosbestic point.
To reproduce the spectra from the considered “basis” it
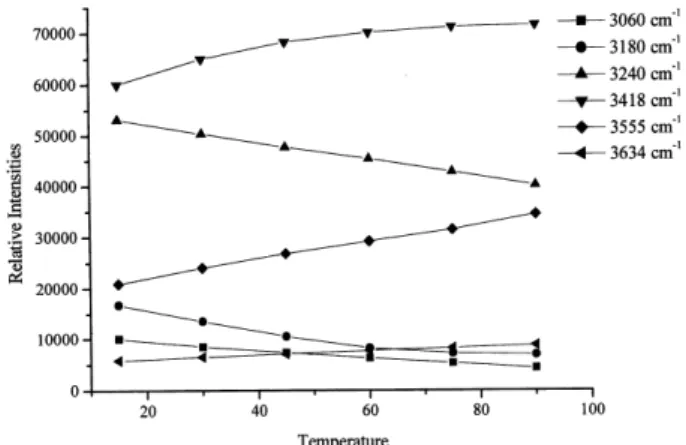
is necessary to obtain for each gaussian a plot of intensity (obtained in the fit) as function of the temperature. These curves are shown in Fig. 5 and their equations, used to obtain the intensities for each frequency of the “basis” at a given temperature, are shown in Table 2.
From the intensities (areas) of these gaussians for a given temperature the spectra at any temperature can be calculated from the sum of the gaussians.
Figure 5. Curves of intensity as a function of temperature (oC) for the six obtained gaussian bands.
Table 2. Equations for the intensities of the six obtained gaussian bands as function of the temperature (oC).
Gaussian Peak Frequencies Equations
(cm−1) (Polynomial Regression)
3060 (G1) I = 11456.60 - 105.173 T + 0.28762 T2
3180 (G2) I = 21340.80 - 324.398 T + 1.81063 T2
3240 (G3) I = 55696.10 - 180.231 T + 0.07611 T2 3418 (G4) I = 54633.70 + 409.745 T - 2.49865 T2 3555 (G5) I = 18127.00 + 198.435 T - 0.21857 T2 3634 (G6) I = 5140.60 + 45.2552 T - 0.05841 T2
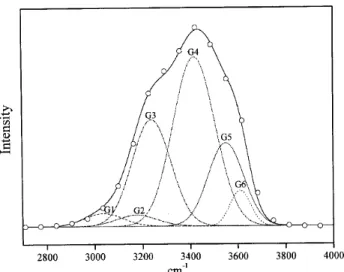
As it was mentioned before, the spectrum of LiClO4
so-lution corresponds to the spectrum of water at a higher tem-perature. As an example, in Fig. 6 the spectrum of LiClO4
solution, 1.5M at 45 oC was built with the gaussians
ob-tained from the basis for water at the temperature of 60oC.
In this way, summing these gaussians (G1+G2+. . . + G6) the resultant can be compared to the spectrum of the solution at 45oC. In Fig. 6 the experimental spectrum of LiClO
4
solu-tion 1.5M at 45oC (circle points) shows perfect coincidence
with the resultant curve built with the gaussians from water at 60oC. This means that the in this solution of LiClO4the
structure of the water as solvent corresponds to that of pure water at 60oC.
As it was already mentioned the equilibrium between the structures involving the OHbonded (corresponding to
the gaussians centred at 3060, 3180, 3240 cm−1)and the OHf ree (corresponding to the gaussians at 3418, 3555 and
3634 cm−1)with the increasing of the temperature is dis-placed to the structures in the high frequencies side, due to the breaking of H-bonding, according to the equilibrium:
1
2OHbonded⇋ 1 2OHfree
The ratios between the areas at the low frequencies side (Al)and at the high frequencies side (Ah), with respect to
the isosbestic point, were obtained. Plotting the logarithm of these ratios ln(Al/Ah) as a function of 1/T [7-9] (Fig. 7)
Figure 6. The resultant combination ( )of the gaussians obtained with the basis for water at 60oC and spectrum of LiClO4solution
1.5M at 45oC (o).
The obtained gaussians (Fig. 6) suggest that equilibrium between pairs of gaussians should be considered. The equi-librium considered for the isosbestic point could be rewritten as:
G1 +G2 +G3⇋G4 +G5 +G6
ln
(A
l
/A
h
)
0.0026 0.0028 0.0030 0.0032 0.0034 0.0036 -0.2
-0.1 0.0 0.1 0.2 0.3 0.4
∆H0 = 3,03 kcal mol-1
∆S0 = 9,81 cal mol-1 K-1
1/T
Figure 7. Plot of ln(Al/Ah)as a function of 1/T (K−1). The slope gives the∆Hoand the linear coefficient gives the∆Sovalues.
As example of the equilibrium between a pair of struc-tures involving the OHbonded and the OHfree, the
equilib-rium G1⇋G4 can be considered. The slope of the plot of
ln of the ratio of the intensities of G1 and G4, ln(IG1/IG4), as
function of 1/T gives the value of the enthalpy for this par-ticular equilibrium. The values of enthalpy calculated for the pairs of the considered structures are in Table 3. In the table the values of enthalpy are in decreasing energy order.
Table 3. Equilibrium between pairs of structures and the correspondents∆Ho(kcal.mol−1)values.
Equilibrium ∆Ho Equilibrium ∆Ho
G1⇋G4 46.34 G1⇋G2 4.67
G2⇋G4 45.21 G3⇋G4 3.56
G1⇋G5 23.58 G5⇋G6 2.37
G2⇋G5 22.52 G3⇋G5 2.24
G1⇋G3 20.88 G4⇋G5 0.62
G2⇋G3 19.44 G3⇋G6 0.52
G1⇋G6 6.56 G4⇋G6 0.19
G2⇋G6 5.76 *G1+G2+G3⇋G4+G5+G6 3.03
* Equilibrium for the isosbestic point.
The temperature variation is directly related with the structures existent in liquid water. Consequently this vari-ation affects the enthalpy values corresponding to the break-ing of H-bondbreak-ing. As is shown in Table 3, there is a co-herent sequence between the equilibrium and the calculated enthalpy values: large values of ∆Ho are related to equi-libria involving G1 and G2 with the structures in the order G4>G5>G3>G6; it follows the equilibrium G1⇋G2, G3 ⇋G4, G5⇋G6 and the lower values of∆Hofor the
equi-librium of G3 and G4 with G5 and G6.
A deeper analysis of these results may help in the under-standing of models related to the possible structures of water in condensed phases.
4
Conclusions
To avoid the incertitude existent in the literature about the number of components to be used in the fitting of the con-tour of the O-H stretching vibrations in the Raman spectra of liquid water a different method was introduced. It consid-ers a “basis” established by subtraction of spectra at differ-ent temperatures. This “basis” corresponds to predominant structures in the water and allows obtaining a set of six gaus-sians bands. With a combination of these bands it is possible to reproduce the spectra of pure water or of LiClO4solutions
at any temperature.
point was determined, indicating the existence of equilib-rium of the several structures in the water. Through area measurements in the spectra values of enthalpy and entropy were calculated at the isosbestic point and for the equilib-rium between the several structures corresponding to the ob-tained gaussians.
Acknowledgments
The authors are grateful to the Fundac¸˜ao de Amparo `a Pesquisa do Estado de S˜ao Paulo (FAPESP) for fellowships and financial support.
References
[1] A. W. Omta, M. F. Kropman, S. Woutersen, and H.J. Bakker, Science, 301, 347 (2003).
[2] G. E. Walrafen, J.Chem. Phys. 47, 114 (1967).
[3] D. M. Carey and G. M. Korenowski, J. Chem. Phys. 108, 2669 (1998).
[4] J. Schiffer, J. Chem. Phys. 50, 566 (1969).
[5] A. Sokolowska and Z. Kecki, J. Mol. Struct. 101, 113 (1983).
[6] “Handbook of Chemistry and Physics”, R.C. Weast (editor), 52ndedition, (1971).
[7] W.B. Monosmith and G.E. Walrafen, J. Chem. Phys. 81, 669 (1984).
[8] K. L. Davis, Kei-Liu K. Liu., M. Lanan, and M. D. Morris, Anal. Chem. 65, 293 (1993).