The phosphate mineral sigloite Fe
3+
Al
2
(PO
4
)
2
(OH)
3
7(H
2
O), an exception to the
paragenesis rule – A vibrational spectroscopic study
Ray L. Frost
a,⇑, Yunfei Xi
a, Ricardo Scholz
b, Fernanda Maria Belotti
c, Mauro Cândido Filho
daSchool of Chemistry, Physics and Mechanical Engineering, Science and Engineering Faculty, Queensland University of Technology, GPO Box 2434, Brisbane, Queensland 4001, Australia bGeology Department, School of Mines, Federal University of Ouro Preto, Campus Morro do Cruzeiro, Ouro Preto, MG 35400-00, Brazil
cFederal University of Itajubá, Campus Itabira, Itabira, MG 35903-087, Brazil
dMining Engineer Department, School of Mines, Federal University of Ouro Preto, Campus Morro do Cruzeiro, Ouro Preto, MG 35400-00, Brazil
h i g h l i g h t s
"We have studied the molecular structure of the phosphate mineral sigloite Fe3+Al2(PO4)2(OH)37H2O.
"Vibrational spectroscopy identifies both phosphate and hydrogen phosphate units in the sigloite structure.
"Sigloite is the exception to the rule that phosphate mineral paragenesis is related to the final phase of hydrothermal mineralization. "The observation of multiple OH bands gives credence to the non-equivalence of the OH units in the sigloite structure.
a r t i c l e
i n f o
Article history:
Received 6 September 2012
Received in revised form 3 October 2012 Accepted 5 October 2012
Available online 24 October 2012
Keywords: Raman spectroscopy Sigloite
Infrared spectroscopy Phosphate
Hydrothermal
a b s t r a c t
The secondary phosphate mineral sigloite Fe3+Al
2(PO4)2(OH)37H2O is the exception to the rule that
phos-phate mineral paragenesis is related to the final phase of hydrothermal mineralization at low tempera-tures. Sigloite was formed as an oxidation pseudomorph after paravauxite, during the last supergene paragenetic stage.
We have studied the secondary phosphate mineral sigloite Fe3+Al
2(PO4)2(OH)37H2O using vibrational
spectroscopic techniques. Because the mineral is a phosphate mineral, it is readily studied by spectro-scopic techniques as the phosphate and hydrogen phosphate units are readily measured. Indeed, sigloite shows the presence of both phosphate and hydrogen phosphate units in its structure. Raman bands at 1009 cm1with shoulders at 993 and 1039 cm1are assigned to stretching vibrations of PO3
4 and
HPO2
4 units. The Raman band at 993 cm1is assigned to them1symmetric stretching mode of the
POH units, whereas the Raman band at 1009 cm1is assigned to them1PO3
4 symmetric stretching mode.
Raman bands observed at 506, 528, 571, 596, 619 and 659 cm1are attributed to them
4out of plane
bending modes of the PO4and H2PO4units. The Raman bands at 2988, 3118 and 3357 cm1are assigned
to water stretching vibration. The series of bands at 3422, 3449, 3493, 3552 and 3615 cm1are assigned
to the OH stretching vibrations of the hydroxyl units. The observation of multiple bands gives credence to the non-equivalence of the OH units in the sigloite structure.
Ó2012 Elsevier B.V. All rights reserved.
1. Introduction
Sigloite is a rare ferric aluminum hydrous phosphate with gen-eral chemical formula given as Fe3+Al
2(PO4)2(OH)37H2O. It
crystal-lizes in the triclinic system, P-1 space group, with unit cell parameters a= 5.26, b= 10.52, c= 7.06 Å and
a
¼106580, b¼111300,c
¼69300. Sigloite belongs to the stewartite group [1]. By analogy with the mineral stewartite as described by Moore and Araki[2], the structure of sigloite consists of three
non-equiv-alent Al3+–O octahedra – Al(1), Al(2) and Al(3) linked at opposing
vertices by hydroxyl groups OH(1) and OH(2) to form corner-shar-ing chains of octahedral, parallel to [102]. PO4tetrahedra bridge
these chains to form sheets of [Al3+(OH)(H
2O)(PO4)]lcomposition
oriented parallel to {0 10}. These sheets are bridged along [0 1 0] by trans-Fe2+(H
2O)4(Op)2octahedra, where Op is the oxygen
associ-ated with the PO4tetrahedron. Sigloite was first described by
Hurl-but and Honea[3], in the Siglo XX mine, also known as Llallagua mine, Potosi department, Bolivia. The mineral occurs in open frac-tures cutting major cassiterite veins. It was found in a complex paragenesis that includes wavellite, paravauxite, metavauxite, crandallite, childrenite and other secondary phosphate. Despites the type locality, sigloite was also described in the Coon Creek
0022-2860/$ - see front matterÓ2012 Elsevier B.V. All rights reserved. http://dx.doi.org/10.1016/j.molstruc.2012.10.020
⇑Corresponding author. Tel.: +61 7 3138 2407; fax: +61 7 3138 1804. E-mail address:[email protected](R.L. Frost).
Contents lists available atSciVerse ScienceDirect
Journal of Molecular Structure
Mine (Arkansas) and in the LCA Mine (North Caroline), both in USA [4].
Ahlfeld[5,6]and Gordon[7]considered the origin of the Siglo XX mine as due to a supergene process. Later, Bandy [8] and Ahlfeld and Rayes [5] have described the phosphate mineral paragenesis is related to the final phase of hydrothermal mineralization at low temperatures however, sigloite appears to be an exception. This mineral was formed as an oxidation pseudomorph after paravauxite, during the last supergene stage.
In recent years, the application of spectroscopic techniques for the understanding the structure of phosphate minerals is increas-ing, with special attention to Al phosphates[9–12].
Farmer [13] divided the vibrational spectra of phosphates according to the presence, or absence of water and hydroxyl units. In aqueous systems, Raman spectra of phosphate oxyanions show a symmetric stretching mode (
m
1) at 938 cm1, the antisymmetricstretching mode (
m
3) at 1017 cm1, the symmetric bending mode(
m
2) at 420 cm1and them
4mode at 567 cm1[14–17]. The valuefor the
m
1 symmetric stretching vibration of PO4units asdeter-mined by infrared spectroscopy was given as 930 cm1(augelite), 940 cm1(wavellite), 970 cm1(rockbridgeite), 995 cm1 (dufré-nite) and 965 cm1 (beraunite). The position of the symmetric stretching vibration is mineral dependent and a function of the cat-ion and crystal structure. The fact that the symmetric stretching mode is observed in the infrared spectrum affirms a reduction in symmetry of the PO4units.
The value for the
m
2symmetric bending vibration of PO4units asdetermined by infrared spectroscopy was given as 438 cm1 (aug-elite), 452 cm1 (wavellite), 440 and 415 cm1 (rockbridgeite), 455, 435 and 415 cm1(dufrénite) and 470 and 450 cm1 (bera-unite). The observation of multiple bending modes provides an indication of symmetry reduction of the PO4units. This symmetry
reduction is also observed through the
m
3antisymmetric stretchingvibrations. Augelite shows infrared bands at 1205, 1155, 1079 and 1015 cm1(Frost and Weier, 2004); wavellite at 1145, 1102, 1062 and 1025 cm1; rockbridgeite at 1145, 1060 and 1030 cm1; dufré-nite at 1135, 1070 and 1032 cm1; and beraunite at 1150, 1100, 1076 and 1035 cm1.
In this work, spectroscopic investigation of a pure, monominer-al sigloite sample from the Siglo XX mine, Potosi department, Boli-via has been carried out. The analysis includes spectroscopic characterization of the structure with infrared and Raman spec-troscopy. Chemical analysis was applied to support the mineral characterization.
2. Experimental
2.1. Samples description and preparation
The sigloite sample studied in this work was collected from the Siglo XX mine (also named Llallagua), a tin deposit located in the Andes Mountain, Bustillo Province, northern of Potosi department, Bolivia. In the middle of the 20th century Siglo XX was the most productive tin mine in the world. The mine is also an important source for rare and unusual secondary phosphate minerals and is the type locality for a number of rare phosphates such as vauxite, paravauxite, metavauxite and jeanbandyite. The host rock is a con-ical subvolcanic stock of Tertiary age and the ore deposit is made up of porphyry and porphyry breccias. Hydrothermal alteration was responsible for the replacement of the primary mineralogy and the development of cericitization and tourmalinization[18].
In the Siglo XX mine, light brown to whitish sigloite aggregates of crystals up to 8.0 mm in length mainly occur in association or as pseudomorph of paravauxite. Other secondary phosphates such as wavellite, metavauxite, crandallite and childrenite also can be found in association. The sigloite sample forms part of the collec-tion of the Geology Department of the Federal University of Ouro Preto, Minas Gerais, Brazil, with sample code SAA-127. The sample was gently crushed and the associated minerals were removed un-der a stereomicroscope Leica MZ4. The sigloite sample was phase analyzed by X-ray diffraction.
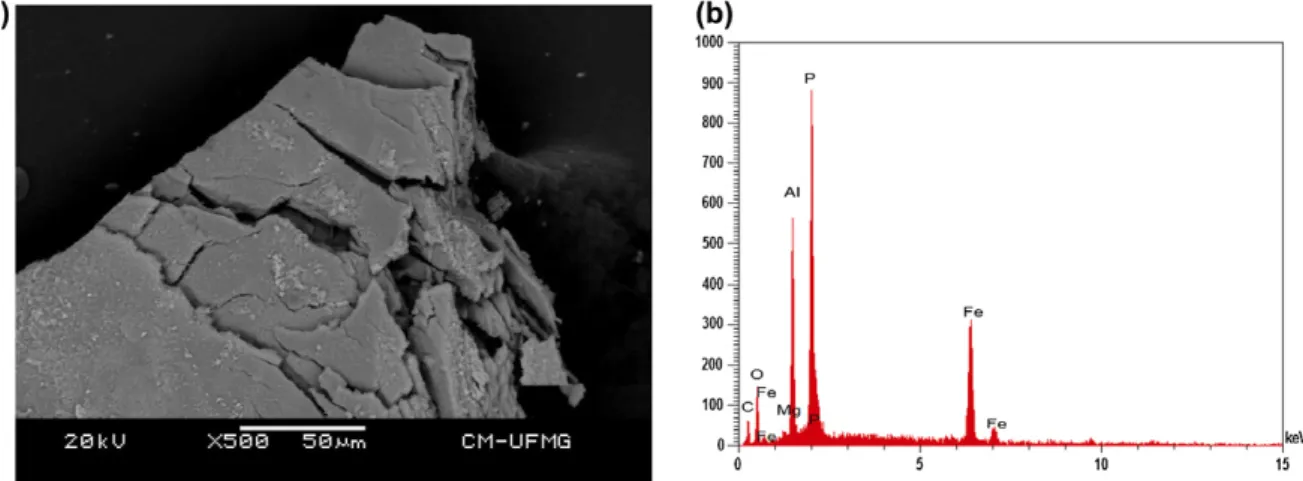
2.2. Scanning electron microscopy (SEM)
Experiments and analyses involving electron microscopy were performed in the Center of Microscopy of the Universidade Federal de Minas Gerais, Belo Horizonte, Minas Gerais, Brazil (http:// www.microscopia.ufmg.br).
Sigloite crystals were coated with a 5 nm layer of evaporated carbon. Secondary Electron and Backscattering Electron images were obtained using a JEOL JSM-6360LV equipment. Qualitative and semi-quantitative chemical analyses in the EDS mode were performed with a ThermoNORAN spectrometer model Quest and was applied to support the mineral characterization.
2.3. Raman microprobe spectroscopy
Crystals of sigloite were placed on a polished metal surface on the stage of an Olympus BHSM microscope, which is equipped with 10, 20, and 50objectives. The microscope is part of a
shaw 1000 Raman microscope system, which also includes a monochromator, a filter system and a CCD detector (1024 pixels). The Raman spectra were excited by a Spectra-Physics model 127 He–Ne laser producing highly polarized light at 633 nm and col-lected at a nominal resolution of 2 cm1 and a precision of ±1 cm1in the range between 200 and 4000 cm1. Repeated acqui-sitions on the crystals using the highest magnification (50) were accumulated to improve the signal to noise ratio of the spectra. Ra-man Spectra were calibrated using the 520.5 cm1line of a silicon wafer. The Raman spectrum of at least 10 crystals was collected to ensure the consistency of the spectra.
An image of the sigloite crystals measured is shown in the sup-plementary information as Figure S1. Clearly the crystals of sigloite are readily observed, making the Raman spectroscopic measure-ments readily obtainable.
2.4. Infrared spectroscopy
Infrared spectra were obtained using a Nicolet Nexus 870 FTIR spectrometer with a smart endurance single bounce diamond ATR cell. Spectra over the 4000–525 cm1 range were obtained by the co-addition of 128 scans with a resolution of 4 cm1and a mirror velocity of 0.6329 cm/s. Spectra were co-added to improve the signal to noise ratio. The infrared spectra are given in the sup-plementary information.
Spectral manipulation such as baseline correction/adjustment and smoothing were performed using the Spectracalc software package GRAMS (Galactic Industries Corporation, NH, USA). Band component analysis was undertaken using the Jandel ‘Peakfit’ soft-ware package that enabled the type of fitting function to be se-lected and allows specific parameters to be fixed or varied accordingly. Band fitting was done using a Lorentzian-Gaussian
cross-product function with the minimum number of component bands used for the fitting process. The Gaussian–Lorentzian ratio was maintained at values greater than 0.7 and fitting was under-taken until reproducible results were obtained with squared corre-lations ofr2greater than 0.995.
3. Results and discussion
3.1. Chemical characterization
The SEM image of sigloite sample studied in this work is shown inFig. 1. Sigloite crystal shows pinacoid form with perfect cleavage parallel to {10 0}. Qualitative chemical composition shows a pure and homogeneous Al and Fe phosphate as expected for sigloite. Traces of Mg were also observed.
3.2. Spectroscopy
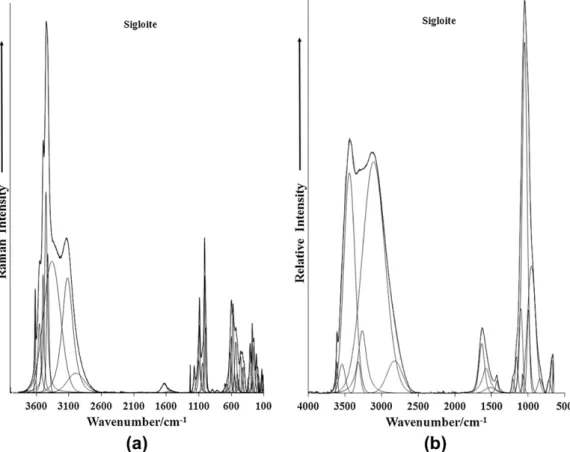
One most beneficial way of studying phosphate minerals is to undertake vibrational spectroscopy. In this was the symmetry and distortion of the phosphate units in the mineral structure can be ascertained. Further if there are different sometimes called non-equivalent phosphate units, then vibrational spectroscopy can determine if the phosphate units are identical or different. The Ra-man spectrum of sigloite over the 100–4000 cm1spectral region is displayed inFig. 2a. This figure shows the position and relative intensity of the Raman bands. It is obvious that the most intense spectral region is over the 2600–4000 cm1region. This region is where the water and OH stretching vibrations are likely to be ob-served. The overall spectrum may be subdivided into sections depending upon the type of vibration being studied. The infrared
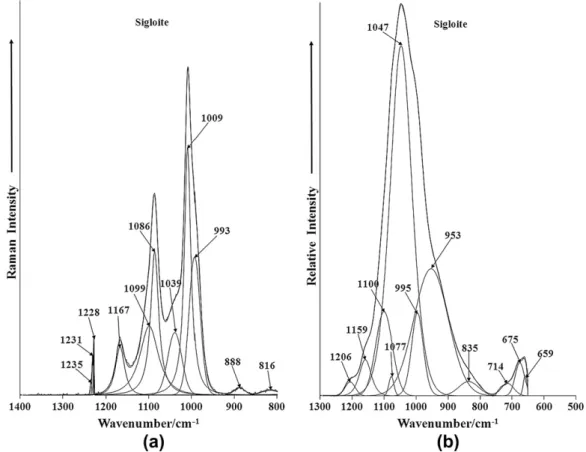
Fig. 3.(a) Raman spectrum of sigloite over the 800–1400 cm1spectral range. (b) Infrared spectrum of sigloite over the 500–1300 cm1spectral range.
spectrum over the 500–4000 cm1 spectral range is shown in Fig. 2b. As for the Raman spectrum there are spectral regions where no intensity is observed and therefore the spectrum may
be subdivided into sections depending upon the type of vibration. In the infrared spectrum strong absorption is observed in the 1000 spectral region.
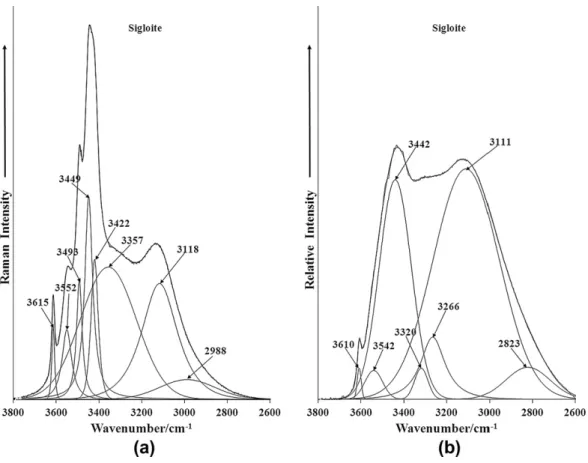
Fig. 5.(a) Raman spectrum of sigloite over the 2600–4000 cm1spectral range. (b) Infrared spectrum of sigloite over the 2600–4000 cm1spectral range.
The Raman spectrum in the 800–1400 cm1spectral range is re-ported inFig. 3a. Intense Raman bands are observed at 1009 cm1 with shoulders at 993 and 1039 cm1. These bands are assigned to PO3
4 and HPO24 stretching vibrations. The infrared spectrum of
sigloite in the 500 to 1300 cm1 spectral region is displayed in Fig. 3b. In this spectrum a very intense and somewhat broad band centered upon 1047 cm1is observed. Resolved component bands are found at 953, 1077, 1100, 1159 and 1206 cm1.
The Raman band at 993 cm1is assigned to the
m
1symmetric
stretching mode of the POH units, whereas the Raman band at 1009 cm1 is assigned to the
m
1 symmetric stretching mode of
the PO3
4 units. Galy[19]first studied the polarized Raman spectra
of the H2PO4 anion. Choi et al. reported the polarization spectra of
NaH2PO4crystals. Casciani and Condrate[20]published spectra on
brushite and monetite together with synthetic anhydrous mono-calcium phosphate (Ca(H2PO4)2), monocalcium dihydrogen
phos-phate hydrate (Ca(H2PO4)2H2O) and octacalcium phosphate
(Ca8H2(PO4)65H2O). These authors determined band assignments
for Ca(H2PO4) and reported bands at 1002 and 1011 cm1as POH
and PO stretching vibrations, respectively. The two Raman bands at 1086 and 1167 cm1are attributed to both the HOP and PO anti-symmetric stretching vibrations. Casciani and Condrate[20] tabu-lated Raman bands at 1132 and 1155 cm1 and assigned these bands to P–O symmetric and the P–O antisymmetric stretching vibrations.
The infrared spectrum displays greater complexity with multi-ple overlapping bands. The commulti-plexity of the spectrum makes it difficult to undertake band assignments. This complexity may be due to a mixture of taranakite and variscite. There is a difference between taking a Raman spectrum and an infrared spectrum. The sample spot size of the Raman spectrometer is around 1 micron. In infrared spectroscopy the measurement size is at best 30
l
m.Thus in Raman spectroscopy it is possible to collect data for a pure mineral because that crystal was selected. It is more likely that the infrared spectrum is more likely to collect data for a mixture. This is why of course it is an advantage to run the Raman spectrum.
The Raman spectra of sigloite in the 300–800 cm1and in the 100–300 cm1are displayed inFig. 4a and b. The first spectral re-gion is the rere-gion of the phosphate bending modes. This spectral region is where the PO3
4 and HOPO 2
3 -bending vibrations are
found. A series of bands are observed at 506, 528, 571, 596, 619 and 659 cm1. These bands are attributed to the
m
4out of plane
bending modes of the PO4and H2PO4units. The Raman spectrum
of crystalline NaH2PO4 shows Raman bands at 526, 546 and
618 cm1(this work). A series of bands are observed at 401, 427, 453 and 489 cm1. These bands are attributed to the
m
2PO4and
H2PO4bending modes. The Raman spectrum of NaH2PO4shows
Ra-man bands at 460 and 482 cm1. The Raman spectrum in the far wavenumber region is shown inFig. 4b. Quite intense bands are found at 112, 129, 177, 191, 214, 253 and 277 cm1. These bands may be simply described as lattice vibrations.
The Raman spectrum of the OH stretching region is reported in Fig. 5a and in comparison the infrared spectrum of sigloite is shown in Fig. 5b. The Raman spectrum may be subdivided into two parts (a) bands below 3400 cm1 and bands above 3400 cm1. The first set Raman bands are attributed to water stretching vibrations and the second set are attributed to OH stretching bands of the hydroxyl units. Thus, the Raman bands at 2988, 3118 and 3357 cm1are assigned to water stretching bands. These bands are very broad in comparison to the bands due to the hydroxyl units. The series of bands at 3422, 3449, 3493, 3552 and 3615 cm1are assigned to the OH stretching vibrations of the hy-droxyl units. The observation of multiple bands gives credence to the non-equivalence of the OH units in the sigloite structure. A comparison may be made with the infrared spectrum where broad bands are observed at 3111, 3266, 3320 and 3442 cm1, assigned
to water stretching vibrational modes. It is noted that much greater intensity of the water bands is observed in the infrared spectrum as compared with the Raman spectrum. The reason for this is that water is a very poor Raman scatterer whereas water is a very strong infrared absorber. Again in comparison the hydroxyl units show greater intensity in the Raman spectrum, whereas the inten-sity of the OH absorption in the infrared spectrum is low. The low intensity infrared band at 3610 cm1is assigned to the stretching vibration of the OH units. The Raman spectrum of sigloite in the 1400–1800 cm1 and the infrared spectrum in the 1300– 1800 cm1are shown inFig. 6a and b. This spectral region is where the water bending modes are observed. The Raman spectrum shows a reasonably strong band at 1631 cm1 assigned to the water bending mode. A similar intense band at 1632 cm1is ob-served in the infrared spectrum. Other infrared bands are found at 1426 and 1575 cm1.
4. Conclusions
Sigloite is a rare ferric aluminum hydrated phosphate with for-mula Fe3+Al
2(PO4)2(OH)37H2O and belongs to the stewartite
group. The crystals are prismatic to tabular with orange color and are transparent with a vitreous luster. The mineral was formed in a supergene stage. Sigloite was first described in the Siglo XX mine, Potosi department, Bolivia and occurs in association with other secondary phosphate minerals. The phosphate mineral para-genesis is related to the final phase of hydrothermal mineralization at low temperatures however, sigloite appears to be an exception. This mineral was formed as an oxidation pseudomorph after paravauxite, during the last supergene stage.
We have characterized the mineral sigloite using vibrational spectroscopic techniques. The mineral is characterized by an in-tense sharp Raman bands at 1009 cm1 with shoulders at 993 and 1039 cm1are assigned to stretching vibrations of PO3
4 and
HPO2
4 units. Raman band at 993 cm1is assigned to the
m
1sym-metric stretching mode of the POH units, whereas the Raman band at 1009 cm1 is assigned to the
m
1 PO34 symmetric stretching
mode. Raman bands observed at 506, 528, 571, 596, 619 and 659 cm1are attributed to the
m
4out of plane bending modes of
the PO4 and H2PO4 units. The Raman bands at 2988, 3118 and
3357 cm1are assigned to water stretching vibration. The series of bands at 3422, 3449, 3493, 3552 and 3615 cm1are assigned to the OH stretching vibrations of the hydroxyl units. The observa-tion of multiple bands gives credence to the non-equivalence of the OH units in the sigloite structure.
Acknowledgements
The financial and infra-structure support of the Discipline of Nanotechnology and Molecular Science, Science and Engineering Faculty of the Queensland University of Technology, is gratefully acknowledged. The Australian Research Council (ARC) is thanked for funding the instrumentation. The authors would like to acknowledge the Center of Microscopy at the Universidade Federal de Minas Gerais (http://www.microscopia.ufmg.br) for providing the equipment and technical support for experiments involving electron microscopy. R. Scholz thanks to FAPEMIG – Fundação de Amparo à Pesquisa do Estado de Minas Gerais, (Grant No. CRA -APQ-03998-10). M. Cândido Filho thanks to CNPq/PIBIC/UFOP.
References
[1] M.E. Back, J.A. Mandarino, Mineral. Rec. (2008). [2] P.B. Moore, A. Araki, Amer. Min. 59 (1974) 1271–1276. [3] C.S. Hurlbut, H. Honea, Amer. Min. 47 (1962) 1–8.
[5] F. Ahlfeld, J.M. Reyes, Los Minerales de Bolivia: La Paz, Bolivia, 1943. [6] F. Ahlfeld, Econ. Geol. 26 (1931) 241–257.
[7] S.G. Gordon, Proc. Acad. Natl. Sci., vol.96, Philadelphia, 1944, pp. 279–359. [8] M.C. Bandy, Miner. Llallagua, Patiño Mines and Enterprises, Inc, Bolivia, 1946. [9] L.N. Dias, M.V.B. Pinheiro, R.L. Moreira, K. Krambrock, K. Guedes, L.A.D.M. Filho,
J. Karfunkel, J. Schnellrath, R. Scholz, Amer. Min. 96 (2011) 42–52. [10] R.L. Frost, Y. Xi, J. Mol. Struct. 1010 (2012) 179–183.
[11] R.L. Frost, Y. Xi, S.J. Palmer, R.E. Pogson, Spectrochim. Acta A82 (2011) 461– 466.
[12] R.L. Frost, Y. Xi, S.J. Palmer, R.E. Pogson, Spectrochim. Acta A83 (2011) 106– 111.
[13] V.C. Farmer, Minerlogical society monograph 4: the infrared spectra mineralogical, The Mineralogical Society, London, 1974.
[14] R.L. Frost, T. Kloprogge, P.A. Williams, W. Martens, T.E. Johnson, P. Leverett, Spectrochim. Acta 58A (2002) 2861–2868.
[15] R.L. Frost, W. Martens, P.A. Williams, J.T. Kloprogge, Mineral. Mag. 66 (2002) 1063–1073.
[16] R.L. Frost, W.N. Martens, T. Kloprogge, P.A. Williams, Neues Jahrb. fuer Miner. (2002) 481–496.
[17] R.L. Frost, P.A. Williams, W. Martens, J.T. Kloprogge, P. Leverett, J. Raman Spectrosc. 33 (2002) 260–263.
[18] J. Hyrsl, A. Petrov, Mineral. Rec. 37 (2006) 117–162. [19] A. Galy, J. Phys. Rad. 12 (1951) 827–830.