A work project, presented as part of the requirements for the Award of a
Masters Degree from NOVA
–
School of Business and Economics
Achieving Better Service Level Results, through
Improvements in Procedures
Booklet 1 of 2
Tiago Gonçalo Begucho Moreira
Student Number 1259
A Project carried out on the Direct Research Internship, under the
supervision of:
Prof. Filipe Castro Soeiro
Abstract
This project aims to prepare Worten Empresas (WE) fulfilling the increasing market demand through
process changings, focusing on the Portuguese market, particularly on internal B2B clients1.
Several methods were used to measure the current service level provided - process mapping, resources
assessment, benchmark and a survey. The results were then used to compare against service level
actually desired by WE’s customer, and then to identify the performance gaps in response times and quality of the follow-up during the sales process. To bridge the identified gaps, both a set of
recommendations and an implementation plan were suggested to improve and monitor customer
experience.
This study concluded that it is possible to fulfill the increasing level of demand and at the same time
improve customer satisfaction by implementing changes at the operations level.
Key Words
Quality of service; Customer Satisfaction; Customer Loyalty; Operations Management; CRM; KPI;
Process Reengineering; SLAs.
Scope, Objective and Overarching Research Question
How can a more detailed knowledge of clients, the proposal of key performance indicators and SLAs,
improve the customer service and value (customer satisfaction, loyalty and revenues)?
In times where the work volume is increasing and there is a lack of available resources (both internal
and external), WE needs not only to keep up with the increasing demand, but also to improve the
quality of the service provided (reduce quote response and delivery times to 1 and 2 days, respectively)
and create value added for the clients, working together with its partners.
1
Identify and discuss the relevance of the Overarching Research Question
Currently, WE has few resources available and its processes are very manual and archaic in regards to
operations and customer service. As consequence, with the growing demand that WE is facing, the
level of the service provided has been decreasing and several complains and refunds occurred. This
may result in several risks, including the loss of clients, the increase of customer acquisition cost and
difficulties in maintaining satisfied and loyal clients.
These facts lead to the need of studying WE’s clients, in order to better understand their needs, as well as choosing the most adequate and necessary processes and resources to provide a superior customer
experience. Still, the main priority is to know and understand what is currently the service level
provided by WE. Only by matching these two groups of information it will be possible to overcome
the current problem.
Map and analyze the Sub research questions associated to the Overarching
Research Question and Methodologies
The main Research Question divides into three sub-research questions and respective main KPI’s: 1) What is the current level of service provided by WE? KPIs: quote request response time2– 10 days; delivery time3 5 days; Percentage of responses in customer satisfaction survey 11% very satisfied -18% unsatisfied 2) What are the desired service levels for WE? quote request response time – 1 day; delivery time 2 days; Percentage of responses in customer satisfaction survey 30% very satisfied
-5% unsatisfied 3) How can WE identify and improve these service levels? Number of measures
successfully4 implemented.
2
How long it takes since the reception of the quote request from the client until being answered 3
How long it takes since confirmation of the order by the client until be deliver 4
Figure 1 – Sub-research questions and the respective methodologies. Source: Own representation VRIO framework will be used to assess the current resources and capabilities from WE, to answer the
first question. This framework will also assess the relevant resources and capabilities from Worten5, which could also be used as a source of competitive advantage. A comprehensive data base analysis
will be conducted upon the 2013 quote request, leading to a description, at the operational level, of
processes, activities and tasks, clearly identifying the respective timings. To understand the current
level of satisfaction with the service provided, a survey will be applied to WE’s customers and feedback from WE’s manager will be collected.
In what concerns the second question, the applied survey will assess the most valuable criteria when
choosing the electrical retailing supplier, according to the different WE’s segments. This information will be integrated with the benchmark of competition regarding the same criteria, using a report done
by Reditus consultancy company.
The information gathered in the previous steps will provide both an as-is and to-be views of the
organization and its processes. Based on this, the third question will be answered through the
elaboration of a gap analysis - the starting point will be the customer’s satisfaction requirements, which will lead to a breakdown analysis so that an improvement plan can be suggested, focused on strategic,
resources/capabilities and process levels. The following diagram illustrates it.
5
The term “Worten” will be used to refer the individual customers channel, as opposed to WE, which refers to
corporate clients channel.
Worten 1. What is the current level
of service provided by WE? provides?
2. What are the desired levels of service to WE provide?
3. How can WE identify and improve these service levels?
Service provided WE Human Resources Clients VRIO
D.B. Analysis
Process Mapping
Literature Review
The impact of the quality of service in sustaining quality relationships in B2B context it is proved: the
higher is the process service capability, the higher will be the quality of the relationship between the
firm and its business clients, as well as higher is the perception from the client of the final results
obtained, higher will be the willingness to cooperate of both the firm provider of the service and the
client and therefore to adapt to each other (ZHANG Su-xian, et al 2010).
When the quality of the service is way below the one desired and perceived by the client, a radical and
dramatic change may be need to be adopt. A known tool use for this purpose is the business process
reengineering, which enables great improvements in performance cost, quality, service and speed,
through the rethinking of whole business process (Hammer, M. & Champy 1993). Nevertheless, more
recent study indicates that although there are several different approaches of this tool. These
approaches can vary from in depth and more risky changes but with more fruitful results (process
reengineering) up to superficial and secure changes with smaller impacts on organization performance
(process improvement). In the middle of both in terms of riskiness and impact of the changes is the
process re-thinking. The more radical are the changes more will be the probability of failure (BPR
present a 70% failure rate). So there is no universal approach that will successfully be executed in every
organization. (Habib, Muhammad Nauman, et al 2013).
The BPR, as the name suggests, indicates process changes. Laguna Manuel, et al 2011, presents
process management and process-oriented improvement programs to reach improvement on the
service provided by the firm. These types of programs suggest a methodology which consists in three
phases: the initializations, where it is assigned the process ownership and analyses of boundaries and
interfaces; the definition, where the process is defined and a baseline for process evaluation is
established. Laguna Manuel, et al, also presents the Cross and Associates Framework for Process
first phase an in-depth analysis of customer requirements and a review of the current process must be
done. The second phase (design) relies on the design principles that fall into 6 categories: service
quality, workflow, workspace, continuous improvements, workforce, and information technology. The
last phase involves the institutionalization of new design into the day-to-day operations.
The implementation of new process will only be effective, whenever is not possible to measure and
monitor those changes. At this point, is paramount to refer the importance in defining KPI’s based on
Critical Success Factors, “organization’s critical success factors (CSFs) should be the source of all
performance measures that really matter - the KPIs” (David Parmenter, 2013).
Brief historical overview of Sonae
The Sonae Group was founded in 1959 by the engineer Belmiro de Azevedo. Since that time Sonae
grew its business from a small industrial company to one of the biggest Portuguese groups with a very
large and diversified portfolio of companies. Currently Sonae belongs to the EFANOR group which
has three main areas: Sonae, Sonae Industria and Sonae Capital. Inside Sonae there are 6 strategic
sub-groups: Sonae MC (food retailing) and Sonae SR (Specialized Retailing) - the core businesses,
SonaeCOM and Sonae Sierra - core partnerships-, Investments Management and Sonae RP (retail
property). The size and vast range of areas where Sonae operates gives some competitive advantages
such as resources sharing, bargaining power with suppliers, unified management culture. This enabled
Sonae to become one of the biggest and more successful Portuguese business groups.
Historical framework of WE
WE is a business unit of Worten, which is an electrical retailing company created in 1996, presenting
as main business value proposition its price - illustrated by the slogan “our strength is the price”. Since its creation, Worten focused on individual customers, disregarding the huge market of corporate
clients, which have different needs to be fulfilled. With this problem in mind, in 2009 Worten creates
Worten. In 2012 WE expanded to Spain. Still, due to the smaller established network (stores and
business support), the lack of reputation of Worten and the lower investment in customer acquisition,
today’s presence of WE in Spain is insignificant when compared with the presence in Portugal. Since
its creation in 2009, WE sales volume has been increasing exponentially6. Despite being committed to its clients to offer a quality and personalized service, with tight deadlines, WE has not been able to
deliver, as the market demand increase has been highly affecting the quality of service provided.
There are some negative aspects which WE inherited from Worten. First of all, Worten positions itself
as being primarily focus on clients, but this positioning it is not totally clear, since sometimes, the cost
savings focus prevail over the customer satisfaction. The other potential improvement aspect is related
with Worten’s investments policy - new projects only receive extra resources or support from the
board after market proven. This fact may lead to some constrains in innovation and key projects can
potentially “die before they were born”.
Current Situation characterization
WE shares the same location with the Worten Contact Center, since the operations related with the
inbound and sales process are outsourced to an external firm, Reditus.
Also, a major distinction between sources of revenue needs to be taken in consideration: the exporters
and the other B2B clients7. The former, uses mainly the WE’s Commercial Manager channel, while the latter uses typically the regular WE’s channel (WE’s operation team). In 2013, WE has been able to reach successfully the exporters’ market. Still, despite these clients representing large volume of sales and release cash flow to WE (WE holds that money until delivers to the suppliers), they generate
very low profit margins. Given this situation, the current challenge is to grow in the other B2B internal
clients (clients that keep in Portugal the product bought). These clients are able to generate higher profit
margins, but demand also higher degree of complexity on services, since require capabilities to manage
6
More detailed information regarding WE’s sales evolution can be consulted in appendixes, internal data section, figure 2
7
high customer’s volume. WE’s objective is to first grow in Portugal and then apply the lessons learned to Spanish market. For these reasons, internal B2B clients in Portugal are the current focus of WE.
WE current prices are elaborated based on the Worten’s selling price, which is applied a tabulated volume discount until a certain value, after which Worten’s commercial managers are consulted. Worten is the market leader, in terms of market share, in the private segment having great brand
awareness. So, despite the low investment in promotion from WE, the internal B2B clients approach
directly or indirectly8Worten, when want to buy electronic equipment. As consequence, there is a high
volume of quote requests coming every day by the regular channel (12 new quote requests per day).
WE also manages other internal business clients, namely focusing on the Insurance sector and
Microsoft. Not only the businesses with exporters, but also the insurance projects are increasing9,
which leads WE to a potential rapid growth, facing potential lack of allocated resources, driving to poor
service (delays) and customer complaints. This lack of resources is related to human resources, IT
Resources and, manual procedures (unorganized data and information).
In order to reach concrete data related with the current situation and problems of WE, all 2000 quotes
requests sent by clients from January until September from 2013 have been reorganized and analyzed.
This data does not include the “Microsoft project” inputs, which has increased a lot the work volume
resulting in 14 claims, only coming from the Customer Ombudsman channel and several other coming
from unofficial channels. From the analyzed data it was possible to conclude the following important
facts: Only 25% of all quote requests have been accepted by the client; 91% of the rejected quote
requests didn’t answer to WE; Only 4% of all quote requests have been followed up by WE; 75% of
the clients do not send more than one quote request; Cross selling was done in 0,45% of all requests.
8 Directly –Clients approaches WE using WE’s e-mail or phone number
Indirect - Clients approach stores or customer support line who redirect to the WE.
From these results it is possible to understand that only a small percentage of quote requests are
accepted by clients (when compared with the WE established objective of 40%), also that most of the
clients are not coming back to WE and that there is a lack of follow up with clients.
Internal Analysis and Business Description
1. Value Proposition
WE value proposition intends to offers to business clients a sales channel with special conditions, that
includes competitive prices, favorable payment conditions, free transport and deliveries within 5 days
(after order’s confirmation) in mainland Portugal, electronically invoicing, after-sales support and
guarantee of confidentiality. So far it was not possible to put in place this value proposition. It was only
provided to the customers manage by a commercial manager (which are a minority), leaving all the
others to unacceptable customer waiting times. This is one of the existing gaps between what WE’s offers and what actually provides to its clients.
2. Mission and Values
WE strategic goals include fulfilling the following mission, vision and values:
Mission - To provide electrical retailing and services to corporate which help them to achieve their
goals.
WE’s Vision – Deliver the latest technology at the best prices to our customers combined with great
sales services in 2 years.
Values: “ethics and trust, people in the center of the success, ambition, innovation, social responsibility, frugality, efficiency, cooperation and independence” (www.sonae.pt).
In order to achieve these general goals and the strategic aims of improving customer satisfaction and
Inbound
•This process includes all the contacts
established by the WE's operating team with the clients.
Sales
•It includes all the activities preformed by the WE's operating team.
Logistics
•It includes activities related with
wharehousing (Sonae's warehouse) and transport of the merchandise to the customer (Total Media).
Post-Sales
Service
•Provide assistance to the products sold. This process is provide by Worten.
•WE only sends the warranty document, to the client when required by him.
Figure 2 –WE’s Value Chain. Source: Own representation
3. Main objectives
A set of main quantitative objectives10 to WE were established for the next year are. Reduction of customer
waiting times: delivery time- 2 days, quote request response time –1 day; customer satisfaction: 30% very
satisfied, 5% unsatisfied, 40% quote request acceptance, 0 claims and 40% purchase repetition; Revenues from
internal clients - $2M; . This implies a set of more qualitative initiatives, whose definition must be based on
analyses of the present situation in terms of processes and resources. This will be described in the following pages.
4. Present products and Services
WE offers a wide range of entertainment and electrical retailing goods. It has in its portfolio 6 lines of
products: large domestics, small domestics, entertainment, products related to image and sound,
informatics and telecommunications. In addition to the brands of other companies, WE also has in its
portfolio products from Worten’s own labels, which provide cheaper alternatives for clients. WE also offers the after-sales service, through the Worten channel.
5. WE’s Value Chain and Core Processes (and procedures)
The following value chain diagram reflects WE’s processes. Some of these processes are outsourced to external suppliers (in blue are processes perform by Reditus and in red ones performed by Sonae).
10
These objectives were established based on survey results and comparing with current values from Worten
C.C. – 77% C.C. – 23%
Activity name Tasks KPI Run time Flow Time SLA Quote Request (Reditus /WE)
Reception of the quote request
Check availability with commercial and stock managers
Answers to the client
New client: request to Financial Department (DSA) to create the client
Time to receive feedback from managers
Time to process and answer the quote request
24H 40 min 10 days 72 hours Client’s Creation (Sonae)
Create in the IT systems (Retek and SAP), the numbers associated to the client.
Time to create a new client in the IT systems
- 5
days
5 to 8 days
Opening of articles (Reditus/WE)
Assign the article to the client in Retek Time to assign the article to the client in Retek
10 min
24H -
Order processing (Sonae)
Stock Manager (S.M) assigns the article in the warehouse to the client
Time to request to S.M. to assigns the articles Time to S.M. assigns the
articles
5 min
1H 1H 24H
Price Marking (Reditus)
Mark up the price in Retek - 5 min 24H -
Order’s preparation (Sonae)
Warehouse’s preparation of the order to
be collected by the shipping company.
Time to prepare the order 8H
24H 24H
Delivery (Total Média)
Schedule order’s delivery with the
shipping company;
Approve/reject the shipping budgets. Delivery the order to the client
Time needed to schedule the collection
Time to deliver the order (since schedule collection)
15 min
5H
24H 24H
Invoicing (Reditus)
Extract the invoices from Retek Send the invoice to the client.
Time need to send the invoice (since the delivery of the order)
10 min 24H 24H
Total 4 days 14
days 5 Table 1 – Activities, task and respective timing of WE. Source: Own representation
To complement this value chain diagram and in order to understand the cost contribution of each group
of processes11. The cost contributions (C.C.), incurred with Inbound and Sales, cannot be differentiated, since they are paid together to Reditus. Regarding the costs contribution of the Logistics
process, it only includes the shipping costs, since the warehousing does not represent any significant
additional cost to WE. The After-Sales Service also does not implies any additional costs to WE, since
this process is provided by the Worten. The following table it will presents several activities and tasks
associated with the sales process12, as well as the respective SLA’s, flow times and run times13:
11
The details of the costs of each process can be consulted in appendixes, internal data section, table 2 12
A more detailed definition of the sales process can be consulted in appendixes, internal data section, table 3
From the above table it can be seen that the most problematic activities are the ones present in WE’s sales process, which will be the focus of analysis and respective recommendations. Two of the main
previously identified problems can be confirmed in this table: the quote response and delivery times.
Both timings are directly related with the sales process and from the customer’s point of view they are two of the most important factors when choosing the electrical retailing supplier14.
Regarding the quote request response time, WE receives on average 12 new quote requests per day,
which represents 1 quote request every 90 minutes15. Due to the operator waiting time (caused by other activities performed at the same time) the response time for each quote is on average 10 days,
despites the fact that the actual time to answer the quote request, takes on average 40 minutes . In case
of big orders16 or unavailability of the article requested by the client, the commercial manager has to be consulted in order to provide the respective discount or to suggest an alternative to the client. In this
case the time to reply needed increases from 40 m to one day. From these facts, it is possible to
conclude that the activity with the biggest flow time is the quote request, in particular its waiting time.
In what concerns the delivery time, WE currently delivers an average of two orders per day, which
represents a cycle time of four hours. Given that currently only 25% of all quote requests are accepted
by the clients, on average there are three orders17 to be delivered per day, while WE is only delivering 2 per day. The two activities with the highest impact on the delivery time (24H) and with the biggest
difference between the run time and the flow time are the opening of the article and the price marking.
Additionally, for new clients, the time to create the client impacts 5 days in the delivery time.
Answering to client’s phone calls (informative) is an activity performed by WE operating team that is not mentioned in the previous table, since the duration and the number of phone calls is completely
14
Based on survey results. More detail information regarding the most important factors when choosing the electrical retailing supplier can be consulted in the appendixes, survey results section, figure 2. 15
Assumes 8 working hours per day
16
According to a discount’s table provided by the Worten’s commercial department
17
unpredictable18 and they can occur any time during the sales process. Still, since the average time of conversation is 5 minutes, this activity has impact on the time available to work on other activities.
These activities involve several intervenient from different business units and companies, as referred in
brackets in the previous table (Sonae, Reditus, TotalMédia). Which add more phone calls and
follow-up to this WE team because they have also to make all the contacts between the different intervenient
in the process and clients. The client’s creation (DSA), the order processing (S.M.) and order’s
preparation (Warehouse) are all activities carry out by other business units from Sonae (which have
responsibilities to other internal clients besides WE. Regarding the delivery, Total Média is the
company which guarantees the transportation of the merchandise to the clients. Sonae participates in
Total Media capital structure, but does not belong directly to the group.
From the value chain and respective processes and activities analysis, it is possible to observe some of
the previously mentioned synergies between WE and Sonae, which allow cost savings for WE and
Sonae, but also generates difficulties in control and communicate among the different intervenient.
From the analysis it is also possible to identify the quote request, the client’s creation, the opening of the article, the price marking the critical activities responsible for the long costumer waiting times.
Additionally, the inexistence of a follow up activity also contributes to the lack of customer service
quality. Given these critical activities recommendations will be later suggested. Some of these
suggestions will be related with the resources and capabilities possess by WE.
6. VRIO
Before presenting any suggestion, besides the process mapping, the current resources and capabilities
from WE will be assessed using the VRIO framework, not only to identify the ones which are a source
of competitive advantage to WE, but also to describe the ones which are still in deficit. This framework
will be complemented by some additional explanation.
18
Valuable? Rare? Expensive to imitate? Exploited by the firm? Competitive implications if exploited Economic performance if exploited Capable Human
Resources Yes No No No Competitive Parity
Below Normal
Brand awareness Yes Yes Yes No
Temporary Competitive Advantage Normal Established infrastructures network
Yes Yes Yes No
Temporary Competitive
advantage
Normal
Capable IT Resources Yes No No No Competitive Parity Below Normal Simple and user
friendly procedures Yes No No No Competitive Parity
Below Normal
Diversified product
Portfolio Yes Yes Yes Yes
Sustained competitive
advantage
Above Normal Table 2 – VRIO analysis. Source: Own representation
Human Resources
Being a very youth business unit, WE until September 2013 only had 3 persons directly allocated to
the project. Just in September, the team has increased to 4 persons from Sonae and another 5 as
operators in the Contact Center. The 5 operators are responsible for managing all the administrative
work related with the sales process, covering the whole end to end process, meaning since the first
customer contact until the final product delivery to Portugal. The salary of these operators depends on
the number of working hours and the work is distribution is done by task.
Data Management
WE uses Excel to store most of the information and it doesn’t possess any BI or CRM systems. The
only IT system used by WE is the Retek system. It is a system used to, among other features, store and
access to all the data regarding the prices and stock availability of the products. This system was design
to manage the inventory and allows to associate quantities, products and its prices in relation to Sonae
stores. Typically it takes one day to associate a product to a store and one more day to register a price,
WE needs to perform this tasks every time that makes a sale, taking one day to do it delays the whole
Worten effect (Brand Awareness, Established network infrastructure and Diversified Portfolio)
Applying the concept of synergies manager19, as it was seen in the value chain and processes analysis, Sonae facilitates cooperation across the different business units and WE. This cooperation
contemplates sharing of activities and resources which results in synergetic benefits, such as scale
advantage and transferring capabilities. The scale advantage enables WE to have cost savings by
sharing Sonae’s physical infrastructures (warehouse and Worten’s stores) and human resources
(Sonae’s commercial managers). The large network of Worten’s stores (144), allows WE to reach
customers both in what regards to sales and post sales services, which is very difficult to imitate and
any competitor has such a vast network of stores all over Portugal. In terms of transferring capabilities,
WE benefits from the strong brand awareness, a vast variety of products portfolio from Worten and the
possibility of, through the Worten Resolve, providing on time assistance to WE customers. This
unique concept in Portugal, analyses and repairs (if possible) the malfunction of the products at the
time the customer delivers it.
These kind of synergies, are not present in most of competitors and are very difficult to be copied, so if
properly exploited by the firm, can be used as a sources of a competitive advantage both in terms of
costs and differentiation.
External Analysis
1. Critical Success Factors
Based in industry and market analysis, particularly the survey results (question regarding the criteria
used to choose the electrical retailing supplier), the following critical success factors were selected:
reduced waiting times (both delivery and quote request response times); offer good value for money;
increase the quality of the customer’s follow-up, provide a personalized and efficient service; Large customer base
19
Frameworkadapted from Goold, M. , A. Campbell and M. Alexander. 1994.Corporate Level
Table 3 –WE’s current customer segmentation. Source: Own representation
2. Market Analysis and Target Segment
The electronic market for companies is relatively new, being under development in a phase of
definition of boundaries, leading to lack of available data. Given these difficulties in finding objective
data regarding this market, a sensitivity analysis was elaborated in order to estimate the market value of
315 Million Euros of the electronic Portuguese market for companies20. WE currently has 6 different
target segments, which are presented in the table below. This table was elaborated, based on the survey,
working experience and the feedback received by the WE’s commercial manager:
3. Benchmark and Competitive Assessment
As well as the market analysis, also the benchmark and the competitive assessment which will be
presented below are based on data from the consultancy report from REDITUS21.
The identification of the competitors22 was based in two criteria: if the company assessed offers at least one specific condition that is only applicable to the corporate segment and if the products and services
offered are similar to the ones offered by WE.
20
The data provided was based on the consultancy report from Reditus Consulting
21Reditus Consulting, March 2013 “Apoiar a Worten na definição e operacionalização do negócio Worten Empresas”
Segments Commercial Incentives Exportation Consumption Own Own Consumption (partners)
Promotional Catalogs and
Fidelity
State
Description
Firms offer the products to other
companies
Firms resell the products outside of
the Iberian market
Firm own consumption
Sonae’s partners who use
the products for own consumption
Firms offer products to their
collaborators
State firms or public
entities
1st Criteria Quality of the Follow up Response time to a quote request Price Quality of the Post-Sales Service
Provide updated products availability
Price
2nd Criteria Range of Articles Price Quality of the Post-Sales Service
Existence of services associated to products
(assurances, etc)
Price Quote request response time
3rd Criteria Price Delivery Time Quote request response time
Possibility of credit payment
Possibility of credit payment
Delivery Time
Frequency of purchase Very often Often Punctual Punctual Very often Punctual
Size of the orders Medium Very large Small Small Very Small Small
Acceptable quote
request response time 1-2 working days Same day 1-2 working
days 1-2 working days
1-2 working days 1-2 working days Acceptable delivery
time 3-5 working days 1-2 working days
3-5 working
days 3-5 working days
6-8 working days
Figures 3 and 4: Perceptual maps of main competitors. Source: Own representation
The positioning of competition in relation to WE is analyzed by the perceptual maps regarding some of
the most relevant key customer service attributes:
To do a competitive
assessment, a comparison
between WE and its
competitors were carried
out23. It demonstrates that WE is worse or way worse than competition in terms of range of services, promotion of the B2B segment, quality of the follow-up, quote request response and delivery times. In
terms of payment conditions, range of products WE is way better than competition24.
Although the competitive assessment does not show a clear tendency regarding prices (some WE’s products are cheaper, other are more expensive than competitors), WE currently positions itself mostly
as being competing in prices. This averment is made based on the Worten’s current value proposition of competitive commercial prices, no shipping costs and favorable payment conditions. These last two
factors are related with the final cost to the client and were not taking into account in the competitive
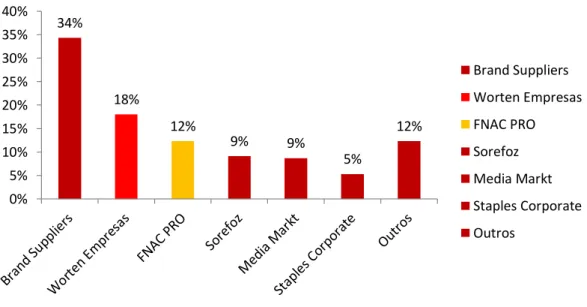
assessment. Regarding market share25, besides the suppliers who sell directly to companies, WE is the market leader, being closely followed by Fnac.
Gap Analysis
1. Based on Literature Review, Internal and External Analysis a Quantitative Data
Analysis and a set of KPI’s were proposed to support the major Gaps.
To complement the benchmark and to make a more robust gap analysis, a comparison between the
benchmark, the client’s expectations regarding an electrical retailing supplier and their perception of the current level of service provided by WE was done through a survey applied to WE’s customers. The
22
More information can be consulted in appendixes, internal data section, full list of WE’s competitors 23 The attributes were chosen by Reditus Consulting
24
More detailed information regarding the comparison of the attributes between WE and competitors can be consulted in appendixes, internal data section, figure
25
Table 4 – Gap Analysis. Source: Own representation
sample includes results from Portuguese and Spanish clients since both the geographical and cultural
aspects were not relevant for the analysis performed and the results of both countries were similar.
Discussion of the survey results26
Most of the clients approach WE through its commercial manager or by reference (51,61%). This data
supports the lack of promotional work, which is only operated by the WE’s commercial manager. In terms of general satisfaction in what regards to the WE’s services, the clients are barely satisfied, since only 11,17% of the clients rated as very satisfied the WE services27 . It can be concluded that customer satisfaction can be greatly improved. To do so, it is important to understand which factors are
more relevant to the clients, when choosing its electrical retailing supplier and compare them with the
service levels currently provided by WE, according to clients:
From the above table, it can be observed that the three most valuable criteria to customers have a low
classification in the ranking, being below their expectations. Also, when comparing with the
competition, WE is providing an equal or worse level on those key attributes. In the following three
criteria, WE is able to provide reasonable levels, but the clients does not value those that much. The
26 More detail information regarding the applied survey is available at survey section in appendixes.
27
More detailed information regarding customers’ general satisfaction can be seen in the figure 4 of the survey section in appendixes
Benchmark Surveys
Decision Criteria Comparison with competitors Ranking of importance Provided
by WE GAP
Prices Equal 1º 2,9 Aligned with
competition
Delivery Time Worse
24h-48h 2º 2,9
Below the expected
Quote request response time Worse 3º 2,9 Below the expected
Range of Products Way better 4º 3,6 Match the
expected
Possibility of Credit Payment Way better 5º Yes Match the expected
Quality of the Follow up Worse 6º 3,2 Barely match the expected Quality of the Post-Sales
Service - 6º
Provided
by Worten Not applicable
Range of Services Way worse 7º - Not available
Acceptance of tender
range of products is the same offered by Worten (individual customers), so WE can offer to its client a
vast portfolio of products without any additional cost. Regarding the possibility of credit payment, only
includes partnerships with two insurance companies, which does not implicates additional costs to WE
and given that WE performs way better than competitors, the current payment systems must be kept.
Customers are on average satisfied with the quality of the follow up, but when compared with the
competitors, WE is providing a worse quality of the follow up. This fact represents a gap that must be
considered to be improved28.
IThe last three criteria, are not provided by WE, since the post sales service is provided by Worten and WE doesn’t not provide any services or accept any tender specification. Still, these factors are less
important for the client, so there is no need at this time to dedicate additional attention to them.
Given the results presented, price, quality of the follow up, quote request response and delivery times
and, are the gaps that will be analyzed in more detail, in terms of process, strategic and resources views.
2. Processes Gap
The two most valuable criteria related with the process gap for the clients are the delivery and the quote
request response times. The delivery time involves all the WE’s activities since the order confirmation until the delivery to the client. Here, the gap is related with the defined SLA (5 working days), the
customer’s expectations and the delivery time of competition (1-2 days). Almost 30% of the customers
expect a delivery time of 1-2 working days, and 46% 3-5 working days29. To be able to reduce WE delivery time, the activities with the biggest flow times will be analyzed. The opening of the article, the
price marking, the order’s preparation and the delivery have flow times of twenty-four hours. While
the two last ones concerns to physical activities which have higher run times (highly dependent on
location and on size orders), the first two have very low run times but due to the informatics system,
28
According to the survey, around 53% of the customers consider WE’s follow up reasonable throughout the sales process
29
delays the process in forty-eight hours. So, by eliminating the waiting times of these activates the
delivery time would reduce almost two days. This measure will be discussed in the resources gap
analysis. Regarding the quote request response time, the gap is even higher. According to the survey30 91.80% of the customers expect to receive the budget to their quote request in the same day or 1-2
working days after the request, while WE is currently providing an average of 10 days of quote request
response time. The improvement measures related with these identified gaps are related with the
strategy or the resources and capabilities from WE, therefore they will be presented below, in the
respective area.
In what regards to process measures, currently there is not any process management activity in the
WE’s process. The implementation of this activity it is of the upmost importance to monitor the KPI’s
of each activity and the respective performance of the processes. This measure will be the starting point
to identify future performance gaps and proceed with continuous improvements.
The previously identified gap regarding the quality of the follow up can be improved through the
implementation of a new activity in the sales process to perform an effective follow up. This activity
contemplates contacting the client if 7 days after the budget be sent, the client does not gives any
answer, in order to understand the reasons why he didn’t accept the budget and if possible meet the requirement of the customer proceed with the order. By performing it, WE is able to not only
understand the reasons why potential clients do not proceed with the order but also increase the current
percentage of quote requests acceptance (25%) and consequently the number of orders to deliver. In
addition, the customer should be also contacted one day after the delivery, in order to understand the
customer’s selling experience with WE. This contact will transmit to the customer a greater sense of
accompaniment, reducing also the gap related with the quality of the follow up.
30
Table 5 – Segmentation model adaptation proposal. Source: Own representation
3. Strategic Gap
The prices that are being practiced by WE, according to clients and benchmark study31, does not differ a lot from the competitors. Still, this is the most valuable decision criteria to most of the WE’s clients. By understanding the different needs of the clients, WE will be capable to provide them a respective
value proposition, offering competitive prices to the segments which require it, by taking advantage of
the cost savings coming from the scale advantage and selling their own private label products, but
charging an higher price to the ones which demands lower delivery times. This way, the price to
charge would be not only variable according to the volume but also to the required delivery time. This
measure allows WE to differentiate from competition and increase customer satisfaction..
Regarding the time need to answer to the quote requests and to deliver the products, the previously
described WE segmentation model, is not being applied, since the different needs of the clients are not
influencing the way WE deals with them. Only exporters and some regular clients, who come from
WE’s commercial manager, are being prioritized. This situation results in long response times to
current and potential new clients. From this fact it is possible to conclude that the WE’s current segmentation model is not being effective. The current segmentation model can be adapted so that it
becomes more effective, according to the following table:
31
From the survey results, around 54% of the clients, consider WE’s prices, equal/indifferent from competition. The benchmark from Reditus Consulting shows an undefined tendency regarding prices.
Segments Commercial
Incentives Exportation
Own Consumption Promotional Catalogs and Fidelity Description
Buyer offers the products to other
companies
Resell the products outside of the Iberian
market
Buyer use to own consumption
Buyer offer products to their
collaborators
Price importance Important Very important Very important Important
Acceptable quote request
response time 1-2 working days Same day
1-2 working
days 1-2 working days
Acceptable Delivery
Time 3-5 working days 1-2 working days
3-5 working
days 6-8 working days
Frequency of purchase Very often Often Punctual Very often
Size of the orders Medium Very large Small Very Small
2013 Sales from WE
The objective is to reduce the number of segments, since some of the current segments have similar
customer needs. This clustering is made based on the three most important customer’s decision criteria, identified in the survey. Given the lack of information regarding the market value of the segments, the
value of WE sales is presented as an indicative value of the segment.
Given the most important needs identified to each segment, the value proposition was elaborated:
commercial incentives –to provide a vast range of affordable products in 1 week or less; exportation – to offer the most competitive price in a two days’ time or less; own consumption –to offer the most competitive price in 1 week or less; promotional catalogues and fidelity –to provide a daily updated catalogue of affordable products and deliver in two week time or less.
In order to offer a lower quote request response time and to increase the quality of the follow up, a
commercial manager must be allocate to each of the four segments. Each one will be responsible to not
only manage the most valuable clients (in terms of purchasing volume and frequency of purchase), but
also for the acquisition of new clients of their respective segments. This way, not only the most
valuable clients do WE will benefit of smaller waiting times and a more personalized service, as well
as the WE’s operator’s team would reduce its volume and therefore being capable of reduce
customer’s waiting times.
Provide a service attached to the products sold is a good way to increase the profit margin. Worten
already sell warranties extensions and insurances to its individual customers. WE’s could take advantage of these synergies with the individual segment and start also selling these two services, since
the additional costs to provide them are minimum and are services which customers value (26% of the
surveyed customers would like to use these two services). Beside these two services, when asked to
suggest services that they would like to buy, customers mentioned maintenance (19%), installation
require additional significant investment, a cost-benefit analysis should be done afterwards to assess the
implementation of each service.
4. Resources and Competences Gap
Regarding the human resources, each member of WE operation’s team, would become responsible for the whole selling process per customer, except the supervisor. Also, the remuneration of the team
should be changed to a fixed base payment plus a variable component, which will depend both on the
quote request response time and number of deliveries. These two measures will create an incentive to
operators not only reduce the quote request response time, which is currently on 10 days while
customers accept 1-2 two days, but also to increase the number of deliveries per day, currently on two
while the current outflow rate is three. In addition, once is the same operator to do the entire follow up
of the customer’s order a more personalize service is provide.
Regarding IT resources, as seen in the process gap, the current IT merchandise system (Retek) which
contains all the information regarding the products to be sold (stock, prices) used by WE, was not
design to process quickly new clients and prices. This way this system must be redesign or a new one
should be adopted, in order to eliminate the current 48H flow times of the opening of article and price
marking activities, reducing the delivery time in two days. Assuming that these two activities will still
be need to be performed, the adoption of a new IT merchandise system would not implicate major
process changes but implies training to WE’s operating team on it.
In order to deal with the large amount of data and to better know its clients, WE should implement a
CRM system. This measure enables WE to offer a more personalized service, according to the real
needs of the customers. In addition, it may result in an additional source of revenues, coming from
cross selling.
Not only to deal with the large amount of data related with the quote requests, but also to reduce its
Table 6 – Implementation plan. Source: Own representation
submit its quote requests directly through the website, filling in the designated fields, including the
company’s detail information, the reference and description of the article and number of units. This
information would be directly integrated with the IT merchandising platform, which would directly
check the stock availability and the respective price, according to the tabulated prices and respective
segment. Alternatively, the client can still contact WE through e-mail, knowing in advance that the
response time would be larger.
Still related with the IT resources, WE must implement a platform to easily establish direct contact
between the WE operation’s team and the other intervenient in the sales process (Sonae’s commercial
and stock managers, logistics and DSA), enabling communications and data sharing, in an easy and
quick way. This measure reduces the current delivery time 1 day, therefore increasing the number of
deliveries per day, through reducing the current twenty-four hours response times of the both
commercial and stock managers.
Implementation Plan
32Objectives33 KPI Target Initiative
Increase the quality of the
customer’s follow-up
-Percentage of responses in customer satisfaction survey
-30% very satisfied -5% unsatisfied -0 claims;
-40% quote request acceptance
- 40 % purchase repetition
-Adapt segmentation model -Implement a CRM
-Implement a formal follow up moments
Reduce the quote request response time
-Customer waiting time
-Response time from the different
intervenient in the process
-1 day
-1 hour
-Adapt segmentation model -Organize work per client with variable wage per order delivered. -IT communication and data exchange platform
-Creation of WE website
Offer good value for money
-Revenues coming from new services
-Cross-Selling Sales
-100K
-100K
-Implement new services -Implement a CRM
Reduced delivery time and increase its number
-Time to deliver the order
-Number of daily deliveries
-2 days
-3
-Implementation of a new IT merchandising system -Organize work per client with variable wage per order delivered Develop the management
processes
-Number of implemented improvement initiatives
-100% of the proposed initiatives
-Create a process management activity
32
Based on the Harvard K&N Southwest Airlines example
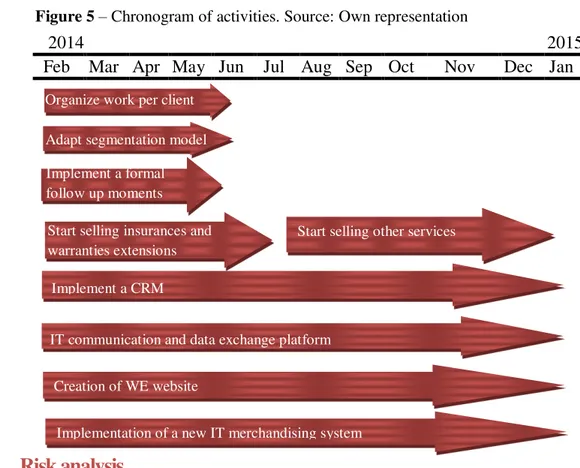
Figure 5 – Chronogram of activities. Source: Own representation
2014 2015
Feb Mar Apr May Jun Jul Aug Sep Oct Nov Dec Jan
Risk analysis
The scope and depth of required changes, implies a high risk34 of not being possible to effectively implement the changes, jeopardizing the targeted results. It can be minimized by elaborating a detailed
plan and a roadmap to each of the proposed changes.
There is a moderate risk, that the Sonae’s board does not give enough funding to invest in the proposed measures, given the large investment need for implement them. To diminish it, the benefits of these
measures (the improvement on the service provided), must be clearly demonstrate. In order to do this
the WE’s exponential sales growth and the predicted upcoming clients (such as the insurance companies) can be also used to prove to the board the necessity of investing in this changes to be able
to keep up with demand.
34
The risks are classified as high, medium or low according to its probability and impact of occurrence.
Creation of WE website
Implementation of a new IT merchandising system
Training on excel and datamanagement. Organize work per client
IT communication and data exchange platform
Start selling other services
Implement a CRM Implement a formal follow up moments Adapt segmentation model
Conclusions and Recommendations
The present thesis presented an overall view of initiatives that will drive WE to another platform of
success. It has been described not only the actual action to be taken, but also management process
which should be incorporated by the business unit as an ongoing way to produce improvements and
monitor quality to the clients.
The gap analysis proved to be a very strong tool, regarding the concrete situation of WE. The proof is
that both the process mapping and the survey results showed gaps in terms of quote request response
time with an average of 10 days, while 92% of the surveyed customers require it in the same day or up
to two days. This gap can be reduced to 2 days by adapting the current segmentation model, change the
WE operating team work organization and the implementation of an IT communication platform,
according to what was described in the gap analysis section. Furthermore, a new WE website
connected with the IT merchandise system, would allow the quote request to be answered in few
minutes for the clients who decide to use it. Regarding the delivery time gap, 75% of the customers
consider the time very slow, slow or reasonable and the competitors are offering an average delivery
time of 1-2 days, which indicates that the current delivery time of 5 days is not acceptable. To decrease
the delivery time in two days, the current IT merchandise system (Retek) should redesign or a new one
should be adopted, so that the changes performed in the systems would be immediately effective.
Besides the customer waiting times, the quality of the follow up is also a relevant decision criteria that
Worten must be capable to improve in the next year. It can be done by adapting the current
segmentation model, implementing a formal follow moments and CRM system, according to the
implementation plan.
It is required an additional investment by WE to keep up with the increasing demand. The main
outcomes of this change project included quote requests in 1 day, delivering the orders in 2 days and
experience and, therefore, differentiate from the competitors, who are already ahead of WE in many
fields.
Bibliographic References
-Kotler, Philip, Kevin L. Keller, Mairead Brady, Malcom Goodman and Torben
Hansen.2012.Principles of Marketing. New Jersey: Prentice Hall Europe
-Kumar, V. and Werner J.Reinartz. 2005. CustomerRelationship Management: A
DatabasedApproach. UnitedStates of America:JohnWiley&Sons, Inc.
-Foss, Nicolai J. 1997.”A Resource-Based View of a firm.” InResources, firms and strategies. New York: Oxford UniversityPress
-Laguna, Manuel and Johan Marklund. 2011.”Process Management and Process-Oriented Improvement
Programs” In Business Process Modeling, Simulation and Design.New Dehli: Pearson Education.
-Zhang, Su-xian, Qin Su, Yong-tao Song and Yan-wu Cui.2010.“An Empirical Study on the Service
Quality’s Impacts on Relationship Quality in B2B Context”International Conference on Management
Science & Engineering.
-Habib, Muhammad Nauman, Dr. Attaullah Shah, “Business Process Reengineering: Literature Review of Approaches and Applications” Proceedings of 3rd Asia-Pacific Business Research. -Parmenter, David. 2013.“Setting KPIs that genuinely support corporate strategy” Institute of Chartered Accountants
-O’Riordan, Chris 2006.“The VRIO framework in practicing firms taking the resource-based view”,
Institute of Chartered Accountants
-Keller, Paulette J. and J. Mike Jacka. 1999.“Process Mapping”, Internal Auditor -Britten, Eric. 2011.“Measure Your Way to Success”,Alaska Business Monthly
-Strategic Management Insight.2013.Strategic Management
-Worten.2013.Worten. www.worten.pt (accessed 16th September, 2013)
A work project, presented as part of the requirements for the Award of a
Masters Degree from NOVA
–
School of Business and Economics
Achieving Better Service Level Results, through
Improvements in Procedures
Booklet 2 of 2
Tiago Gonçalo Begucho Moreira
Student Number 1259
A Project carried out on the Direct Research Internship, under the
supervision of:
Prof. Filipe Castro Soeiro
Appendix
Internal data
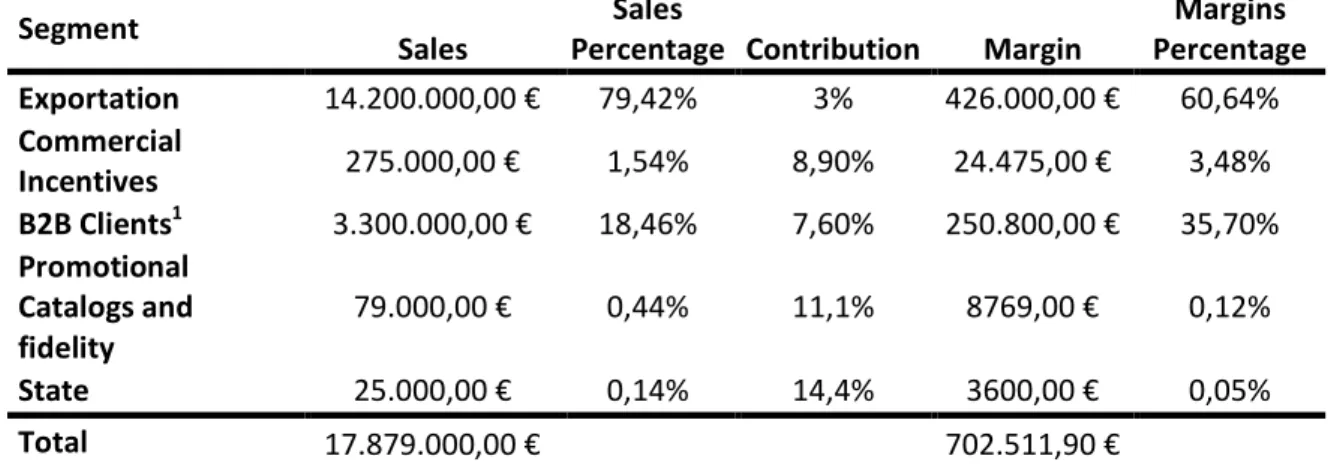
Table 1 – Revenues and Profit Margin from WE per segment. Source: Internal data from Worten
Segment
Sales
Sales
Percentage Contribution Margin
Margins Percentage
Exportation 14.200.000,00 € 79,42% 3% 426.000,00 € 60,64%
Commercial
Incentives 275.000,00 € 1,54% 8,90% 24.475,00 € 3,48%
B2B Clients1 3.300.000,00 € 18,46% 7,60% 250.800,00 € 35,70%
Promotional Catalogs and fidelity
79.000,00 € 0,44% 11,1% 8769,00 € 0,12%
State 25.000,00 € 0,14% 14,4% 3600,00 € 0,05%
Total 17.879.000,00 € 702.511,90 €
Figure 1 –Distribution of WE’s customer segments. Source: Own representation
Table 2 – 2013 WE costs per process. Source: Internal data from Worten
Inbound
and sales Logistics
Post-Sales Service
Costs with Reditus 46 625,00 € - -
WE commercial manager salary 20 000,00 € - -
Shipping Costs - 19.778,18 € -
Total Cost 66.625,00 € 19.778,18 € -
Percentage Costs 77,11% 22,89% -
1
The B2B clients include the own consumption and own consumption (partners) and the sales from the Microsoft Project, being the last one the most significant
3,67% 4,49% 2,04%
67,35% 3,67%
16,33%
WE's segments
Exportation
State
Own Consumption (partners)
Own Consumption
Promotional Catalogs and Fidelity
Figure 2 – Evolution of WE Sales. Source: Internal data from Worten
Figure 3 – Portuguese B2B Electrical Retailing market shares. Source: Internal data from Worten
Table 3 –Detailed description of WE’s sales process. Source: Own representation
Objective Business Risks: Key Controls: Event
Beginning: Event Ending Process: Deliver the products in the in 5 days after the
client’s
order.
Nature of the B2B clients:
- Knowledgeable and demanding clients - Constantly comparing
alternatives
Switching costs are very low.
Time to respond to the quote request
Time to deliver the product
Number of customer re-buying
Revenues
Customer Satisfaction
Reception of the quote request
Delivery of the order and invoice submission
153 709,76 € 532 415,77 € 369 845,55 €1 743 527,11 €
17 879 000,00 €
0,00 € 5 000 000,00 € 10 000 000,00 € 15 000 000,00 € 20 000 000,00 €
2009 2010 2011 2012 2013
provisional
WE Sales
34%
18%
12%
9% 9%
5% 12% 0% 5% 10% 15% 20% 25% 30% 35% 40%
B2B Market Share
Label – From way better to way worse:
*The classification from Reditus’ report was updated, since it was assumed a quote request
response time of 24h-48h, when currently WE provides an average of 10 days.
Full list of WE’s Portuguese competitors (from Reditus’ report):
Fnac Pro, Staple Corporate, Makro, Chip7 Empresas, Sorefoz, Pixamania Pro, Media Market, Rádio
Popular, Box, El Corte Ingles e Amazon.
Survey
Survey Questions
The survey sample contemplates 62 WE’s customers, 41 from Portugal and 21 from Spain, representing around 20% of the population.
1. In the last year, what is the approximate amount spent on electrical retailing
items, regardless of the supplier?
2. List, in order of importance, what factors are most important in choosing your
provider:
3. Where did you have knowledge of the Worten Empresas channel?
4. What is your level of satisfaction with the services provided by WE?
5. How do you rate the range of products provided by WE?
6. When comparing with other suppliers, do you consider WE's prices:
7. What is your expectation regarding the response time to a quote request?
8. How do you assess the response times of WE to their requests for quotations?
9. What is, for you, the acceptable delivery time of an order (from the date of its
confirmation)?
10.How do you assess the delivery times of WE?
11.How do you assess the follow up provided by WE throughout the sales process?
12.What kind of items is not available by WE but you would be interested if it
were?
13.What kind of services would you like to be provided by WE?
Survey Results
Figure 1
0 5 10 15 20 25
< 2 000 2 001 - 5 000 5 001- 25 000 > 25 000
Companies
Euros
Figure 2
Figure 3
Electrical retailing supplier criteria ranking
Call Center Store Commercial Manager
By reference Internet Same Economical
Group
Figure 4
Figure 5
Figure 6
Very unsatisfied Unsatisfied Satisfied Very Satisfied
Level of satisfaction with service
provided by WE
0 5 10 15 20 25 30 35 40
Very poor Poor Reasonable Good Excelent
WE's range of products
Way Below the average
Below the average
Equal/indiferent Above the average
Way above the avergare
Figure 7
Figure 8
Figure 9
In the same day 1-2 working days 3-5 working days More than 5 working days
Expected response time to quote
request
Very Slow Slow Reasonable Fast Very Fast
WE's response time to quote
requests
1-2 working days 3-5 working days 6 - 8 Working days More than 8 working days
Figure 10
Figure 11
Very Slow Slow Reasonable Fast Very Fast
WE's delivery time
Very unsatisfied Unsatisfied Reasonable Satisfied Very Satisfied
Figure 12
Figure 13
Electronic Business Economato Office Furniture