INTRODUCTION
The role of sulfur in the Portland cement industry has been extensively investigated in the last decades, because of its major effects in all stages of the cement life-cycle, from clinker mineralogy, through cement performance up to
concrete degradation. The sources of sulfur in the context of cement production are raw materials and fuels, particularly pet coke, in which the sulfur content may reach up to 6wt.% [1]. Sulfur may be present in the raw materials as sulfi des, mainly the iron sulfi de pyrite, which is likely to increase sulfur emmissions, since sulfur volatility largely depends on
Effect of sulfur on the polymorphism and reactivity of
dicalcium silicate of Portland clinker
(Efeito do enxofre no polimor
fi
smo e reatividade do
silicato dicálcico do clínquer Portland)
F. R. D. Andrade1, S. D. Gomes2, M. Pecchio3, Y. Kihara1,3, F. M. S. Carvalho1, J. R. Matos4
1Departamento de Mineralogia e Geotectônica, Instituto de Geociências, Universidade de S. Paulo, Rua do
Lago 562 S. Paulo, SP 05508-900
2Rua Sta. Maria Itabira 100/01, Belo Horizonte, MG 30310-600
3Associação Brasileira de Cimento Portland, Av. Torres de Oliveira 76, S. Paulo, SP 05347-902
4Departamento de Química Fundamental, Instituto de Química, Universidade de S. Paulo, Av. Prof. Lineu
Prestes 748, S. Paulo, SP 05508-000 [email protected]
Abstract
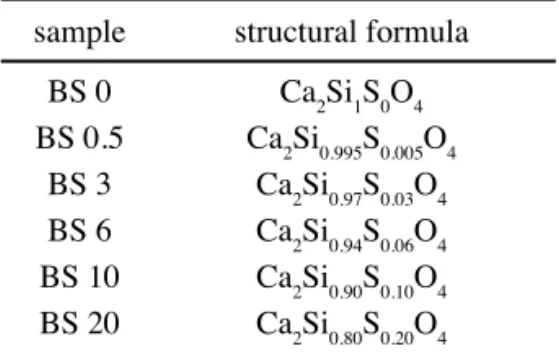
The present study regards the effect of sulfur in dicalcium silicate (Ca2SiO4), a major crystalline phase (20 to 40 wt.%) of the ordinary Portland cement clinker. Dicalcium silicate is also known as C2S (2CaO.SiO2) or belite. The synthesis of the C2S samples was made with high purity reactants with addition of sulfur as CaSO4.2H2O, mixed according to the stoichiometric proportion 2Ca:(1-x)Si:xS, in which x corresponds to the cationic proportion of sulfur, with values ranging from 0 to 20%. Added amounts of SO3 in the samples
were 0.23, 1.39, 2.77, 4.60 and 9.71wt.%. Chemical composition of the samples was determined by X-ray fl uorescence before and after sintering. Large-scale sulfur loss by volatilization leads to an excess in calcium and consequently to formation of increasing amounts of tricalcium silicate with increasing sulfur content in the starting mixture. Mineralogical composition of the samples and cell parameters of C2S polymorphs were determined by X-ray diffraction and Rietveld refi nements. Structural analysis of diffraction data indicates that the presence of sulfur stabilizes the intermediate temperature polymorph β C2S, with increasing unit cell volume.
The reactivity with water (heat of hydration) of the samples was measured by differential scanning calorimetry, which was strongly infl uenced by the highly reactive tricalcium silicate.
Keywords: dicalcium silicate, Portland clinker, sulfur, polymorphism, XRD-Rietveld, DSC calorimetry.
Resumo
Este estudo trata do efeito do enxofre no silicato de dicálcio (Ca2SiO4), uma fase cristalina majoritária (20 a 40 peso%) do clínquer do cimento Portland comum. O silicato de dicálcio é também conhecido como C2S (2CaO.SiO2) ou belita. A síntese de amostras de C2S foi feita a partir de reagentes de alta pureza com adição de enxofre como CaSO4.2H2O, misturados na proporção estequiométrica 2Ca:(1-x)Si:xS, na qual x corresponde à proporção catiônica de enxofre, com valores de 0 a 20%. Os teores adicionados de SO3 nas amostras foram 0,23, 1,39, 2,77, 4,60 e 9,71 peso%. A composição química das amostras foi determinada por meio de fl uorescência de raios X antes e após sinterização. A perda por volatilização em alta escala de enxofre levou a um excesso de cálcio e conseqüentemente à formação crescente de silicato de tricálcio com aumento crescente de enxofre na mistura inicial. A composição mineralógica das amostras e os parâmetros de rede dos polimorfos de C2S foram determinados por difração de raios X e refi namento de Rietveld. A análise estrutural dos resultados de difração indica que a presença de enxofre estabiliza a forma de temperatura intermediária β C2S, com aumento crescente do volume da célula unitária. A reatividade com água (calor de hidratação) das amostras foi medido por calorimetria diferencial de varredura, que foi fortemente infl uenciado pela alta reatividade do silicato de tricálcio.
its oxidation state, and sulfi des are considered to be more volatile than sulfates [2].
Among the main crystalline phases of clinker, dicalcium silicate (Ca2SiO4) has the higher capacity of sulfur incorporation [3]. In the presence of alkalis, sulfur preferentially forms alkali sulfates such as arcanite (K2SO4), ca-langbeinite (K2Ca2(SO4)3) and aphititalite (K3Na(SO4)2) [4]. In the presence of sulfur, the relative proportion of dicalcium silicate in clinker increases, with respective decrease in tricalcium silicate abundance, which tends to form larger crystals [5]. These changes in texture and phase relations of Portland clinker lead to lowering in grindability and delaying in setting time.
Sulfur is also added at the fi nal stage of Portland cement production, when the clinker pellets are grinded together with ca. 5 wt.% of gypsum (CaSO4.2H2O), which retard the hydration reactions that eventually lead to cement setting (hardening). Sulfur may also be related to concrete degradation, in a process known as sulfate attack. An extensive review on the subject is given [6]. Although the topic is still under debate, sulfate attack is likely to be related to external sources of sulfur, and not by the relatively small amount of the element present in the cement [3].
In the following text, the abbreviated forms of clinker phases are used: C = CaO, S = SiO2, A = Al2O3 and F = Fe2O3. Dicalcium silicate (2CaO.SiO2) will be referred from now on as C2S, and tricalcium silicate (3CaO.SiO2) as C3S. Hydrated calcium silicates are referred to as CSH (CaO. SiO2.nH2O). Further effects of sulfur on clinker mineralogy comprise polymorphism of dicalcium silicate and, threfore, its reactivity with water [7]. C2S has fi ve polymorphs: γ, β, αL, αH and α, in order of stability at increasing temperature [8-10]. Polymorphic transformations of C2S are of interest in cement industry, because the polymorphs of higher temperature, which are more reactive with water, may be stabilized by the incorporation of minor elements [11, 12] or thermal treatment [13]. Increasing reactivity of C2S is a relevant issue in large-scale production of C2S-rich cements [14, 15], which is a low-energy and low-emission option to ordinary portland cement, that is mainly composed by C3S, the most reactive calcium silicate in clinker. The polimorph β C2S predominates in ordinary portland cement and has a rather slow hydration kinetic, leading to lower mechanical strength at early ages [7].
This paper presents experimental results on the effects of sulfur in polymorphic transformation and hydraulic reactivity of C2S in the presence of sulfur.
MATERIALS AND METHODS
Six samples were produced by sintering mixtures of the following high purity reactants: CaCO3 99.0% Merck; CaSO4.2H2O 99.0% Merck; silica gel SiO2.xH2O 99.99% Vetec, with 9.1wt.% loss on ignition at 1000 oC. Stoichiometry of the starting mixtures was set according to 2Ca:(1-x)Si:xS, where x varied between 0 and 2 (Table I), considering the substitution of S for Si in the tetrahedral structutral site of
the silicate (see Discussion). Reactants were homogenized in tungsten carbide vibratory mill and sintered in platinum crucibles under oxidant conditions in a chamber furnace. In the fi rst step, samples were calcined at 900 oC, ground for 20 s, and pressed in a hydraulic press under 39 MPa (20.000 kg on a 40 mm diameter disc). In the second step, samples were sintered at 1450 oC for 6 h, with two intermediate milling and pressing steps, according to the procedures described [12]. After sintering, samples were immediately cooled with air, in order to preserve high temperature crystalline phases. After cooling to room temperature, samples were ground in a tungsten carbide vibratory disk mill for 20 s and split in aliquots for further analysis.
X-ray powder diffraction (XRD) was carried out in a
Rigaku RINT2000 equipment with Cukα radiation, 40 kV,
30 mA, step scanning mode (0.01o/step, 10 s/step) from
18to 90o 2θ. Samples were front loaded in fl at sample
holders. Instrumental contribution to peak broadening
was assessed with a cerium oxide (CeO2) standard [16].
Rietveld refi nements were carried out in GSAS [17] with the graphic user interface EXPGUI [18]. The crystallographic
informations fi les (CIF) for C2S polymorphs were taken
from [9] and for triclinic C3S from [19]. Rietveld refi nement strategy was based on [20, 21] and Paiva-Santos (personal
communication), comprising background fi tting with the
shifted Chebyschev function (10 terms), cell parameters, scale factors for individual phases, peak displacement (shift), surface roughness correction, isotropic atomic displacement
parameter (Uiso), pseudo-Voigt function of peak profi le
(GSAS #4) and spherical harmonic preferential orientation for all phases.
Differential scanning calorimetry (DSC) was analyzed in
a Shimadzu DSC50 calorimeter with aluminum crucibles,
with constant rate of temperature increase (10 oC/min) from
room temperature to 500 oC, in a dynamic atmosphere of
nitrogen fl ow (50 mL/min). Samples were ground down to
> 0.045 mm and their grain-size was controlled by sieving. An amount of 5 g of each sample was mixed in distilled water in a water/sample mass ratio of 0.4 and stored at 40 oC for 80 h to achieve full hydration and formation of
portlandite (Ca(OH)2) and hydrated calcium silicates (CSH).
Table I - Predicted stoichiometric proportion of the raw mixtures.
[Tabela I - Proporção estequiométrica prevista para as misturas cruas.]
sample structural formula
BS 0 Ca2Si1S0O4 BS 0.5 Ca2Si0.995S0.005O4
After hydration, samples were milled and dried at 200 oC
for 24 h. An 8 mg aliquot from each sample was used for DSC analysis. This reverse calorimetric analysis measures the amount of heat absorbed by the sample to transform the hydrated phases back in the anhydrous Ca-silicates, i.e., the more reactive samples form more CSH and portlandite and, therefore, absorb more heat in their dehydration.
Chemical analyses were made in a Rigaku - RIX 2000 X-ray fl uorescence (XRF) equipment, with tube conditions of 50 kV and 50 mA, in samples prepared as fused glass discs. Calibration was made with seven standard cements from the National Institute of Standards and Technology (NIST) and two from the Instituto de Pesquisas Tecnológicas, S. Paulo, Brazil (IPT). Sulfur loss was controlled by chemical analysis of raw mixtures and sintered samples.
RESULTS AND DISCUSSION
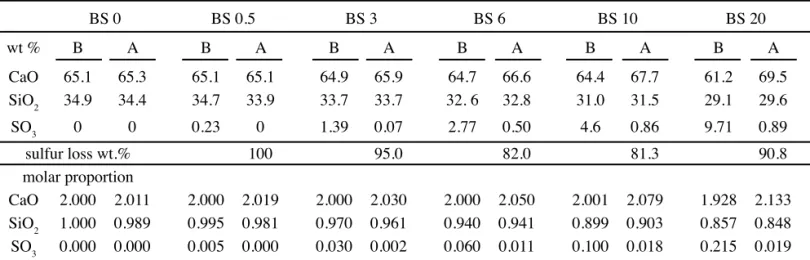
Chemical composition of the samples before and after sintering is presented in Table II. Actual chemical composition of raw mixtures determined by XRF is very close to the predicted stoichimetric proportions established in Table I. It indicates that there was no sulfur loss until 1000 oC, the temperature in which the glass discs were prepared for XRF analysis.
After sintering at 1450 oC, the expected stoichiometry of the samples (Table I) was not achieved, due to extreme sulfur loss by volatilization (between 80 and 100 wt.%), leading to a relative excess in CaO in respect to the (SO3+SiO4) and to C3S formation.
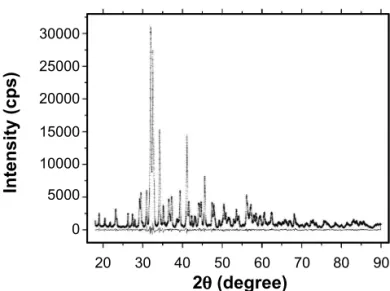
Progressive changes in composition may be seen by comparing diffractograms of all samples (Fig. 1). The main diffraction peak of the three phases (γ C2S, β C2S, C3S tcl) overlap between 31.9 and 32.0o 2θ (Cukα) and, therefore, the mineralogical changes are present in the secondary peaks
indicated in the lower part of the diffractogram.
A good adjustment was achieved between observed diffractograms and calculated models, as indicated by the difference line in Rietveld plots (Fig. 2) and by the low values of statistical residues of the Rietveld refi nements (Table III). Modal composition obtained by XRD-Rietveld is presented in Fig. 3 and Table III. The increase in the amount of sulfur in the raw mixture leads to a decrease of γ C2S and to a respective increase in the β C2S. Stabilization of β C2S by sulfur has been previously described [7]. The stable polymorph at lowest temperature, γ C2S, is undesired in Portland clinker, because of its lower reactivity with water. Additionally, the polymorphic transition from β to γ C2S leads to an increase in the molar volume of the silicate, which may cause an effect known as dusting, a process in which the clinker turns spontaneously into powder while cooling [22].
Sulfur loss is probably related to the sequence of thermal decomposition of the reactants with increasing temperature. Thermal decomposition of CaCO3 takes place in a wide range of temperature, from 660 to 900 oC, and is strongly controlled by the partial pressure of CO2 [23-25]. Calcium sulfate dihydrate (CaSO4.2H2O) undergoes stepwise thermal decomposition, with progressive loss of water from 60 to 450 oC [26]. Increasing temperature leads to formation of hemihydrate and other intermediate hydrated compounds before total dehydration. Anhydrous calcium sulfate remains stable until 1380 oC, where melting occurs [27]. In the present study, high purity silica gel was used, which is a non-crystalline, reactive form of silica. Therefore, calcium oxide possibly did combine with silica before the sulfate was available by decomposition of anhydrous calcium sulfate at much higher temperature. This unforeseen problem in the experimental project probably explains the difference of our results with those of [2], who concluded that SO3 has low
Table II - Chemical composition of the samples: B = before sintering (raw mixture); A = after sintering. In the upper part of the table, data are presented as wt.%, together with the sulfur loss (wt.%) after sintering. In the lower part, data are presented as molar proportion normalized to three moles (2CaO.SiO2).
[Tabela II - Composição química das amostras: B = pré-sinterização (mistura crua); A = pós-sinterização. Na parte superior da tabela, os dados são apresentados em % em peso, juntamente com a perda de enxofre (% em peso) após a sinterização. Na
parte inferior da tabela os dados são apresentados em proporção molar normalizada para três moles (2CaO.SiO2).]
BS 0 BS 0.5 BS 3 BS 6 BS 10 BS 20
wt % B A B A B A B A B A B A
CaO 65.1 65.3 65.1 65.1 64.9 65.9 64.7 66.6 64.4 67.7 61.2 69.5
SiO2 34.9 34.4 34.7 33.9 33.7 33.7 32. 6 32.8 31.0 31.5 29.1 29.6
SO3 0 0 0.23 0 1.39 0.07 2.77 0.50 4.6 0.86 9.71 0.89
sulfur loss wt.% 100 95.0 82.0 81.3 90.8
molar proportion
CaO 2.000 2.011 2.000 2.019 2.000 2.030 2.000 2.050 2.001 2.079 1.928 2.133
SiO2 1.000 0.989 0.995 0.981 0.970 0.961 0.940 0.941 0.899 0.903 0.857 0.848
volatility while S has high volatility. As already mentioned, XRF chemical data (Table II) indicate that sulfur loss did not took place up to 1000 oC, the temperature in which fused glass discs were prepared.
Major changes in cell parameters with increasing sulfur
content were observed in β C2S (Fig. 4), in comparison with pure, stoichiometric C2S [9]. The continuous change in cell parameters with incorporation of sulfur (Table IV) is indicative of assimilation of sulfur as solute in the structure of β C2S, according to the Vegard’s law [28]. Sulfur is likely to occupy the tetrahedral site in substitution for silicon, as both cations have small ionic radius (Si4+ = 0.26 Å; S6+ = 0.12 Å; after [29]). Variation of cell parameters of γ C2S (Table V) is one order of magnitude smaller than those of β C2S, indicating that sulfur may be present in lower amounts in γC2S. Triclinic C3S in samples BS3 to BS20 does not display relevant or systematic changes in cell parameters in
sample γC2S β C2S
C3S
(triclinic) χ2 Rwp
BS0 43.5(5) 56.5(5) - 4.684 0.0541
BS0.5 33.6(4) 66.4(3) - 5.204 0.0573
BS3 9.5(5) 78.4(3) 12.1(7) 3.841 0.0493
BS6 - 78.1(3) 21.8(7) 4.179 0.0520
BS10 - 60.0(9) 39.0(1) 5.079 0.0576
BS20 - 36.5(5) 63.4(6) 9.181 0.0768
Table III - Mineralogical composition (wt.%) determined by XRD-Rietved, and respective statistical parameters of Rietveld refi nements (χ2, Rwp); for details see [20]. Numbers in parentheses are the standard uncertainties calculated by the software (GSAS).
[Tabela III - Composição mineralógica (% em peso) determinada por difração de raios X (Rietveld) e respectivos
parâmetros estatísticos dos refi namentos pelo método de
Rietveld (χ2, Rwp); para detalhes consulte [20]. Os números entre parênteses representam a incerteza padrão calculada pelo programa (GSAS).]
30
2θ (degree)
Intensity
35 40 45
Figure 1: Selected angular (2-theta) range of X-ray diffraction patterns of the sintered samples, with indication of diffraction peak positions for the phases.
[Figura 1: Faixa angular (2-teta) selecionada dos difratogramas de raios X das amostras sinterizadas, com indicação da posição dos picos de difração das fases.]
30000
80 90
2θ (degree)
Intensity (cps)
Figure 2: Rietveld plot of a selected sample (BS 3); observed (crosses), calculated (continuous line) and difference curve (bottom line).
[Figura 2: Diagrama de Rietveld de amostra selecionada (BS 3); observado (cruzes), calculado (linha contínua) e curva de diferença (linha inferior).]
25000
20000
15000
10000
5000
0
20 30 40 50 60 70
BS 0
Samples
W
eight (%)
BS 6
BS 0.5 BS 3 BS 10 BS 20 100
80
60
40
20
0
Figure 3: Mineralogical composition (wt.%) of the samples after sintering, determined by XRD-Rietveld.
respect with sulfur contents of the samples (Table VI).
Results of differential scanning calorimetry are presented in Table VII. All samples underwent two endothermic events, around 150 oCand425 oC. The fi rst event refers
to loss of adsorbed water from the sample surface and the
second refl ects dehydration of portlandite and CSH. The
amount of heat measured at 425 oC is proportional to the
amount of portlandite and CSH in the sample. The heat of hydration of the samples increases steadily with sulfur content. However, this effect is not directly related to the
polymorphic transformations of C2S, but rather to the
presence of increasing amounts of C3S in the samples with sulfur in the raw-mixture. This caused a strong interference
in calorimetric measurements, as C3S has much higher
hydration heat (264 J/g; [30]) than β C2S (17 J/g; [12]) and γ C2S (8 J/g; [12]), the latter being almost inert. A comparison was made between the observed hydration heat of the samples with the heat of hydration of the pure phases, weighted according to their wt.% in the samples (Table III). An overall good agreement was obtained between observed and calculated hydration heat. A slight increase in hydration heat was observed in the samples BS 0.5, BS 3 and BS 6, which may be related to distortion of β C2S lattice by sulfur incorporation. In sample B10, there is a disagreement between the measured (82.36 J/g) and the predicted heat (113.16 J/g) of hydration. This is probably due to a propagation of errors, considering the uncertainties in the mineralogical composition (see statistical parameters of the Rietveld refi nement in Table III) and the large differences in
Table IV - Cell parameters obtained for β C2S. The values in the fi rst column (βC2S*) correspond to the cell parameters of the pure phase [9]. Numbers in parentheses are the standard uncertainties calculated by the software (GSAS).
[Tabela IV - Parâmetros de cela obtidos para β C2S. Os valores da primeira coluna (β C2S*) correspondem aos parâmetros de cela da fase pura [9]. Os números entre parênteses apresentam a incerteza padrão calculada pelo programa (GSAS).]
β-C2S * BS 0 BS 0.5 BS 3 BS 6 BS 10 BS 20
a (Å) 5.5121(1) 5.5127(5) 5.5132(5) 5.5132(5) 5.5116(6) 5.508(1) 5.507(2)
b (Å) 6.7575(1) 6.7578(5) 6.7584(5) 6.7597(6) 6.7610(7) 6.763(1) 6.768(2)
c (Å) 9.3138(1) 9.3150(7) 9.3161(7) 9.317(1) 9.319(1) 9.320(2) 9.327(5)
β (o) 94.581(1) 94.59(1) 94.59(1) 94.56(1) 94.48(1) 94.34(2) 94.24(4)
volume (Å3) 345.812 345.906 346.009 346.150 346.202 346.180 346.679
Table V - Cell parameters obtained for γ C2S. The values in the fi rst column (γ C2S*) correspond to the cell parameters of pure phase, according to [9]. Numbers in parentheses are the standard uncertainties calculated by the software (GSAS).
[Tabela V - Parâmetros de cela obtidos para γ C2S. Os valores da primeira coluna (γ C2S*) correspondem aos parâmetros de cela da fase pura, segundo [9]. Os números entre parênteses apresentam a incerteza padrão calculada pelo programa (GSAS).]
γ-C2S * BS 0 BS 0.5 BS 3
a (Å) 5.0821(1) 5.0834(4) 5.0836(5) 5.084(1)
b (Å) 11.2237(1) 11.228(1) 11.230(1) 11.233(4)
c (Å) 6.7638(1) 6.7657(7) 6.7665(8) 6.768(3)
volume (Å3) 385.807 386.162 386.292 386.511
Figure 4: Cell parameters of βC2S; beta C2S* refers to the cell parameters of the pure phase [9].
[Figura 4: Parâmetros de cela de β C2S; beta C2S* corresponde aos parâmetros de cela da fase pura [9].]
347.0
94.6 346.5
94.4 346.0
94.2 9.330
9.324
9.318
6.770
6.765
6.760
6.755 5.514
5.511
5.508
betaC2S* BS0 BS0.5 BS3 BS6 BS10 BS20 345.5
a (Å)
b (Å)
c (Å)
beta (º)
cell
volume (Å
the heat of hydration of the pure phases, mentioned above.
CONCLUSIONS
Stoichiometric mixtures were prepared in order to generate C2S (dicalcium silicate) with increasing amounts of sulfur. However, large-scale sulfur loss (from 80 to 100%) occurred probably due to large difference in the temperature of thermal decomposition of the raw materials, as calcium carbonate decomposes at much lower temperatures than calcium sulfate. This leads to early combination of calcium and silicon oxides and formation of C2S and C3S, and later release of SO3 at higher temperature, in a condition that precluded a high degree of incorporation in the already crystallized calcium silicates. Quantitative phase analysis by X-ray diffraction and Rietveld method leads to reliable polymorphic recognition. Good agreement was achieved between observed and calculated diffractograms by the Rietveld method. It was demonstrated that sulfur diminishes γ C2S abundance, increasing β C2S accordingly. Our study
Table VI - Cell parameters obtained for C3S (triclinic). The values in the fi rst column (C3S triclinic*) correspond to the cell parameters of pure phase, according to [19]. Numbers in parentheses are the standard uncertainties calculated by the software (GSAS).
[Tabela VI - Parâmetros de cela obtidos para C3S (triclínico). Os valores da primeira coluna (C3S triclinic*) correspondem aos parâmetros de cela da fase pura, segundo [19]. Os números entre parênteses representam a incerteza padrão calculada pelo programa (GSAS).]
C3S triclinic* BS 3 BS 6 BS 10 BS 20
a (Å) 11.67 11.6432(6) 11.6460(5) 11.6433(3) 11.6449(2)
b (Å) 14.24 14.2256(6) 14.2208(5) 14.2204(3) 14.2249(2)
c (Å) 13.72 13.7020(9) 13.7020(7) 13.6983(4) 13.7032(3)
(o) 105.5 105.309(4) 105.272(4) 105.304(2) 105.297(2)
(o) 94.33 94.619(5) 94.600(4) 94.566(2) 94.559(2)
(o) 90 89.778(5) 89.850(6) 89.863(3) 89.864(2)
volume (Å3) 2190.3 2181.5 2181.7 2180.3 2182.2
Table VII - Endothermic events of dehydration measured by DSC. Predicted heat is based on the heat of hydration of pure phases (γ and βC2S after [12]; C3S triclinic after [30]), weighted for the phase proportion in each sample (see Table III).
[Tabela VII - Eventos endotérmicos de desidratação determinados por DSC. O calor previsto é baseado no calor de hidratação das fases puras (γ e β C2S segundo [12]; C3S triclínico segundo [30]), ponderado pela proporção em massa das fases em cada amostra (vide Tabela III).]
sample
endothermic peak at 150 oC
(J/g)
endothermic peak at 425 oC
(J/g)
total heat absorbed
(J/g)
predicted heat absorbed (J/g)
BS 0 4.32 6.91 11.23 13.08
BS 0.5 6.05 13.91 19.96 13.98
BS 3 8.21 41.47 49.68 46.03
BS 6 13.10 67.80 80.90 70.83
BS 10 14.09 68.27 82.36 113.16
abundance in each sample.
ACKNOWLEDGEMENTS
We are grateful to CAPES for the M.Sc. grant provided to S. D. Gomes. Prof. Paiva-Santos is acknowledged for his suggestions on Rietveld refi nement strategies.
REFERENCES
[1] J. I. Bhatty, F. M. Miller, S. H. Kosmatka, “Innovations in Portland cement manufacturing”, 1st Ed., Portland Cement Association, Washington DC, USA (2004) 403.
[2] K. Kolovos, P. Loutsi, S. Tsivilis, G. Kakali, Cement Concrete Res. 31 (2001) 425-429.
[3] H. F. W. Taylor, Cement Concrete Res. 29 (1999) 1173-1179.
[4] F. M. Miller, F. J. Tang, Cement Concrete Res. 26 (1996) 1821-1829.
[5] D. S. Fortsch, Conference Record, Cement Industry Technical Conference, IEEE-IAS/Portland Cement Association (2004) 103-109.
[6] A. Neville, Cement Concrete Res. 34 (2004) 1275-1296. [7] K. Morsli, A. G. de la Torre, M. Zahir, M. A. G. Aranda, Cement Concrete Res. 37 (2007) 639-646.
[8] A. M. Il’inets, M. Y. A., Sovietic Physics Crystallography (English Translation) 35 (1990) 54-56
[9] W. G. Mumme, R. J. Hill, G. Bushnell-Wye, E. R. Segnit, Neues Jahrbuch für Mineralogie (Abhandlungen)
169 (1995) 35-68.
[10] W. G. Mumme, L. Cranswick, B. Chakoumakos, Neues Jahrbuch für Mineralogie (Abhandlungen) 170 (1996) 171-188.
[11] A. Gies, D. Knöfel, Cement Concrete Res. 17 (1987) 317-328.
[12] R. Müller, J. Neubauer, F. Götz-Neunhoeffer, Proc. 11th Int. Cong. Chemistry of Cement, South Africa (2003) 1043-1051.
[13] Z. Lu, K. Tan, Cement Concrete Res. 27 (1997) 989-993.
[14] A. K. Chatterjee, Cement Concrete Res. 26 (1996) 1213-1237.
[15] C. D. Popescu, M. Muntean, J. H. Sharp, Cement Concrete Composites 25 (2003) 689-693.
[16] D. Balzar, N. Audebrand, M. Daymond, A. Fitch, A. Hewat, J. I. Langford, A. Le Bail, D. Louër, O. Masson, C. N. McCowan, N. C. Popa, P. W. Stephens, B. Toby, J. Appl. Crystallography 37 (2004) 911-924.
[17] A. C. Larson, R. B. Von Dreele, General Structure Analysis System (GSAS), Los Alamos National Laboratory Report LAUR, Los Alamos, USA (2004) 86-748.
[18] B. H. Toby, J. Appl. Crystallography 34 (2001) 210-21. [19] N. I. Golovastikov, R. G. Matveeva, N. V. Belov, Kristallografi ya 20 (1975) 721-729.
[20] L. B. McCusker, R. B. Von Dreele, D. E. Cox, D. Louer, P. Scardi, J. Appl. Crystallography 32 (1999) 36-50.
[21] L. A. Gobbo, L. M. Sant’Agostino, L. L. Garcez, Cement Concrete Res. 34 (2004) 657-664.
[22] Y. Kihara, H. Uchikawa, Ceramica 32 (1986) 207-210. [23] G. Narsimhan, Chem. Eng. Sci. 16 (1961) 7-20. [24] A. W. D. Hills, Chem. Eng. Sci. 23 (1968) 297-320. [25] B. V. L’vov, Thermochim. Acta 386 (2002) 1-16. [26] D. L. Hudson-Lamb, C. A. Strydom, J. H. Potgieter, Thermochim. Acta 282/283 (1996) 483-492
[27] V. S. Ramachandran, “Applications of differential thermal analysis in cement chemistry”, 1st Ed., Chemical Publ. Co., New York, USA (1969) 308.
[28] R. Jenkins, R. L. Snyder, “Introduction to X-ray powder diffractometry”, 1st Ed., John Wiley and Sons, New York, USA (1996) 544.
[29] R. D. Shannon, C. T. Prewitt, Acta Crystallographica
B52 (1968) 925-946.
[30] J. Bensted, G. J. Audley, P. N. Aukett, Cement Concrete Res. 25 (1995) 426-432.
[31] S. Uda, E. Asakura, M. Nagashima, J. Am. Ceram. Soc. 81(1998) 725-729.
![Table V - Cell parameters obtained for γ C 2 S. The values in the fi rst column ( γ C 2 S*) correspond to the cell parameters of pure phase, according to [9]](https://thumb-eu.123doks.com/thumbv2/123dok_br/18892584.425454/5.998.89.487.120.609/table-parameters-obtained-values-column-correspond-parameters-according.webp)
![Table VI - Cell parameters obtained for C 3 S (triclinic). The values in the fi rst column (C 3 S triclinic*) correspond to the cell parameters of pure phase, according to [19]](https://thumb-eu.123doks.com/thumbv2/123dok_br/18892584.425454/6.998.167.835.247.453/table-parameters-obtained-triclinic-triclinic-correspond-parameters-according.webp)
