ISSN 0104-6632 Printed in Brazil
www.abeq.org.br/bjche
Vol. 32, No. 01, pp. 167 - 177, January - March, 2015 dx.doi.org/10.1590/0104-6632.20150321s00002751
Brazilian Journal
of Chemical
Engineering
USING A DOE AND EIS TO EVALUATE THE
SYNERGISTIC EFFECTS OF LOW TOXICITY
INHIBITORS FOR MILD STEEL
G. V. Bueno, M. E. Taqueda, H. G. de Melo and I. C. Guedes
*Chemical Engineering Department, Polytechnic School of the University of Sao Paulo, PO Box: 61.548, CEP: 05424-970, São Paulo - SP, Brasil.
E-mail: [email protected]
(Submitted: June 6, 2013 ; Revised: February 14, 2014 ; Accepted: April 5, 2014)
Abstract - Inhibitors are widely used to prevent corrosion in cooling-water systems, and their protective performance can be enhanced by combination. The aim of this paper is to identify possible synergistic effects between four low toxicity substances used as corrosion inhibitors for mild steel in industrial cooling-water systems. Electrochemical measurements were obtained following a design of experiments (DOE) where the independent variables were the inhibitors concentrations and the response variable the charge transfer resistance estimated from impedance diagrams. Potentiodynamic polarization curves show that all of them act as anodic corrosion inhibitors. Among the tested formulations, only the interaction between sodium molybdate and sodium tungstate showed statistically significant effects, indicating that they can perform better when used together. The results of this work show the importance of using a statistical tool when designing inhibitor mixtures.
Keywords: Mild steel (ASTM 1005); Cooling water; Corrosion inhibitors; Design of experiment; Synergic effects.
INTRODUCTION
In industrial cooling-water systems it is common to use corrosion inhibitors in order to prevent metal-lic corrosion and its unwanted adverse consequences for operating conditions such as blockages or possi-ble leaks. Until the 80s, much of the corrosion in-hibitor formulation was based on hexavalent chro-mium salts (chromates), due to their low cost and excellent performance to protect different metallic substrates in several aqueous environments (Gouda and Sayed, 1973; Hoar and Evans, 1932; Igual et al.,
2007; Lemaitre et al., 1989; Mccafferty, 1989; Onuchukwu et al., 1984).However, because of their high toxicity, the use of these compounds is being increasingly restricted by environmental regulations. From this point of view – to seek sustainable devel-opment – there is a search for substances that exhibit favorable environmental characteristics (Kolman and
Taylor, 1993; Murilo et al., 2002; Saji and Shibli, 2002; Sastri, 2001; Shibli and Saji, 2005; Shibli and Kumari, 2004; Souza, 2005; Ullmanns, 1992).
Molecules such as sodium molybdate, sodium tung-state, copper phthalocyanine and a modified polydi-methyl-siloxane copolymer (CPPM), with molecular weight of 17,000 g mol-1, have been reported to pre-sent corrosion inhibiting properties (Kolman and Taylor, 1993; Murilo et al., 2002; Saji and Shibli, 2002; Sastri, 2001; Shibli and Saji, 2005; Shibli and Kumari, 2004; Souza, 2005; Ullmanns, 1992) while having low toxicity levels and bioaccumulation (Diamatino et al., 2000; Mu et al., 2006; Koutsispyros
et al., 2006;Souza, 2005;Ullmanns, 1992).
the disposal is done in nature (Igual et al., 2007; Murilo et al., 2002; Saji and Shibli, 2002; Sastri, 2001; Shibli and Saji, 2005; Shibli and Kumari, 2004; Souza, 2005; Virtanen et al., 2001).
With the purpose of minimizing costs and in-creasing the inhibition efficiency, it is common to use mixtures of inhibitors. It has been reported that mixtures of two different types of compounds can behave better than the substances alone (Alexander and Moccari, 1993;Guedes et al., 1998; Leite et al.,
2005; Mohammedi et al., 2004; Naderi et al., 2009; Okafor et al., 2010; Silva et al., 2006). The syner-gistic effects have been ascribed to different mecha-nisms. For instance, Okafor et al. (2010) reported that 2-undecyl-1-sodium ethanoate-imidazoline sta-bilizes the adsorption of thiourea on steel surface, while Mohammedi et al. (2004) ascribed the better performance of HEDP (1-hydroxyethylene-1,1-di-phosphonic acid) and sodium metasilicate pentahy-drate (Na2SiO3. 5H2O) in the protection against cor-rosion of carbon steel in industrial hard water to pure additive effects. On the other hand, Ochoa et al.
(2002) identified a competitive adsorption process in the corrosion protection of carbon steel in chloride-containing solution by phosphonocarboxylic acid salts and fatty amines. However, a literature survey revealed that many of the published works seeking synergistic effects between inhibitors were per-formed with only two substances and only a few studies were carried out using three inhibitors (Alex-ander and Moccari, 1993). This is comprehensible because evaluation of the contributions of individual components to the corrosion inhibition process when more than two substances are added together can be difficult, especially regarding the quantification of synergistic effects between them (Guedes et al., 1998; Leite et al., 2005; Ochoa et al., 2002).
Factorial design is useful for identifying syner-gistic effects of one or more variables on a response. This tool is economical and easy to use and is able to provide a great deal of valuable information. Such a statistical tool allows synergistic effects between different parameters to be quantified based on a lim-ited number of planned experiments; quantitative analyses are performed using adequate software. Typical applications of this approach to different research domains can be found in Saji and Shibli (2002) and Samiento-Bustos et al. (2008). A com-prehensible explanation about the methodology is presented by Box et al. (2005).
This work aims to identify synergistic effects between four low-toxicity substances used as corro-sion inhibitors for mild steel (ASTM (1005)) in an industrial cooling water environment. With this
pur-pose, the investigation was performed using a full factorial design of experiments (DOE) in order to quantify more accurately the statistically significant effects that may exist between the inhibitors (Box et al., 2005).
EXPERIMENTAL DESIGN
The interactions between the inhibitors were evaluated using a full factorial design of experiments (DOE) at two (n = 2) levels. The input variables were the four different types of inhibitors (k = 4), which were either absent or added to the corrosive medium at a concentration of 1 x 10⁻³ mol L-1, mak-ing the two levels of the project. This combination gives a total of 16 (nk) experiments (Box et al.,
2005).
The original levels of the independent variables (inhibitor concentrations) were coded as -1 and +1 (Table 1). As these variables are continuous, a linear relationship must be established between the real value and the coded value, according to Eq. (1):
i
máx mim
R R
X
(R R ) / 2
− =
− (1)
where Xi is the codified variable (= 1, 2, .. k); R is any real value between the minimum and the maxi-mum; R is the average between the real minimum and maximum; Rmin, Rmax are the extreme values in original units.
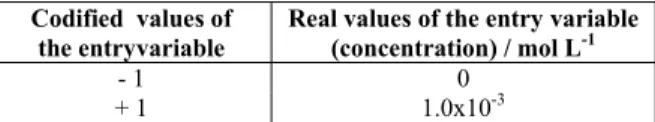
Table 1: Codified and real values of the independent entry variable.
Codified values of the entryvariable
Real values of the entry variable (concentration) / mol L-1
- 1 0
+ 1 1.0x10⁻³
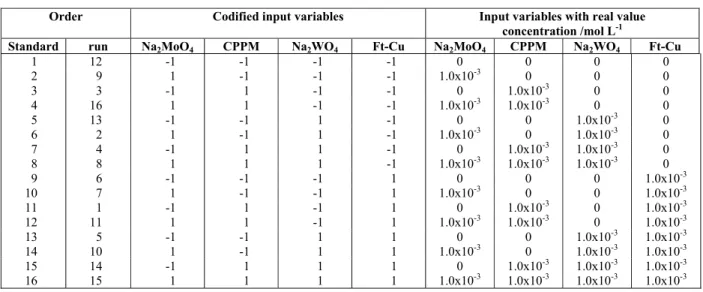
Table 2: Experimental matrix of the DOE with variables in coded and real values.
Order Codified input variables Input variables with real value concentration /mol L-1
Standard run Na2MoO4 CPPM Na2WO4 Ft-Cu Na2MoO4 CPPM Na2WO4 Ft-Cu
1 12 -1 -1 -1 -1 0 0 0 0
2 9 1 -1 -1 -1 1.0x10⁻³ 0 0 0
3 3 -1 1 -1 -1 0 1.0x10⁻³ 0 0
4 16 1 1 -1 -1 1.0x10⁻³ 1.0x10⁻³ 0 0
5 13 -1 -1 1 -1 0 0 1.0x10⁻³ 0
6 2 1 -1 1 -1 1.0x10⁻³ 0 1.0x10⁻³ 0
7 4 -1 1 1 -1 0 1.0x10⁻³ 1.0x10⁻³ 0
8 8 1 1 1 -1 1.0x10⁻³ 1.0x10⁻³ 1.0x10⁻³ 0
9 6 -1 -1 -1 1 0 0 0 1.0x10⁻³
10 7 1 -1 -1 1 1.0x10⁻³ 0 0 1.0x10⁻³
11 1 -1 1 -1 1 0 1.0x10⁻³ 0 1.0x10⁻³
12 11 1 1 -1 1 1.0x10⁻³ 1.0x10⁻³ 0 1.0x10⁻³
13 5 -1 -1 1 1 0 0 1.0x10⁻³ 1.0x10⁻³
14 10 1 -1 1 1 1.0x10⁻³ 0 1.0x10⁻³ 1.0x10⁻³
15 14 -1 1 1 1 0 1.0x10⁻³ 1.0x10⁻³ 1.0x10⁻³
16 15 1 1 1 1 1.0x10⁻³ 1.0x10⁻³ 1.0x10⁻³ 1.0x10⁻³
EXPERIMENTAL
Samples of mild steel ASTM 1005 with the fol-lowing chemical composition (wt%): 0.05C; 0.3Mn; 0.05Al; 0.016P; 0.011S; 0.010Cr; 0.002Ni and bal-ance Fe were employed. The specimens were cut into round-shaped working electrodes, mechanically polished with different SiC emery papers (320, 400 and 600 grit), washed with distilled water, rinsed with ethanol and acetone and dried in a hot air stream.
The cooling water used in this investigation was supplied by Oxiteno Company, in São Paulo, Brazil, from its industrial site, and its composition is pre-sented in Table 3. Further analysis revealed pH 6.9 and conductivity of 1100 μS cm-1.
The substances used as corrosion inhibitors were sodium molybdate, sodium tungstate, copper phthalo-cyanine and a polydimethyl-modified siloxane co-polymer (CPPM). When present, they were added to the corrosive medium at a concentration of 1 x 10⁻³ mol L-1.
Electrochemical Techniques
All the electrochemical tests were carried out in naturally aerated solutions (35 cl) at 25±1 ºC using a classical three-electrode cell mounting, employ-ing a large area Pt grid as counter-electrode and Ag/AgCl (KCl saturated) as reference electrode. In order to minimize the ohmic drop; this latter was con-nected to the main cell compartment by means of a Luggin capillary.
The electrochemical techniques employed to evaluate the corrosion inhibition efficiency of the different molecules were electrochemical impedance spectroscopy (EIS) and anodic and cathodic poten-tiodynamic polarization curves. The EIS spectra were acquired after 3 hours of stabilization of the corrosion potential (Ecorr) in the frequency range from 10 kHz to 125 mHz and at an acquisition rate of 10 points per decade. The perturbation amplitude was 10 mV (rms). After the completion of the EIS experiments the system was allowed to return to the stationary condition and the anodic and cathodic polarization curves run. The potential range studied varied from - 1600 mV to + 1200 mV versus OCP and the scan rate was 1 mV s-1.
The electrochemical tests were performed using an EG&G Princeton Applied Research (model 273) Potentiostat/Galvanostat coupled to a Solatron 1255 frequency response analyzer. The equipments were coupled to a PC and piloted by the Zview® software.
Table 3: Chemical composition of water from the cooling system used in this study.
Ion ppm
Ca2+ 125
Fe2+ 1.20
Si 11.3
Total chloride 3.0
Free chloride 1.0
Cl- 326
Total hardness (Ca2+, Mg2+) 175
Suspended solids 52.5
RESULTS AND DISCUSSION
Analysis of the Electrochemical Results for Each Inhibitor Added Individually
Figure 1 presents the polarization curves obtained in the presence of 1x10⁻³ mol L-1 of each inhibitor added individually. The curves were acquired after 3.5 hours of immersion of the electrodes in the test solutions. The addition of each inhibitor to the corro-sive medium shifted Ecorr to more positive values, indicating that all the studied substances behave as anodic corrosion inhibitors. Smaller anodic currents were found in the following order: sodium tungstate
≈ sodium molybdate < polydimethyl-modified silox-ane copolymer < copper Phthalocyanine, indicating better performance for the first two inhibitors. For the inhibitors that presented the lowest anodic cur-rents (sodium tungstate and sodium molybdate), a clear passive region was verified, which can be in-dicative of insoluble film formation between the inhibitors and the ions of the corroding metal (Samiento-Bustos et al., 2008; Shibli and Saji, 2005). In the solution containing molybdate, the substrate exhibited the smallest passive current den-sity, and a repassivation peak was detected at ap-proximately – 400 mV (Ag/AgCl), which can be likely due to the precipitation of a protective film. On the other hand, the largest passive range, ca 1000 mV, and the highest pitting potential was observed when tungstate was added to the test solution, pointing towards a more stable passive film. Con-cerning the cathodic behavior all the inhibitors be-have similarly, and presented slightly higher currents when compared to the substrate immersed in the solution without inhibitor.
The analysis of the polarization curves presented in Figure 1 shows that cathodic branches display a typical Tafel behavior, with a log/linear variation of the current with decreasing potential. On the other hand, the anodic branches acquired in the inhibitor-containing solution clearly deviate from the Tafel comportment. Similar anodic response has been
observed by other authors in studies on corrosion inhibitor efficiency for steel in different media. They have being associated with the presence of adsorbed species or insoluble corrosion products on the elec-trode surface.
-9 -8 -7 -6 -5 -4 -3 -2
-2000 -1500 -1000 -500 0 500 1000
E
/mV vs Ag/AgC
l(kcL
sa
t)
I/mA.cm-2 WO4
MnO 4 Withou
t
Ft-Cu
CPPM
Figure 1: Potentiodynamic polarization curves for
mild steel ASTM 1005 in the cooling-water in the absence and in the presence of 1 x 10⁻³ mol L-1 of each inhibitor.
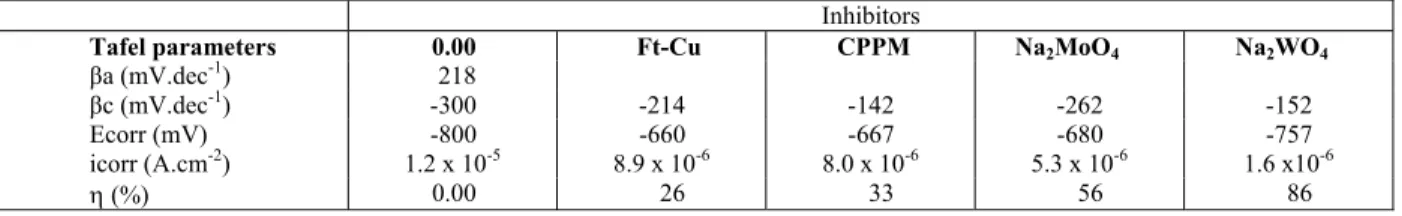
Table 4 displays the values of the electrochemical parameters derived from the Tafel extrapolation pro-cedure applied to the polarization curves presented in Figure 1. Due to the reason exposed above, the an-odic slope (βa) was not obtained and, therefore, the polarization resistance could not be calculated. Ac-cordingly, icorr values were determined by extrapo-lation of the cathodic branch to Ecorr. The addition of the inhibitor to the electrolyte shifts Ecorr in the noble direction and decreases the cathodic Tafel slopes, which must be a consequence of the lower anodic current density for the steel when the inhibitors are added to the test electrolyte. The inhibition effi-ciency calculated using Eq. (2) showed that Na2WO4 affords the best corrosion protection, with inhibition close to 86%, whereas Ft-Cu is the least efficient inhibitor, with inhibition efficiency close to 26%.
Table 4: Electrochemical corrosion parameters derived from the Tafel extrapolation method, and calculated inhibition efficiency for the different inhibitors.
Inhibitors
Tafel parameters 0.00 Ft-Cu CPPM Na2MoO4 Na2WO4
βa (mV.dec-1) 218
βc (mV.dec-1) -300 -214 -142 -262 -152
Ecorr (mV) -800 -660 -667 -680 -757
icorr (A.cm-2) 1.2 x 10⁻⁵ 8.9 x 10⁻⁶ 8.0 x 10⁻⁶ 5.3 x 10⁻⁶ 1.6 x10⁻⁶
corr(0) corr(i) corr(0) i i (%) 100 i −
η = ⋅ (2)
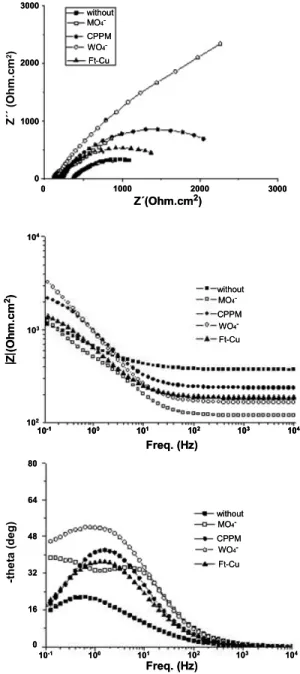
The EIS diagrams obtained in the presence of each individual inhibitor are presented in Figure 2.
Freq. (Hz)
10-1 100 101 102 103 104
Freq. (Hz)
10-1 100 101 102 103 104
-th e ta (d e g ) 00 16 80 32 48 64 102 103 104 Z (O h m .cm 2) 0000 1000 2000 3000 Z´ ´ (Oh m .cm 2)
0 1000 2000 3000
Z´(Ohm.cm2)
without MO4
-WO4
-Ft-Cu CPPM without MO4
-WO4 -Ft-Cu CPPM without
MO4
-WO4 -Ft-Cu CPPM
Freq. (Hz)
10-1 100 101 102 103 104
Freq. (Hz)
10-1 100 101 102 103 104
Freq. (Hz)
10-1 100 101 102 103 104
Freq. (Hz)
10-1 100 101 102 103 104
10-1 100 101 102 103 104
-th e ta (d e g ) 00 16 80 32 48 64 00 16 80 32 48 64 102 103 104 102 103 104 Z (O h m .cm 2) Z (O h m .cm 2) 0000 1000 2000 3000 0000 1000 2000 3000 Z´ ´ (Oh m .cm 2)
0 1000 2000 3000
Z´(Ohm.cm2)
0 1000 2000 3000
Z´(Ohm.cm2)
without MO4
-WO4
-Ft-Cu CPPM without MO4
-WO4
-Ft-Cu CPPM without MO4
-WO4 -Ft-Cu CPPM without MO4
-WO4 -Ft-Cu CPPM without
MO4
-WO4 -Ft-Cu CPPM without MO4
-WO4 -Ft-Cu CPPM
Figure 2: EIS diagrams for mild steel ASTM 1005
in the cooling-water in the absence and in the pres-ence of 1 x 10⁻³ mol L-1 of each inhibitor.
Similar to results reported by other authors (Granero et al., 2009; Samiento-Bustos et al., 2008), all diagrams exhibit depressed capacitive loops, indi-cating that complex phenomena are taking place at the interface. In accordance with the polarization curves,
the results show that all the substances increase the impedance response, demonstrating that they are hin-dering the corrosion activity to different extents. Due to the low conductivity of the medium, the electrolyte resistance is rather high, and the addition of the in-hibitors causes a clear decrease in this parameter.
Examination of Figure 2 reveals that one and two time constant responses were obtained. As the aim of the present work is not to determine the inhibition mechanism of the different molecules but to identify possible synergistic effects between them using a statistical tool, the origin of the different time con-stants will not be exhaustively discussed. However, in the literature, one time constant EIS response has been associated with molecules that adsorb onto the metallic substrate, changing the properties of the electrical double layer (Mahdavian and Ashhari, 2010), while two time constants have been ascribed to film forming corrosion inhibitors (Leite et al.,
2005; Kalman et al., 1994). Virtanen et al. (2001) and Alexander and Moccari (1993) reported evi-dences of film formation between molybdate ions and iron in different media. These latter authors (Alexander and Moccari, 1993) have proposed that the protective film could be formed either by the reaction of Fe2+ ions with MoO42- or by the interac-tion of a coordinated molybdate complex with the unfilled orbital (d) of the steel substrate.
Using the presented reasoning, the high frequency (HF) relaxation phenomena of the diagrams acquired in sodium molybdate and tungstate-containing elec-trolytes, which show two time constants, can be at-tributed to the presence of a film formed by the in-hibitors with the corrosion products, a hypothesis in accordance with the anodic passive behavior ob-served when they were added to the test electrolyte. On the other hand, the low frequency (LF) loop can be ascribed to interfacial phenomena, namely, the double layer capacity (Cdl) in parallel with the charge transfer resistance (Rct). This latter process is respon-sible for the single time constant verified in the EIS diagrams of mild steel when the two other inhibitors were added to the corrosive medium.
product layer (in another part of the article the au-thors state “increasing charge transfer resistance may have been the result of increasing concentrations of Na2MoO4 that converted the non-protective iron oxide/hydroxide to an increasingly protective fer-rous-ferric-Na2MoO42- barrier” additionally supporting our criticism). The correct interpretation of the re-sults of this work (Kolman and Taylor, 1993) further corroborates the hypothesis that the HF capacitive loop verified in the EIS response of mild steel in the presence of these two inhibitors is due to the exis-tence of a corrosion product layer formed between the inhibitors and the ions resulting from the corro-sion process. The analysis of the absolute values of the impedance in the LF limit of Figure 2 is in qualitative agreement with the results of the inhibi-tion efficiencies presented in Table 4, and allows the classification of the corrosion inhibition efficiency as follows: modified Ft-Cu < CPPM < sodium molyb-date < sodium tungstate.
In order to have a better quantitative evaluation of the effects of the inhibitors on the corrosion behavior of the substrate the EIS responses were fitted using equivalent circuits (EC). Figure 3 presents the two ECs employed to fit either the one (Figure 3(a)) or the two (Figure 3(b)) time constant EIS diagrams. In both ECs, constant phase elements (CPE) were used to replace pure capacitances in order to take into account non-homogeneities of the systems (Gerengi
et al., 2009; Jorcin, et al., 2006; Popova and Christov, 2006), which is reflected in the depressed nature of the capacitive loops. The dispersion of the capacitive semicircle is explained either by surface
heteroge-neities due to surface roughness or impurities, in-hibitor adsorption and formation of porous layers. In this sense the CPE exponent, n, can serve as a meas-ure of the surface heterogeneity. In the ECs of Figmeas-ure 3, Rs, Rp and Rct stand for the solution resistance, the pore resistance of the film and the charge transfer resistance, respectively, while CPE-film represents the capacity of the film formed on the substrate sur-face in the presence of tungstate and molybdate and CPE-dl the capacity of the electrical double layer, both of them exhibiting frequency distributed prop-erties. Fitting was considered successful when the errors associated with the estimation of each passive element was inferior to 10% and when chi-squared was lower than 10-3.
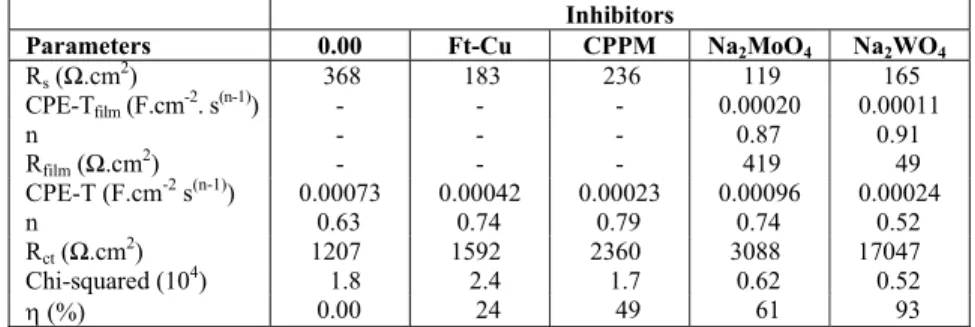
Table 5 displays the results of the fitting proce-dure of the diagrams presented in Figure 2 with the ECs of Figure 3. The results of the charge transfer resistance (Rct) calculations are in full agreement with the tendency evaluated by the Tafel extrapola-tion method. Therefore, the inhibiextrapola-tion efficiency can be classified as follow: Na2WO4 (93 %) >> Na2MoO4 (61 %) > CPPM (49%) > Ft-Cu (24%). These values were superior to those determined from the polarization curves (Table 4), which can be likely ascribed to the better precision of the EC fitting pro-cedure. The analysis of the data presented in this table also indicates that the film formed in the tung-state-containing solution must be very porous. Thus, it exhibits low resistance and the CPE exponent of the LF time constant when this inhibitor is added to the test electrolyte is close to 0.5, indicating the on-set of a diffusion controlled process.
Rs CP Edl
Rot
Rs CPE film
Rpo CPE dl
Rot
(a) (b)
Rs CP Edl
Rot
Rs CPE film
Rpo CPE dl
Rot
Rs CP Edl
Rot
Rs CP Edl
Rot
Rs CPE film
Rpo CPE dl
Rot
Rs CPE film
Rpo CPE dl
Rot
(a) (b)
Figure 3: Equivalent circuits used to fit the EIS diagrams obtained in the DOE: (a) one time constant; (b) two time constant diagrams.
Table 5: EC parameters obtained from the fitting of the impedance diagrams presented in Fig. 2 with the equivalent circuits of Figure 3.
Inhibitors
Parameters 0.00 Ft-Cu CPPM Na2MoO4 Na2WO4
Rs (Ω.cm2) 368 183 236 119 165
CPE-Tfilm (F.cm-2. s(n-1)) - - - 0.00020 0.00011
n - - - 0.87 0.91
Rfilm (Ω.cm2) - - - 419 49
CPE-T (F.cm-2 s(n-1)) 0.00073 0.00042 0.00023 0.00096 0.00024
n 0.63 0.74 0.79 0.74 0.52
Rct (Ω.cm2) 1207 1592 2360 3088 17047
Chi-squared (104) 1.8 2.4 1.7 0.62 0.52
Identification of Synergistic Effects Using the DOE
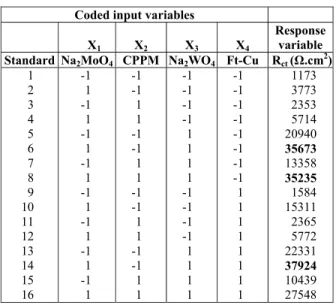
In a DOE, in order to quantify the effects of the input variables, it is necessary to choose a response variable. In the present investigation this was the Rct estimated from the EC fitting of the EIS diagrams. This variable was chosen as it is directly related to the corrosion resistance, i.e., the higher it is the bet-ter the corrosion protection afforded by the inhibi-tors. The values of Rct obtained in the experiments of the DOE are presented in Table 6, wherein the amount of inhibitor is presented in codified variables; more-over, in order to facilitate the statistical analysis, a label “Xi” was associated with each inhibitor.
Table 6: Experimental matrix with the input variables coded (molar concentration of
sub-stances) and response variable (Rct) for each
ex-periment proposed in the full factorial design.
Coded input variables
X1 X2 X3 X4
Response variable Standard Na2MoO4 CPPM Na2WO4 Ft-Cu Rct (Ω.cm2)
1 -1 -1 -1 -1 1173 2 1 -1 -1 -1 3773 3 -1 1 -1 -1 2353 4 1 1 -1 -1 5714
5 -1 -1 1 -1 20940
6 1 -1 1 -1 35673
7 -1 1 1 -1 13358
8 1 1 1 -1 35235
9 -1 -1 -1 1 1584
10 1 -1 -1 1 15311
11 -1 1 -1 1 2365
12 1 1 -1 1 5772
13 -1 -1 1 1 22331
14 1 -1 1 1 37924
15 -1 1 1 1 10439 16 1 1 1 1 27548
The results show that any combination of inhibi-tor hinders the corrosion process to some extent (the lowest Rct was verified when no inhibitor was added to the solution – experiment 1). A preliminary analy-sis of the data also demonstrates that the best inhibi-tory efficiencies were obtained in experiments 6, 8 and 14. In all of them, the concentrations of Na2MoO4 and Na2WO4 were at their maxima; how-ever, the concentration of CCPM and Ft-Cu were either at their maxima or minima. The results pre-sented in the table also show that the estimated val-ues of Rct for these three experiments are very close; therefore, the prediction of the existence of synergis-tic effects between the four inhibitors can only be accomplished on the basis of a statistical analysis based on a set of planned experiments as performed in the DOE.
Statistical analysis of the DOE was performed with the Minitab software, and the full result is pre-sented in Table 7. In the overall analysis only indi-vidual effects and first-order interactions between each two input variables were considered. In this table the constant term represents an average of all Rct values, obtained with the software, from all the experimental data. Therefore, for all the analyzed variables, the sign associated with each effect indi-cates if it contributes to increase (+) or decrease (-) this constant term. As already stated, in Table 6, the lowest value of Rct was obtained when no inhibitor was added to the corrosive medium (first experiment in the standard order). Therefore, a negative sign associated with any of the effects only indicates that it contributes to diminish the constant term presented in Table 7, and cannot be straightforwardly associ-ated with acceleration of the corrosion process; con-versely, a positive value means that the analyzed effect contributes to increase the average Rct.
Table 7: Results of statistical analysis using Minitab software, which shows the values of the individual effects and interactions of input variables in the Rct.
variable.
Variable Effect Coef. SE Coef.
T p – value
Constant term 16968 16968 1847 9.19 0.000
Na2MoO4 (X1) 15301 7650 1847 4,14 0.009
CPPM (X2) -8241 -4120 1847 -2.23 0.076
Na2WO4(X3) 24425 12213 1847 6.61 0.001
Ft-Cu (X4) -3118 -1559 1847 -0.84 0.437
X1*X2 -3862 -1931 1847 -1.05 0.344
X1*X3 9527 4764 1847 2.58 0.050
X1*X4 -2842 14.21 1847 -0.77 0.477
X2*X3 -6831 -3416 18471 -1.85 0.124
X2*X4 484 242 1847 0.13 0.901
X3*X4 -6123 -3061 1847 -1.66 0.158
Table 8: Analysis of variance for significance of the regression model for the Rct variable.
Source D. F. Seq SS Adj SS Adj Ms F P
Main Effects 4 3633385294 3633385294 908346324 16.64 0.004
Interactions 6 792607858 792607858 132101310 2.42 0.175
Residual Error 5 273007911 2730079110 54601582
Total 15 4699001063
R2 = 82.6% S = 7389.29
In Figure 4 the main effects and interactions are plotted on a probability scale for the 90% confidence interval. In this graph, the farther the point lies from the full line the more statistically significant the effect (Box et al., 2005). In this plot, it is clearly demonstrated that the main statistically significant effects are associated with X1, X2, X3 and the two-factor interaction between X1 and X3.
Figure 4: Normal probability plot for the effects of input variables for each substance studied as a corro-sion inhibitor.
From the data analysis, the statistical model ob-tained in order to estimate the Rct value (response variable) as a function of the statistically significant input variables is represented by Eq. (3). It shows that the input variables X1 (Na2MoO4) and X3 (Na2WO4) provoked a positive effect in the average Rct value. A positive synergistic effect between these two inhibitors was also observed, indicating that when used together the overall inhibitory effect must be superior to their simple additive effect. On the other hand, the input variable X2 (CPPM) causes a negative effect in the average value of Rct (note that the negative sign does not mean that the input vari-able accelerates the corrosion process). Conse-quently, its addition together with X1 and X3 must provoke a decrease in the Rct average value, indicat-ing that somehow it hinders the joint inhibitive action of these two substances. Moreover, the substance with
the best individual effect was tungstate (X3), in ac-cordance with the first part of this manuscript, when the individual effect of each inhibitor was evaluated.
ct 1 2
3 1 3
R 16968 7650X 4120X
12213X 4764X X
= + −
+ + (3)
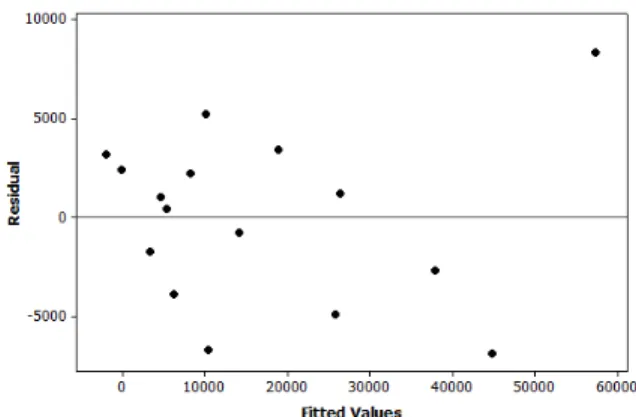
In Figure 5 the plot of the residuals (errors) vs. the estimated values of the response variable (Rct), calculated using Eq. (3), is presented. A random distribution of the residues is observed, suggesting that the model is indeed appropriate.
Figure 5: Residual vs. fitted values of the response variable (Rct).
The contribution of the inhibitor CPPM (X2) in Eq. (3) shows that it hinders the joint action of mo-lybdate (X1) and tungstate (X3). This can be under-stood if we analyze the inhibition mechanism previ-ously proposed for the different inhibitors based on the EIS results presented in Figure 2. The adsorption of CPPM on the electrode surface can diminish the dissolution of iron and, in consequence, avoid the formation of the corrosion product layer responsible for the corrosion protection afforded by WO42- and MoO42-. Finally, the synergistic effect detected be-tween these latter two inhibitors can be ascribed to the formation of a more stable protective film. It can be proposed that, as both inhibitors are weak oxidiz-ers (Alexander and Moccari, 1993; Kolman and Taylor, 1993; Li et al., 2009; Qu et. al., 2008), it is likely that their mutual oxidizing action will boost the performance of each of them. Indeed, in the lit-erature, it has been reported that the addition of other oxidizing agents like nitrites or oxygen to aggressive solutions containing molybdate improves the corro-sion protection afforded by this anion (Alexander andMoccari,1993).
Figure 6 shows selected EIS diagrams considered relevant for understanding the quantitative analysis presented in Eq. (3). The visual analysis of the dia-grams clearly shows that the best protection was afforded by mixing Na2MoO4 and Na2WO4 or Na2MoO4, Na2WO4 and CPPM, and that the imped-ance responses for these combinations were similar. However, the statistical analysis, for which the quantitative evaluation is expressed by Eq. (3), indi-cated that the addition of CPPM to the mixture of Na2MoO4 + Na2WO4 provokes a decrease of the joint effect of these two inhibitors, which is apparently contradictory. Nevertheless, one must bear in mind that the statistical analysis is based on the results of a set of experiments and the effects of all of them in all the situations are being evaluated. Table 4 shows that when CPPM is added to a Na2WO4-containing solu-tion, there is a decrease in Rct (compare the Rct val-ues for experiments 5 and 7). Moreover, comparing the Rct values for experiments 6, 8 and 14 (those with the best results), those of assays 6 and 14, where CPPM was absent, were slightly superior. In addi-tion, the Rct value for experiment 16 (all inhibitors at their maxima) is considerably lower. Taking into account that, from the statistical point of view, the addition of Ft-Cu is non-significant for the anticorro-sion performance of the formulations, in the overall analysis it is considered that these differences are due to the addition of CPPM to a solution containing Na2MoO4 + Na2WO4, explaining the results expressed in Eq. (3).
0 2000 4000 6000 8000 10000
0 2000 4000 6000 8000 10000
0.8Hz 0.8Hz
0.8Hz
0.8Hz 0.8Hz
Z'(O
h
m
. cm²)
Z''(Ohm. cm²) whitout
MO4
WO4
MO4+WO4+Ft-Cu +CPPM
MO4+WO4
MO4+WO4+CPPM
0.8Hz
Figure 6: Selected Nyquist diagrams for ASTM
1005 mild steel in the cooling-water used in the plant of Oxiteno – São Paulo (Brazil).
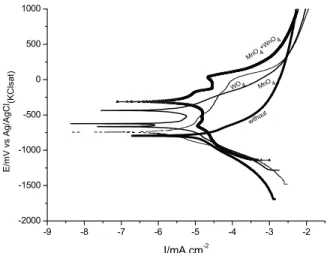
Figure 7 displays the comparison between the polarization curves for the best formulation identi-fied in the DOE analysis (molybdate + tungstate) and those acquired in solutions containing only molyb-date or tungstate. They clearly demonstrate the bene-ficial effect of adding both inhibitors to the aggres-sive medium: the pasaggres-sive current is diminished, the pitting potential is raised and a clear diffusion-con-trolled process is detected in the cathodic branch of the diagram indicating that a more resistive film is formed on the electrode surface.
-9 -8 -7 -6 -5 -4 -3 -2
-2000 -1500 -1000 -500 0 500 1000
E/
m
V v
s
Ag/
Ag
C
l (KCls
a
t)
I/mA.cm-2
witho ut
MnO4
WO 4
MnO 4 +WnO 4
Figure 7: Potentiodynamic polarization curves for
mild steel ASTM 1005 in the cooling-water in ab-sence and the preab-sence of different inhibitors: with-out; MoO4; WO4 and MoO4 + WO4.
CONCLUSIONS
used to hinder corrosion of mild steel (ASTM 1005) in industrial cooling water. The overall electro-chemical results show that, to a greater or lesser ex-tent, each inhibitor alone can hinder steel corrosion, and all of them act as anodic corrosion inhibitors. However, the statistical analysis revealed only the existence of positive synergism between sodium molybdate and sodium tungstate. Therefore, the use of these inhibitors together enhances their individual efficiencies. Moreover, it was also detected that the addition of CCPM to the mixture molybdate + tung-state is detrimental to the joint action of these in-hibitors and that, from the statistical point of view, the presence of Ft-Cu is insignificant for the corrosion reduction of ASTM 1005 in the studied medium.
The results of this work have shown the impor-tance of using a statistical tool when designing in-hibitor mixtures.
REFERENCES
Alexander, D. B. and Moccari, A. A., Evaluation of corrosion inhibitors for component cooling water systems. Corrosion, 49(11), 921-928 (1993). Box, G. E. P., Hunter, J. F. and Hunter W. G.,
Sta-tistics for Experimenters. 2nd Ed. John Willey, New Jersey (2005).
Diamantino, T. C., Guilhermino, L., Almeida, E. and Soares, A. M., Toxicity of sodium molybdate and sodium dichromate to daphnia magna straus evaluated in acute, chronic, and acetylcholi-nesterase inhibition tests. Ecotoxicology and En-vironmental Safety, 45(3), 253-259 (2000). Gerengi, H., Darowicki, K., Bereket, G. and Slepski,
P., Evaluation of corrosion inhibition of brass-118 in artificial seawater by benzotriazole using Dynamic EIS. Corrosion Science, 51(11), 2573-2579 (2009).
Gouda, V. K. and Sayed, S. M. A., Corrosion be-havior of steel in solutions containing mixed in-hibitive and aggressive ions. Corrosion Science, 13(11), 841-852 (1973).
Granero, M. F. L., Matai, P. H. L. S., Aoki, I. V. and Guedes, I. C., Dodigen 213-N as corrosion in-hibitor for ASTM 1010 mild steel in 10% HCl. Journal of Applied Electrochemistry, 39(8), 1199-1205 (2009).
Guedes, I. C., Aoki, I. V. and Taqueda, M. E. S., Polarisation curves and experiment design as tools in the search of optimised inhibitors mixture formulation for HSLA steel in hydrochloric acid. In: Materials Science Forum, 289, 1237-1244 (1998).
Hoar, T. P., and Evans, U. R., 366. The passivity of metals. Part VII. The specific function of chrom-ates. J. Chem. Soc., 2476-2481 (1932).
Igual Muñoz, A., García Antón, J., Guiñón, J. L. and Pérez Herranz, V., Inhibition effect of chromate on the passivation and pitting corrosion of a du-plex stainless steel in LiBr solutions using elec-trochemical techniques. Corrosion Science, 49(8), 3200-3225 (2007).
Jorcin, J. B., Orazem, M. E., Pébère, N. and Tribollet, B., CPE analysis by local electrochemi-cal impedance spectroscopy. Electrochimica Acta, 51(8), 1473-1479 (2006).
Kalman, E., Varhegyi, B., Bako, I., Felhősi, I., Kar-man, F. H. and Shaban, A., Corrosion inhibition by 1-hydroxy-ethane-1,1-diphosphonic acid an electrochemical impedance spectroscopy study. Journal of the Electrochemical Society, 141(12), 3357-3360 (1994).
Kolman, D. G. and Taylor, S. R., Sodium molybdate as a corrosion inhibitor of mild steel in natural waters part 2: Molybdate concentration effects. Corrosion, 49(8), 635-643 (1993).
Koutsospyros, A., Braida, W., Christodoulatos, C., Dermatas, D. and Strigul, N., A review of tung-sten: From environmental obscurity to scrutiny. Journal of Hazardous Materials, 136(1), 1-19 (2006).
Leite, A. O., Araújo, W. S., Margarit, I. C., Correia, A. N. & Lima-Neto, P. D., Evaluation of the anti-corrosive properties of environmental friendly in-organic corrosion inhibitors pigments. J. Braz. Chem. Soc. 16(4), 756- 762 (2005).
Lemaitre, C., Baroux, B., Béranger, G., Chromate as a pitting corrosioninhibitor: Stochasticstudy. Ok Werkstoffe und Corrosion, 40, 229-236 (1989). Mahdavian, M., Ashhari, S., Corrosion inhibition
performance of mercaptobenzimidazole and 2-mercaptobenzoxazole compounds for protection of mild steel in hydrochloric acid solution. Elec-trochimica Acta, 55(5), 1720-1724 (2010). Marin-Cruz, J., Cabrera-Sierra, R., Pech-Canul, M.
A., Gonzalez, I., EIS study on corrosion and scale processes and their inhibition in cooling system media. Electrochimica Acta, 51(8), 1847-1854 (2006).
McCafferty, E., Thermodynamic aspects of the crev-ice corrosion of iron in chromate/chloride solu-tions. Corrosion Science, 29(4), 391-401 (1989). Mohammedi, D., Benmoussa, A., Fiaud, C., Sutter,
Mu, G., Li, X., Qu, Q. and Zhou, J. Molybdate and tungstate as corrosion inhibitors for cold rolling steel in hydrochloric acid solution. Corrosion Sci-ence, 48(2), 445-459 (2006).
Murillo, F. R., Sanchez, R. T., Alonso, A. A., Im-proving the corrosion resistance of a cooling wa-ter system at an ammonium sulfate crystallization plant by corrosion inhibitors. Materials and Cor-rosion, 53(11), 820-826 (2002).
Naderi, R., Mahdavian, M. and Attar, M. M., Elec-trochemical behavior of organic and inorganic complexes of Zn (II) as corrosion inhibitors for mild steel: Solution phase study. Electrochimica Acta, 54(27), 6892-6895 (2009).
Ochoa, N., Baril, G., Moran, F. and Pébère, N., Study of the properties of a multi-component in-hibitor used for water treatment in cooling cir-cuits. Journal of Applied Electrochemistry, 32(5), 497-504 (2002).
Okafor, P. C., Liu, C. B., Liu, X., Zheng, Y. G., Wang, F. and Liu, C. Y., Corrosion inhibition and adsorption behavior of imidazoline salt on N80 carbon steel in CO2-saturated solutions and its synergism with thiourea. Journal of Solid State Electrochemistry, 14(8), 1367-1376 (2010). Onuchukwu, A. I. and Lori, J. A., The mechanism of
the corrosion inhibition of carbon steel in neutral medium by chromate and nickel ions. Corrosion Science, 24(10), 833-841 (1984).
Popova, A. and Christov, M., Evaluation of imped-ance measurements on mild steel corrosion in acid media in the presence of heterocyclic com-pounds. Corrosion Science, 48(10), 3208-3221 (2006).
Qu, Q., Li, L., Bai, W., Jiang, S. and Ding, Z., So-dium tungstate as a corrosion inhibitor of cold rolled steel in peracetic acid solution. Corrosion Science, 51(10), 2423-2428 (2009).
Qu, Q., Li, L., Jiang, S., Bai, W., Ding, Z., Effect of sodium molybdate on the corrosion behavior of cold rolled steel in peracetic acid solution. Jour-nal of Applied Electrochemistry, 39(5), 569-576 (2009).
Saji, V. S. and Shibli, S. M. A., Synergistic inhibi-tion of carbon steel corrosion by sodium tungstate and sodium silicate in neutral aqueous media. Anti-Corrosion Methods and Materials, 49(6),
433-443 (2002).
Samiento-Bustos, E., Rodriguez, J. G., Uruchurtu, J., Dominguez-Patiño, G. and Salinas-Bravo, V. M., Effect of inorganic inhibitors on the corrosion be-havior of 1018 carbon steel in the LiBr+ ethylene glycol+ H2O mixture. Corrosion Science, 50(8), 2296-2303 (2008).
Saremi, M., Dehghanian, C. and Sabet, M. M., The effect of molybdate concentration and hydrody-namic effect on mild steel corrosion inhibition in simulated cooling water. Corrosion Science, 48 (6), 1404-1412 (2006).
Sastri, V. S., Corrosion Inhibitors, Principles and Applications. New York, John Wiley and Sons Ltd. (2001).
Shibli, S. M. A. and Kumary, V. A., Inhibitive effect of calcium gluconate and sodium molybdate on carbon steel. Anti-Corrosion Methods and Mate-rials, 51(4), 277-281 (2004).
Shibli, S. M. A. and Saji, V. S., Co-inhibition char-acteristics of sodium tungstate with potassium io-date on mild steel corrosion. Corrosion Science, 47(9), 2213-2224 (2005).
Silva, D. K. D., Ribas, G. C., Cunha, M. T. D., Agostinho, S. M. and Rodrigues, P. R., Benzotri-azole and tolytriBenzotri-azole as corrosion inhibitors of carbon steel 1008 in sulfuric acid. Portugaliae Electrochimica Acta, 24(3), 323-335 (2006). Souza, P. R., Comportamento de três moléculas do
tipo organo-silano como inibidores de corrosão para o aço ABNT 1005 em meio de HCl 2M. M.Sc. Dissertation, EPUSP. São Paulo-SP (2005). (In Portuguese).
Therdthianwong, A., Manomayidthikarn, P. and Therdthianwong, S., Investigation of membrane electrode assembly (MEA) hot-pressing parame-ters for proton exchange membrane fuel cell. En-ergy, 32(12), 2401-2411 (2007).
Ullmanns´s Encyclopedia of Industrial Chemistry. VCH Publishers Inc, 213 (1992).
Virtanen, S., Surber, B. and Nylund, P., Influence of MoO42− anion in the electrolyte on passivity breakdown of iron. Corrosion Science, 43(6), 1165-1177 (2001).