Numerical Forensic Model for the Diagnosis of a Full-Scale RC
Floor
Abstract
The paper presents the results of an investigation on the diagnosis and assessment of a full-scale reinforced concrete floor utilizing a 3-D forensic model developed in the frame-work of plasticity-damage approach. Despite the advance-ment in nonlinear finite eleadvance-ment formulations and models, there is a need to verify models on nontrivial challeng-ing structures. Various standards on strengthenchalleng-ing existchalleng-ing structures consider numerical diagnosis as a major stage in-volving safety and economical aspects. Accordingly, model validity is a major issue that should preferably be exam-ined against realistic large-scale tests. This was done in this study by investigating a one-story joist floor with wide shal-low beams supported on columns. The surveyed cracking patterns on the entire top side of the floor were reproduced by the forensic model to a reasonable degree in terms of orientation and general location. Concrete principal plastic tensile strain was shown to be a good indirect indicator of cracking patterns. However, identifying the underlying rea-sons of major cracks in the floor required correlating with other key field parameters including deflections, and inter-nal moments. Therefore, the ability of the forensic model to reproduce the surveyed damage state of the floor provided a positive indication on the material models, spatial represen-tation, and parameter selection. Such models can be used as forensic tools for assessing the existing conditions as required by various standards and codes.
Keywords
nonlinear finite element; reinforced concrete; forensic; crack-ing; numerical model; diagnosis; existing structures.
Ahmed B. Shuraim
Associate Professor, College of Engineering (Civil), King Saud University, Riyadh, Saudi Arabia
Received 30 Mar 2012; In revised form 26 Apr 2012
∗Author email: [email protected]
1
1 INTRODUCTION
2
Many existing Reinforced Concrete (RC) structures show a number of situations where the 3
load carrying capacity of a structure in service may need to be increased, like where there 4
or ageing structures, NLFE can be can be of value to assess the safety and integrity of existing 16
structures; identify causes of deficiencies; and to assess the behavior expected from retrofitted 17
structures. However, NLFE models comprise various theories, elements and procedures where 18
some limitations, shortcomings and complexity were reported [34, 35]. 19
The complexity of finite element is in part due to the complexity of the concrete physical 20
behavior, being largely determined by the properties and interaction among its constituent 21
materials. To incorporate these experimentally-observed features into finite element, several 22
constitutive modeling theories have been proposed, including: nonlinear elasticity, plasticity, 23
and damage mechanics, among others [14, 18, 26]. Coupled damage-plasticity formulation 24
can provide a better representation of salient concrete features [18, 26], which is among the 25
concrete models incorporated in ABAQUS . 26
Numerical modeling of cracking in concrete usually involves either discrete or smeared 27
cracking approaches [9, 16, 28]. Discrete approach represents a crack as a geometrical disconti-28
nuity and can be treated in the framework of fracture mechanics concepts. The main drawback 29
is that one needs to know location of an expected crack and the direction along which it prop-30
agates [28]. On the contrary, smeared crack through damage mechanics offers the essential 31
advantage of predicting the location of this critical flaw. To circumvent mesh-sensitivity and 32
numerical divergence, an energy criterion can be employed instead of strength failure criterion. 33
In ABAQUS, fictitious crack model introduced by Hillerborg (1985)[21] can be employed to 34
alleviate the mesh-sensitivity. Whatever the chosen approach, numerical models need to be 35
validated not only on the basis of small members with trivial geometry but rather on the basis 36
of more challenging reinforced concrete structures [9]. 37
This study developed a forensic model on the basis of ABAQUS formulations and numerous 38
material models from the literature. The model capability was demonstrated over a full-scale 39
building floor for the purpose of assessing its adequacy in predicting the overall behavior in 40
terms of deformations and cracking patterns. Furthermore, the correlation between cracking 41
and internal distribution of moments was established at critical sections, giving the background 42
for the newly proposed design procedure [29, 30]. The results showed a successful corroboration 43
with test results indicating that such models can be used as forensic models for assessing the 44
2 DESCRIPTION OF THE FULL-SCALE REINFORCED CONCRETE JOIST FLOOR
46
The plan of WSB floor shown in Fig. 1 is for a full-scale reinforced concrete joist floor, designed, 47
constructed and monitored for more than 10 years within the structural laboratories at King 48
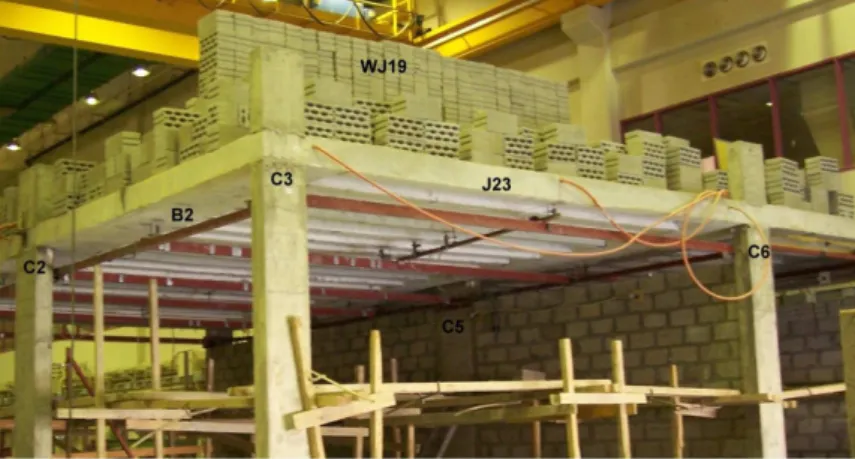
Saud University [29, 30]. Fig. 2 is a photo of the floor showing loading and members. The floor 49
consists of wide-shallow beams, one-way joists, a portion of solid slab, and narrow columns 50
that were within the typical widths of masonry walls. Dimensions, main reinforcement, and 51
material properties are given in Table 1. 52
Testing of the roof slab of the prototype building was done in three stages. Stage 1 was 53
the application of floor self-weight (SW) through form-removal. In Stage 2, a line load of 10.0 54
kN/m was applied on Joist J19 (WJ19) while in Stage 3, a uniform load (U) of 3.5 kN/m2
55
over the entire floor was applied. Concrete blocks were used for load applications. Stages 2 56
and 3 were applied in a set of mini-intervals where deflections, strains and cracking patterns 57
were collected during and after each interval. Net and accumulated deflections and strains due 58
to immediate load effects were assembled for each stage. The instrumentation plan involves 59
measurement of strains and deflections using various techniques. 60
The state of cracking on this floor was marked and photographed under all loading stages 61
and throughout their sustained conditions. Examples of the cracked states in the WSB floor 62
were depicted by photos presented in Fig. 3 through Fig. 6. The paths of these cracks 63
were documented by linear measurements of their coordinates to allow plotting them with the 64
numerical results. 65
Table 1 Floor member dimensions, reinforcement and material properties.
Member Section dim Longitudinal rebars No of Ties/stirrups MPa MPa
b x h mm bars x diameter in mm
B1, B2 250 x 800 Top 4ϕ16, 8@100 mm (4-Leg) at B1 ends 25 511
11ϕ16(1)
Bot 7ϕ16
B3 , B4 250 x 1200 Top 5ϕ16, 8@100 mm (4-Leg) at B3 ends
17ϕ16(1)
Bot 9ϕ16
DB1, DB2 600 x 200 Top 2ϕ16 8@100 mm (2-Leg)
SS15 h=150 Top ϕ12@550(2) None 499
Bot ϕ16@400(3) 511
J2-J22 250 x 150 Top 1ϕ12 None 499
Bot 2ϕ14 505
J1& J23(8) 250 x 200 Top 1
ϕ12 None 499
Bot 2ϕ14 505
C1,C4,C8(9) 200x 500 8
ϕ16 8@200 mm (4-Leg) 28 511
C2 200x 600 8ϕ16 8@200 mm (4-Leg) 511
C3, C6,C7, C9 200x 400 8ϕ14 8@200 mm (4-Leg) 505
C5 200 x 800 10ϕ16 8@200 mm (5-Leg) 511
Figure 1 Floor Plan layout, showing member designations
3 SPATIAL AND MATERIAL ASSUMPTIONS OF THE FORENSIC MODEL
66
Numerical models developed to simulate structure behavior may differ based on the choices 67
made in their spatial modeling, material modeling, element characteristics, and solution pro-68
cedures. For WSB floor shown in Figures 1 and 2, the nature of the problem is complex 69
and requires three-dimensional for geometrical and material considerations. The complexity 70
may be induced by non-uniformity in floor thickness, existence of columns with eccentricities, 71
different rebar distributions, partial column-floor connections, stirrup arrangements, triaxial 72
effects, and different potential modes of failure. Spatially, concrete can be modeled with a 73
variety of 2-D and 3-D elements. In this study, solid 3-D elements (C3D8) were selected for 74
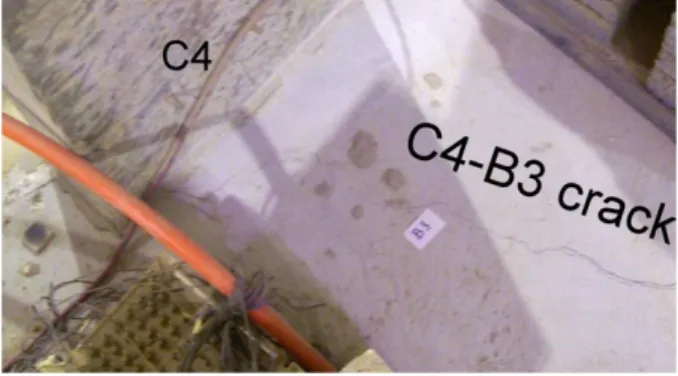
Figure 3 Photographic documentation of crack patterns around C4
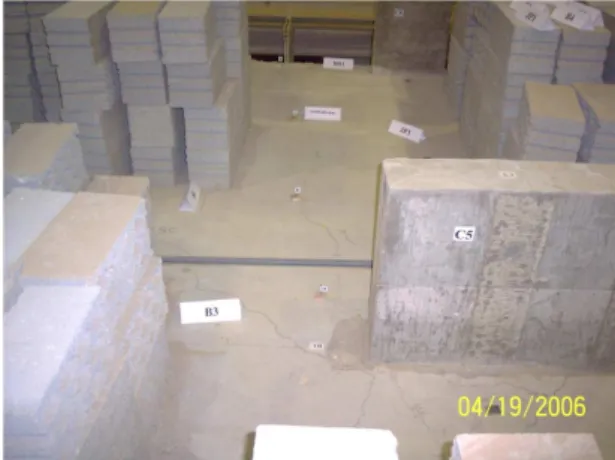
Figure 4 Photographic documentation of crack patterns around C5-long side
concrete while a bi-linear elastic-plastic model was chosen for reinforcing steel and represented 75
in space via truss elements (T3D2). The resulting spatial models for the floor concrete and 76
rebars are presented in Fig. 7 and Fig. 8. 77
In this study, ABAQUS damage-plasticity model was chosen for modelling concrete be-78
haviour. The post-peak in tension was represented by Hillerborg Fictitious Crack Model 79
(HFCM) (Hillerborg 1985)[21], which is characterized by three key parameters: the specific 80
energy dissipated after the localization in the cracked region; the tensile strength in direct 81
tension; and, the shape assumed for the softening branch. The energy criterion has been em-82
ployed instead of strength failure criterion in order to minimize the superficial dependence on 83
the chosen finite element. 84
3.1 Material parameters
85
The input parameters for the damage-plasticity model of concrete include uniaxial compression 86
curve, uniaxial tensile strength, Poisson’s ratio, modulus of elasticity, dilatancy angle, and 87
fracture energy. These parameters were defined as per available test data as well as from 88
Figure 5 Photographic documentation of crack patterns on C5-C8 path
Figure 6 Photographic documentation of crack patterns around C1
Gf, was expressed by Eq. (1) [3]
90
Gf =110(
fc′
10) 0.18
(1)
Direct tensile strength, ft′ (MPa) was taken as 91
ft′=0.25√f′
c (2)
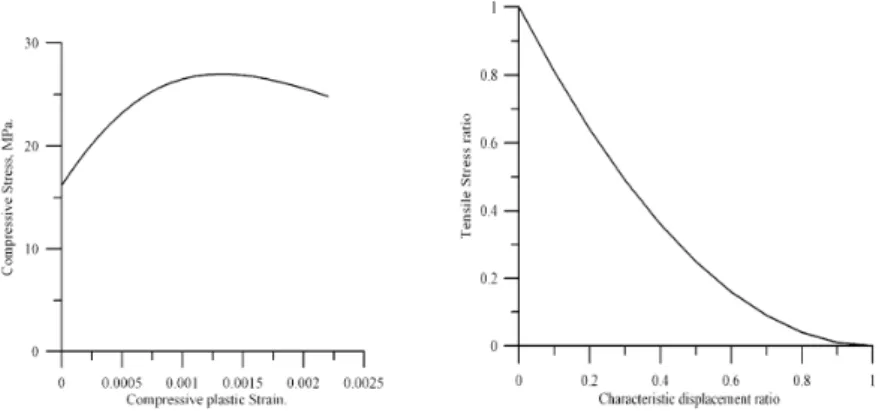
Post-cracking tensile curve for concrete shown in Fig. 9 a was defined by Eq. (3) [25], 92
where n is a coefficient taken as 2. 93
ft=f
′
t =(1− x
d0)
n
;d0=
Gf(n+1)
f′ t
(3)
Figure 7 Concrete solid elements and mesh
of WSB model. Figure 8 Rebars layout in the WSB model.
Carreira, and Chu (1985)[13]: 95
f c f′
c
=
βε0ε
β−1+(ε0ε )
β; where β=
1
1− f
′ c ε0Ec
(4)
Where the strain at maximum stress was defined by ε0=0.001648+0.0000165,f
′
c , Ahmed
96
(1981)[10]; and the modulus of elasticity for concrete, Ec(MPa) was given by ACI-363 (1997)
97
[7] Ec=3000
√
f′
c+6900. The plastic part of the compression stress-strain curve is shown in
98
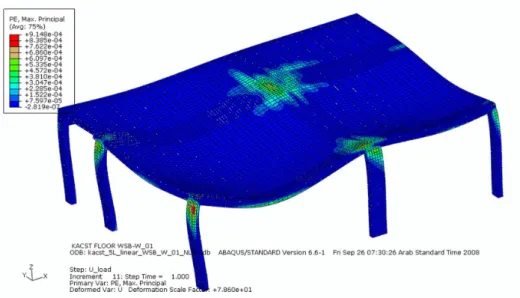
Fig. 9 b. The resulting model in its deformed shape along with the contour of maximum 99
principal tensile strains in concrete is shown in Fig. 10. 100
Figure 9 Typical stress-strain curves of concrete; (a) compressive plastic strain vs. stress, (b) post-peak tensile stress vs. displacement
4 FLOOR PHYSICAL CRACKING VERSUS CONCRETE TENSILE STRAINS
101
Generally speaking, concrete cracking is an elusive phenomenon of complicated nature in the 102
Figure 10 Deformed shape of the floor showing the contour of maximum principal tensile strains in concrete
significant structural distress or a lack of durability. They may also represent the total extent 104
of the damage, or they may point to problems of greater magnitude [6]. In many instances, 105
cracking may be attributed to a combination of stresses due to applied load and restraint of 106
volume change. The path a crack takes is also affected by the concrete composite properties 107
where the aggregate and the interfaces play very important role in the failure process [17]. 108
However, when surveying the damage of an existing structure, the cracking patterns can be 109
detected and documented with reasonable efforts where no particular setup or instrumentations 110
are required. A key quality of a good forensic model is its ability to reproduce existing physical 111
cracks and provide some insight into the underlying causes. The smeared crack approach does 112
not produce actual physical cracks, however, strains or stresses can usually be interpreted, 113
though not directly, to show the potential crack patterns [12, 15, 16, 19, 23, 27, 31–33]. 114
In ABAQUS, cracking is assumed to initiate at points where the tensile equivalent plastic 115
strain is greater than zero, and the maximum principal plastic strain is positive [22]. The 116
direction of the vector normal to the crack plane is assumed to be parallel to the direction of 117
the maximum principal plastic strain. No information can be obtained regarding crack spacing 118
in smeared crack formulation and it may not be a significant issue when investigating large 119
structures at macroscopic level. For the floor of this study, physical major cracks on the top 120
side of the floor were mapped and plotted to a reasonable scale in Fig. 11 through Fig. 14. 121
For direct comparison with the forensic model results, the maximum plastic principal tensile 122
strains (PPTS) were superimposed on the same figures. 123
4.1 Areas around floor corner columns
124
The corner columns in this floor had some framing differences affected by the panels they are 125
panel and both are attached to wide shallow beams. On the other hand, C7 is attached to a 127
drop beam carrying solid slab while C9 is part of a joist panels and framing into a drop beam. 128
For the areas around the latter two columns, there is a good correlation between physical 129
observation and model prediction since these areas did not exhibit any physical cracking and 130
no potential of cracking as demonstrated by the lack of noticeable PPTS symbols. 131
On the other hand, column C1 was surrounded by circumference crack that was reproduced 132
qualitatively through PPTS symbols. This crack was apparently induced by the presence of 133
biaxial negative moment about the x and y-axes. Finally, the crack around C3 was reasonably 134
predicted in a way that is consistent qualitatively with PPTS and in general agreement with 135
the expected crack orientation from the biaxial moment behavior. 136
4.2 Areas around floor side columns
137
The floor side columns in this floor include C2, C4, C6, and C8 where the latter is framed into 138
a drop beam while the remaining three were framed into wide shallow beams. Two of these 139
areas are to be discussed next while the other two are to be covered in a subsequent section. 140
4.2.1 C2 area 141
Column C2 supports unequal spans (B1 and B2), along its major axis about y-axis. From 142
the floor layout, C2 had the potential also of carrying some moment about its minor x-axis. 143
The area around C2 within the beam width showed several cracks oriented primarily in the 144
y-direction as shown in Fig. 13. From the forensic model, the overall PPTS intensity and 145
orientation were consistent with physical cracks orientations and general location. Follow-146
ing the PPTS symbol convention, the simulated crack should travel in the y-direction in a 147
perpendicular direction to the symbols which were primarily parallel to x-axis. 148
4.2.2 C8 area 149
In comparison with C2, the PPTS in the area around C8 showed shorter arrow length, and 150
less intensity indicating that cracking level at C8 should be less than C2. The floor showed a 151
visible crack emerging from the corner of column C8 and another crack crossing the adjacent 152
drop beam (DB1). Having the cracks on the left side of C8 was anticipated because the span 153
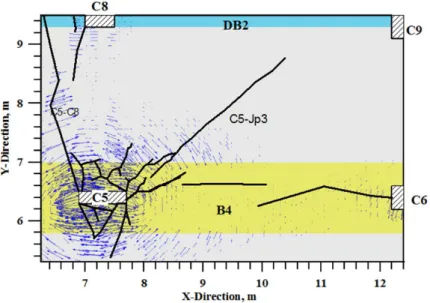
of DB1 was larger than the span of DB2. The crack designated C5-C8 extended all over the 154
panel was reproduced by the forensic model as indicated by the PPTS symbols in Fig. 11 and 155
Fig. 12. 156
4.3 Areas around the interior column
157
The state of cracking in the area around column C5 was influenced by high intensity of mul-158
tiaxial moments and shear forces as well as the rectangularity of the column cross-sectional 159
shape. Mapped physical cracks as shown in Fig. 15 revealed that most of the cracks emerged 160
from the vicinities around the column corners. Because of the high aspect ratio of the column 161
section; the short sides became the dominating source of multi-directional cracking. It is to 162
Figure 11 Mapped major cracks along with PPTS in panel C5-C6-C8-C9
state of cracking in a flat plate system on rectangular columns prior to punching shear failure, 164
comprising tangential and diagonal cracks. 165
Column rectangularity effect on punching shear was recognized by previous studies [8, 24] 166
where the critical shear strength was found to decrease as the aspect ratio increases, such as: 167
vc=
(2+3cs cl)
12
√
f′
c(mpa) (5)
where Cs is the short side of the column and Cl is the longer side and f
′
c is the concrete
168
strength. The rectangularity effect in this floor was demonstrated by the concentration of 169
cracking around the short sides of the column. This cracking behavior provides a corroboration 170
of previous studies on the effect of column rectangularity on punching shear. 171
Fig. 15 shows that the overall PPTS intensity and orientation around column C5 is in 172
support of the physical cracks orientations and general location. From this symbolic repre-173
sentation, potential cracks can be viewed to propagate in a perpendicular direction to the 174
two-arrow lines. Fig. 15 shows that the major diagonal cracks to the neighboring panels were 175
clearly predicted except for Jp2 where no physical crack was observed. In general, the forensic 176
model has captured the essence of the behavior to a large extent where the areas covered by 177
PPTS mirrored the areas that were subjected to physical cracks on the actual floor. 178
5 DESIGN CONSIDERATIONS: CORRELATION OF INTERNAL MOMENTS WITH
179
CRACKING
180
The complexity of internal moment distribution in concrete slabs has been well recognized; 181
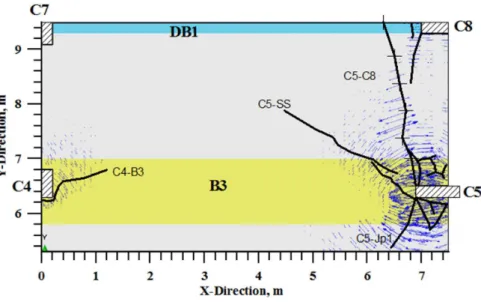
Figure 12 Mapped major cracks along with PPTS in panel C4-C5-C7-C8
for design purposes. For WSB floors with one-way joist system, the conventional distribution 183
is questionable [29, 30] and it would be appropriate to utilize the forensic model and the 184
experimental findings to verify the internal moment distribution in this floor by correlating 185
with physical cracks and PPTS. 186
When using solid elements and discrete truss rebar elements, the internal moments and 187
forces are not readily available from the standard output of ABAQUS. Thus, the moments were 188
developed on the basis of the nodal forces and nodal coordinates. A computer post processing 189
program was written for this purpose employing the following fundamental equations with 190
notation as shown in Fig. 16. 191
Using vector notations, 192
Ð→
M=ΣÐr→nX ÐF→n
=MxÐ→ι +MyÐ→J +MzÐ→k (6)
Where Ðr→
n is the position vector from the center of the section to a given node, n.
193
Ð→
rn= (∆x)Ð→ι +(∆y)Ð→j +(∆z)Ð→k (7)
where x0, y0, and z0 are the coordinates for the section centroids; xn, yn, and zn are the
194
coordinates for a given node n. similarly, the nodal forces at node n may be written as:
195
Ð→
Fn= (Fxn)Ð→ι +(Fyn)Ð→j +(Fzn)Ð→k (8)
The moments about x and y axes may be obtained by implementing the cross product of 196
Eq. (6): 197
Mx= ∑
n
Figure 13 Mapped major cracks along with PPTS in panel C2-C3-C5-C6
My=Σn(zn−z0)Fx−(xn−x0)Fz (9)
The moment diagrams about y-axis and x-axis over the interior shallow wide member beam 198
B3-B4 are shown in Fig. 17 and it is of interest to examine the correlation of these moments 199
with physical cracks. Under the sign convention used in this study, negative moment exceeding 200
the cracking moment about x-axis (Mx) should produce top cracking along x-axis ( i.e along
201
the beam) while negative moment about y-axis (Mx) should produce cracking along y-axis (
202
i.e across the beam). Their relative values can influence the direction and path of the crack 203
on the beam. 204
First, Fig. 17 reveals that the exterior end of B3 is subjected to a higher intensity of(Mx)
205
moment coupled with a low intensity of(My); this distribution favors cracks in the x-direction
206
which was consistent with the observed crack (C4-B3) in Fig. 12. Second, the middle part 207
of B3 has positive moment and negligible negative moment (Mx) suggesting that no cracks
208
should be expected on the top side of B3. As expected, the floor did not exhibit cracks on the 209
middle portion of B3 corroborating the results from the forensic model. 210
Third, for the middle and exterior portion of B4, the figure shows that the moment(Mx)is
211
negative with appreciable value in comparison to its counterpart on B3; moreover, the moment 212
(My) is either positive or of negligible negative value. This situation calls for cracking along
213
B4, and this was the observed pattern. Finally, Fig. 17 shows that the interior ends of B3 214
and B4 were subjected to high negative moments about both axes inducing multi-directional 215
cracking, as observed. 216
Thus, in addition to diagnosis of the existing floor conditions, the information revealed 217
about the internal distribution of moments indicated that the common simplified procedure 218
for one-way joist floor system which assumes a uniform intensity of (Mx) was unrealistic and
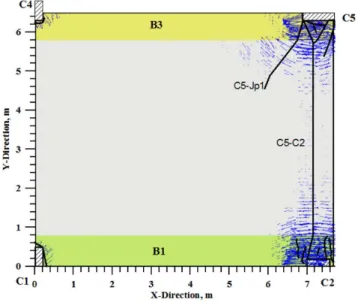
Figure 14 Mapped major cracks along with PPTS in panel C1-C2-C4-C5
contradicted by the forgoing profile. This discrepancy between the assumption and the actual 220
distribution was investigated by [30] and a new design procedure has been proposed. 221
6 FLOOR DEFLECTIONS: VERIFICATION AND INTERPRETATIONS
222
For further corroboration of the analytical forensic model with test results, vertical deflection 223
profiles along two lines in the floor were examined. Deflections are among the key behavioral 224
aspects and the ability of a forensic model to produce a reliable assessment of such large scale 225
test is of a great value in terms of validation and behavior interpretation. The deflections 226
profiles along line MJ and line MB3 are plotted in Fig. 18 and Fig. 19, respectively. It 227
can be observed that the forensic model produced deflections that were in good agreement 228
with test results for the three loading stages. The three experimental measuring schemes 229
(dial gauges (DG), LVDT, and surveying technique (SVY)) employed in this study produced 230
very consistent results with some expected scatter in readings. The agreement in trend and 231
magnitude between experimental and the forensic model had implication on mutual validation 232
of test measurements and numerical predictions. 233
Moreover, deflection results can be interpreted to shed some light on the long crack from C2 234
to C5 and that from C5 to C8, recognizing the role of edge members rigidities on the slab panel 235
behavior. For a typical rectangular slab panel, the load transfer and distribution of moments 236
in the two-directions is governed by the rigidity of edge members and panel continuity. This 237
principle remains true to some extent for rectangular joist panel; although, joist panels have 238
more complexity due to the interaction between unidirectional ribs and the top slab panel that 239
represents the flange. 240
Figure 15 Mapped major cracks around column C5 along with PPTS
connecting column C2 to C5 represents a de facto supporting member due to its high rigidity 242
as influenced of the two columns. This high rigidity can be interpreted from the deflection 243
profile along MJ line (Fig. 18) where the panel edges are marked by lower relative deflection 244
in comparison to mid-panel. It follows that a negative moment will form about y-axis on line 245
C2-C5, and since the flange is weak in resisting the moment, cracking has to take place. The 246
panel behavior may also be viewed in terms of compatibility requirements where the joist panel 247
needs to deform in a compatible way with the beams B1 and B3. 248
From the forgoing discussion, deflections were properly produced by the forensic model 249
and the results were shown to correlate with cracking along line C2-C5-C8. Even though some 250
concerns have been raised about NLFE, forensic models in the framework of plasticity-damage 251
approach and Hillerborg Fictitious Crack Model (HFCM) as supplemented by appropriate 252
constitutive expressions provided a powerful, accurate platform that can be used for forensic 253
௫
௬
Node n (, , )
Section centroid,
O (, , )
x
z
Figure 16 Computation of section moments from solid nodal forces
2 4 6 8 10 12
Stations along B3-B4, m -40
-20 0 20 40 60 80
M
o
m
e
n
t,
k
N
-m
/m
My Mx
Negative moments have +ve values
0 1 2 3 4 5 6 7 8 9 10 11 12 13 Stations along line MJ, m
-16 -12
V
er
ti
ca
Test-Stage 3 Test-Stage 2
D L SV
Test-Stage 1
Figure 18 Deflection profile along line MJ in WSB model and tested floor
0 2 4 6 8 10
Stations along line MB3, m -16
-12 -8 -4 0
V
er
ti
ca
l
D
is
p
la
ce
m
en
t,
m
m
Stage 3 Svy
DG-LVDT
Stages 1 &2 Svy DG-LVDT
Model-stage 3 Model-stage 1 & 2
7 SUMMARY AND CONCLUSIONS
255
This paper presented the results of an investigation on the diagnosis and assessment of an 256
existing structure employing a nonlinear forensic model. Various standards consider numerical 257
diagnosis as a major stage in the assessment and strengthening of existing structures based 258
on which several decisions involving safety and economical aspects are made. Accordingly, an 259
integral part of the methodology is to verify the forensic model reliability through comparison 260
with realistic large-scale tests. This was done in this study by investigating one-story floor 261
of joist-construction style with hidden wide shallow beams supported on elongated columns. 262
Based on this investigation, the following points can be made: 263
1. The forensic model and the experiment agreed on the behavior at macroscopic level 264
in terms of deflections and cracking patterns. Concrete principal plastic tensile strain 265
(PPTS) was shown to be a good indirect indicator of cracking patterns in terms of 266
cracking location and direction through symbolic representation. However, identifying 267
the underlying reasons of major cracks in the floor required correlating with other key 268
field parameters including deflections, and internal moments. 269
2. The ability of the forensic model to reproduce the surveyed damage state of the floor 270
provided a positive indication on the material models, spatial representation, and param-271
eter selection. Spatially, well-balanced mesh of concrete and rebar elements was shown 272
to be sufficient to provide reasonably accurate information. Having extremely fine mesh 273
as usually performed on individual members is not practical neither seemed necessary for 274
3-D buildings. The plasticity-damage approach combined with HFCM and supplemented 275
by appropriate constitutive expressions provided robust model. 276
3. The distribution of internal moments about the longitudinal axis of the wide shallow 277
beams (Mx) was of variable nature and consistent with the observed cracking patterns.
278
This finding confirmed the need to improve the design methodology of one-way joist 279
systems on wide shallow beams, as proposed elsewhere [30]. 280
Acknowledgments The author gratefully acknowledges the support provided by King Abdu-281
lAziz City for Science & Technology under Grant No. AR-16-66 in the experimental work. 282
Any opinions, findings, and conclusions expressed in this paper are those of the writers and 283
do not necessarily reflect the views of the sponsor. 284
References
285
[1] FIB Bulletin 14. Externally bonded frp reinforcement for rc structures. Technical report, FIB, Lausanne, Switzerland,
286
2001.
287
[2] ACI-440 2R. Design and construction of externally bonded FRP systems for strengthening concrete structures.
288
Farmington Hills, MI, 2008.
289
[3] Fib Bulletin 42. Constitutive modelling of high strength / high performance concrete. state-of-art report by task
290
group 8.2. Technical report, International Federation for Structural Concrete, Lausanne, Switzerland, 2008.
reliability evaluation using different guidelines. FRPRCS-8, July 16-18 2007.
302
[12] P. Bhatt and M. Abdel Kader. Prediction of shear strength of reinforced concrete beams by nonlinear fnite element
303
analysis. computers and structures. Computers and Structures, 68:139–155, 1998.
304
[13] D. J. Carreira and K. Chu. Stress-strain relationship for plain concrete in compression. ACI Journal, 82:797–804,
305
1985.
306
[14] W. F. Chen and D. J. Han. Plasticity for Structural Engineers. Springer-Verlag, New York, 1988.
307
[15] D. Coronelli and M. G. Mulas. Modeling of shear behavior in reinforced concrete beams. ACI Structural Journal,
308
103(3):372–382, 2006.
309
[16] R. de Borst. Fracture in quasi-brittle materials: a review of continuum damage-based approaches. Engineering
310
Fracture Mechanics, 69:95–112, 2002.
311
[17] G. Giaccio and R. Zerbino. Failure mechanism of concrete: combined effects of coarse aggregates and atrength level.
312
Advanced Cement Based Materials, 7(2):41–48, 1998.
313
[18] P. Grassl and M. Jirasek. Damage-plastic model for concrete failure.International Journal of Solids and Structures,
314
43:7166–7196, 2006.
315
[19] A. D. Hanganu, E. Onate, and A. H. Barbat. A finite element methodology for local/global damage evaluation in
316
civil engineering structures. Computers and Structures, 80:1667–1687, 2002.
317
[20] Hibbitt, Karlsson & Sorensen, Inc., Pawtucket, RI. ABAQUS Users’ Manuals and Theory Manual Version 6.10, 42
318
edition, 2009.
319
[21] A. Hillerborg. The theoretical basis of a method to determine the fracture energy gf of concrete. Materials and
320
Structures, 18:291–296, 1985.
321
[22] J. Lubliner, J. Oliver, and S. Oller. A plastic-damage model for concrete. International Journal of Solids and
322
Structures, 25(3):229–326, 1989.
323
[23] P. Menetrey. Synthesis of punching failure in reinforced concrete.Cement & Concrete Composites, 24:497–507, 2002.
324
[24] J. Moe. Shearing Strength of Reinforced Concrete Slabs and Footings under Concentrated Loads. Development
325
Department Bulletin D47, Portland Cement Association, 1961.
326
[25] R. C. Murthy, G. S. palani, and R. Riyer. State-of-the-art review on fracture analysis of concrete structural
compo-327
nents. Sadhana, 34(2):345–367, 2009.
328
[26] G. D. Nguyen and A. M. Korsunsky. Development of an approach to constitutive modelling of concrete:isotropic
329
damage coupled with plasticity. International Journal of Solids and Structures, 45:5483–5501, 2008.
330
[27] J. Pamin and R. de Bort. Simulation of crack spacing using a reinforced concrete model with an internal length
331
paamter. Archive of Applied Mechanics, 68:613–625, 1998.
332
[28] T. Sain and J.M. Chandra Kishen. Energy-based equivalence between damage and fracture in concrete under fatigue.
333
Engineering Fracture Mechanics, 74:2320–2333, 2007.
[29] A. B. Shuraim and A. I. AL-Negheimish. Influence of wide-shallow-beam flexibility on joist-floor behavior. In
335
Proceedings of the Third International Conference on Modeling, Simulation and Applied Optimization, Sharjah,
336
U.A.E, January 20-22 2009. paper 89099.
337
[30] A. B. Shuraim and A. I. AL-Negheimish. Design considerations for joist-floors with wide-shallow-beams. ACI
338
Structural Journal, 108(2):188–196, 2011.
339
[31] Ahmed Shuraim. Three-dimensional non-linear modelling aspects of a full-scale reinforced concrete banded-joist floor.
340
InProceedings of the Eighth International Conference on Computational Structures Technology, 2006. paper 13.
341
[32] Ahmed B. Shuraim. Efficacy of CFRP configurations for shear of RC beams.Structural Engineering and Mechanics,
342
39(3):361–382, 2011.
343
[33] F. J. Vecchio. Analysis of shear-critical reinforced concrete beams. ACI Structural Journal, 97(1):102–110, 2000.
344
[34] F. J. Vecchio. Non-linear finite element analysis of reinforced concrete: At the crossroads? Structural Concrete,
345
2(4):201–212, 2001.
346
[35] F. J. Vecchio, E. C. Bentz, and M. P. Collins. Tools for forensic analysis of concrete structures. Computers and
347
Concrete, 1(1):1–14, 2004.