Wavelet Transform and Artificial Neural Networks Applied to
Voice Disorders Identification
Raphael Torres Santos Carvalho, Charles Casimiro Cavalcante, Paulo C´esar Cortez Department of Teleinformatics Engineering
Federal University of Cear´a Fortaleza, Brazil
Email: [email protected], [email protected], [email protected]
Abstract—The amount of non-invasive methods of diagnosis has increased due to the need for simple, quick and painless tests. Due to the growth of technology that provides the means for extraction and signal processing, new analytical methods have been developed to understand the complexity of the voice signals. This paper presents a new idea to characterize signals of healthy and pathological voice based on two mathematical tools widely known in the literature, Wavelet Transform (WT) and Artificial Neural Networks. Four classes of samples were used: one from healthy individuals and three from people with vocal fold nodules, Reinke’s edema and neurological dysphonia. All the samples were recorded using the vowel /a/ in Brazilian Portuguese. The work shows that the proposed approach using WT is a suitable technique to discriminate between healthy and pathological voices.
Keywords-Voice Processing; Wavelet Transform; Artificial Neural Networks; Vocal Fold Nodules; Reinke’s Edema.
I. INTRODUCTION
The voice is one of the principal means of human communication and as an acoustic signal carries significant information about some individual characteristics. Vocal fold biomechanics in association with aerodynamic variables play an important role in voice production and they are linked to the voice quality changes [1]. The voice quality depends on the mode of opening and closing the glottis and vocal fold vibration. Some modifications laryngeal prevent that vocal folds have a glottal harmonic vibration. The main factors that determine the vocal vibrations are [2]:
1) position of the vocal fold, or the extent to which the vocal folds are adducted or abducted;
2) mio elasticity, or degree of elasticity of the vocal folds (determined by the position and degree of tension due to contraction of the vocal muscle);
3) pressure level of air through the vocal folds.
The vocal folds alterations due to the presence of patholo-gies in the larynx cause significant changes in their patterns of vibration, affecting the voice quality. Laryngeal disorders may cause difficulty in diagnosis, because they are very similar, although display different origins and pathophysi-ological alterations. These alterations can be classified as physical, neuromuscular, traumatic, and psychogenic, and all directly affect the voice quality. Some laryngeal disorders
represent the majority of attendances of patients with voice changes. These disorders are: vocal fold nodules, vocal cysts, vocal polyps, Reinke’s edema and sulcus. In most cases, these disorders produce a laryngeal hoarseness with typical characteristics of each one, especially when analyzed by otolaryngologists and speech therapy professionals [2].
Given the above, to be able to evaluate the patient vocal quality, doctors use many techniques. Some techniques are subjective, where the specialist hears the voice, and they are totally dependent on the experience of the professional. Other techniques allow direct inspection of the larynx and visualization of vocal fold vibration behavior through the use of laryngoscopic techniques such as direct laryngoscopy and videostroboscopy. Although more objective these techniques are considered invasive and cause discomfort to patients and use sophisticated and expensive instruments like as special light sources, endoscopic instruments and video cameras specialized [3].
The simplicity and the non-invasive nature have made the techniques of digital signal processing, through acoustic analysis, an efficient tool for the diagnosis of disorders caused by laryngeal diseases, classification of voice diseases and accompaniment of the progress of treatments. Compared to traditional methods, these techniques based on acoustical analysis have advantages: to propitiate a more comfortable patient, to provide a quantitative assessment and to enable the development of automatic computer-aided diagnosis for a low cost. Therefore, they can be applied as auxiliary methods based on direct inspection of the vocal cords, reducing the regularity of the more invasive tests [3].
In the recent approaches to pathological voice classifi-cation, various pattern classification and feature extraction methods have been used. Several researches, such as: relative entropy measures [1], autoregressive decomposition and pole tracking [4], local discriminant basis and genetic algorithm [5], dynamical system theory [6], Fourier transform (FT), have recently been applied to various kinds of classification tasks of pathological voice.
In feature extraction process based on the FT the features that are extracted have fixed time frequency resolution because of the inherent limitation of the FFT. For this
371
reason, classification of voice samples is difficult using these features. More recently, discrete wavelet transform (DWT) and wavelet packets (WP) [7], [8], have been tried for feature extraction, owing to their multi-resolution capabilities. The features used were chosen from the wavelet coefficients having high energy. Although these features offered the ad-vantage of picking up high frequency from a slowly varying signal, they suffered from a problem of shift variance. A small shift in a signal may cause a large variation in the wavelet coefficients, thereby changing the features extracted. In this paper we propose a feature extraction technique to characterize signs of healthy and pathological voice based on DWT which is shift invariant and we test its performance by using linear artificial neural network (ANN) multi-layer perceptron (MLP) classifiers.
The remainder of this paper is organized as follows. Section 2 presents a brief description about the vocal cords healthy, the vocal fold nodules and Reinkes edema pathol-ogy. In Section 3 the voice samples used in the study are described in greater detail and it is given a brief introduction about DWT and ANN. In Section 4, the proposed approach for extracting attributes using DWT is described. Section 5 presents the results of research using this new approach and, finally, the last section presents the final comments on the work.
II. FUNDAMENTALS OFSPEECHPRODUCTION In this section, we describe some details on the vocal cords healthy and pathological, considering the vocal fold nodules and Reinke’s edema.
A. Healthy vocal fold
Speech is one of the abilities or skills that humans pos-sess for communication, expressing their thoughts, opinions and feelings through words [9]. Human voice production depends on the conjunction of several mechanisms, such as resonant vocal tract, sub glottal and supraglottal pressures, biomechanical characteristics of tissues of the vocal tract and vocal folds oscillation [1]. The vocal folds vibrate with the passage of air from the lungs. The passage of air through the cavities of the vocal tract changes the spectrum of sound due to resonances, which form of energy peaks in the frequency spectrum known as formants. Through spectral analysis of speech produced is possible to estimate the shape of the vocal tract [10].
According to Hirano [11], vocal folds vibration deter-minates the voice quality. In a simple representation, they consist of a five-layers complex structure: the epithelium, the superficial, intermediate and deep layers of the lamina propria (LP) of the mucosa and the vocalis muscle. The superficial layer of the LP consists chiefly of a very pliable amorphous substance referred to as Reinkes space (RS). The intermediate layer of the LP is composed mainly of elastic fibers, whereas the deep layer is composed basically
of collagenous fibers. The structure consisting of the inter-mediate and deep layers is called the vocal ligament. The vocal folds movement may be observed as the superposition of two main components: the dynamics of the vocalis muscle (body) and the one of the epithelium and superficial lamina propria (cover), known as the mucosal wave. This process is described as a traveling wave propagating over the cover tissue during the phonation cycle, consisting of a displacement of the tissues relative to the body [1].
In video-laryngoscope image shown in Fig. 1(a), the clo-sure phase would be observed by full contact between both vocal folds borders resulting from perturbations produced by the traveling waves on the respective cover structures, and producing voice sound. During breathing, vocal folds open allowing the passage of air through the glottis as shown in Fig. 1(b).
(a) The closure phase of the vocal folds, resulting in the voice sound production.
(b) Open vocal folds during breath-ing allowbreath-ing the passage of air through the glottis.
Figure 1. The video-laryngoscope images were collected at the Otolaryn-gology Department and the Head and Neck Surgery Department of the Medical School at Ribeirao Preto, State of Sao Paulo, Brazil [1].
B. Vocal Fold Nodules
Vocal fold nodule is defined as a benign lesion occurring on both sides of the vocal fold, strictly symmetric on the border of the anterior and middle third of the vocal fold and usually immobile during phonation. The lesion is confined to the superficial layer of the lamina propria and is the result of trauma and constant collision of the vocal cords caused by over contraction intrinsic muscles of the larynx during speech. According to different studies, nodules mostly occur at the midpoint of the membranous vocal folds, where impact forces are the largest and they are mostly bilateral [1].
such as teachers, speakers and singers as well as children. Other predisposing factors have been featured in the genesis of vocal fold nodules, such as nasal obstruction, recurrent sinusitis, velopharyngeal insufficiency, hearing loss, and gastroesophageal reflux [13].
C. Reinke’s edema
Reinke’s edema is a generalized swelling of the vocal folds due to fluid accumulation in the surface layer of the LP [14]. It is a benign laryngeal disease that occupies the vocal folds and causes salience with the glottis. It can occur on both vocal cords or be limited to one vocal cord, usually early in the disease. In this condition, the liquid accumulated in the submucosa of the lining of Reinke’ space makes the cover of the vocal folds become less rigid and more massive, like a vibrating structure, usually evolving to a chronic irritation of the vocal cords, changing the permeability of the capillary tissues [15].
This disease is often associated with etiopathogenic fac-tors like as smoking, sinusitis or upper respiratory tract infection, and overuse of the voice, also known as vocal trauma [1], [16]. Gastroesophageal reflux or persistent irri-tation is also considered a contributing factor for Reinke’s edema [17]. However, as quoted by [1] and [18], there is no evidence that the allergic conditions or medications are also factors that contribute to this disease.
III. EXTRACTION ANDCLASSIFICATION OFATTRIBUTES OFVOICESIGNAL
A. Voice samples
For this study, the voice signals collected from 60 volun-teers, aged between 18 and 90 years, divided into four groups of approximately equal size, were used . The first group was composed of healthy people without voice complaints and no laryngeal pathology. The second group was composed of people with vocal fold nodules in different stages of disease evolution according to Scalassara et al. [4]. The third group was composed of samples of people with Reinke’s edema. And the last group was composed of patients with different neurological disorders like as Stroke, Huntington’s Disease, Parkinson’s Disease, Amyotrophic Lateral Sclero-sis, Mononeuritis multiplex, Mitochondriopathy, Duchenne dystrophy, Myotonic dystrophy and Dystonia cervical, and are grouped as patients with neurological dysphonia.
These voice samples are part of a voice database of the Group of Bioengineering of the School of Engineering of S˜ao Carlos of the University of S˜ao Paulo, Brazil. These signals were collected along the past ten years and used in several studies [1], [4], [19]. All volunteers were diagnosed by physicians of the Otolaryngology Department and the Head and Neck Surgery Department of the Clinical Hospital of the School of Medicine at Ribeir˜ao Preto, State of S˜ao Paulo, Brazil, by means of video-laryngoscope and stroboscope light. Volunteers in the group of healthy people
were also diagnosed to prove the absence of any pathology. The samples were recorded using a methodology to simulate presented in [20], in which volunteers were asked to produce the sustained vowel /a/ tone and keeping the level of com-fortable intensity for about 5 seconds. Of several consecutive samples, the signal was selected with the lowest variability of voice. All voices samples were quantized in amplitude with 16 bits and recorded in mono-channel WAV format to preserve the fidelity of the signal. The sampling frequency was 22,050 Hz.
B. Discrete Wavelet Transform
To identify a given disease of larynx, some features of the voice signal in the time/frequency or some other field should be known. The Fourier analysis assumes that the signal is stationary in time; however, in the case of speech signals this is not true. In the processing of speech signals, a windowed version of signal is used with the assumption of stationarity during this period. This method is known as the short time Fourier Transform Short (STFT), where short window duration is chosen, the frequency resolution will be small. Thus, setting the window size, resolution time-frequency STFT is also achieved by fixed [21].
To overcome the problem of fixed resolution, the wavelet transform uses an adaptive window size, which allocates more time to the lower frequencies and less time for the higher frequencies [22]. This analysis can be used for signal which have short-duration high-frequency components and long-duration low-frequency components, as in the case of speech signals [10].
The basis function used in the Wavelet Transform is localized in time and as well as frequency. All the filters are scaled versions of a prototype filter�(�), also known as the mother wavelet, with zero average and is centred in the neighbourhood of�= 0, given by [10]
��,�(�) =�−
1 2 ⋅�
(
�−�
�
)
, (1)
where parameters� and�are called translation and scaling parameters respectively. The term �−1/2 is used for energy
normalisation. The Discrete Wavelet Transform (DWT) of a signal�(�), where�∈L2, is given by equation [10]
�(�, �) = 2−�2∑
�
�(�)⋅�∗(2−��−�), (2)
where�,�and�are integers. By choosing the scaling factor as dyadic (2�) the resultant transform is known as dyadic
DWT.
If the wavelet decomposition is computed up to a scale 2�, the resultant signal representation is not complete. The
lower frequencies corresponding to scales larger than2�, can be evaluated by using the following equation [10]
�(�, �) = 2−�2∑
�
�(�)⋅�∗(2−��−�), (3)
where�∗(�)is the complex conjugate of the scaling function �(�).
The DWT can be viewed as the process of filtering of the signal using a low pass (scaling) filter and high pass (wavelet) filter. Thus, first level of DWT decomposition of a signal splits it into two bands giving a low pass version and a high pass version of the signal. The low pass signal gives the approximate representation of the signal while the high pass filtered signal gives the details or high frequency variations. The second level of decomposition is performed on the low pass signal obtained from the first level of decomposition. Thus, the wavelet decomposition results in a binary tree like structure which is left recursive.
The concept of using the energy as features in different frequency bands obtained by using STFT can be extended easily to DWT. These features are expected to have ad-vantage over the STFT derived features because of better tiling of timefrequency plane by DWT. In this work, the Daubechies wavelet with 6 vanishing moments is used because Daubechies wavelets have minimum-support size of 2�−1 for a given number of vanishing moments p. These compactly supported wavelet filters are designed by using a finite impulse response conjugate mirror filter [21]. C. Artificial Neural Networks
Pattern recognition (PR) is a sub-topic of learning ma-chine whose goal is to classify information (patterns) based on either a priori knowledge or statistical information ex-tracted from the patterns.Examples of applications of PR are found in [10]. The classification of patterns can be defined as a problem related to the determination of a decision boundary that can distinguish different patterns in a set of classes within a feature space�-dimensional, where�is the number of characteristics.
Artificial Neural Networks are one of the most classifiers known in the literature and; therefore, it was chosen to classify laryngeal diseases in this work. ANN models are specified by the network topology, neuron features and learning or training rules. The topology term refers to the network structure as a whole, specifying how the inputs, outputs and hidden layers are interconnected [23]. In this work we used the topology of the Multi-Layer Perceptron (MLP), as one of the most ANN commonly used to separate data is not linearly separable like as pathological voice samples.
IV. PROPOSEDAPPROACH
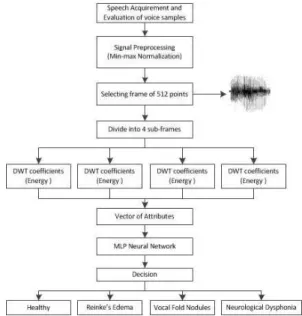
In order to be analyzed, a portion of each sample of voice with appropriate acoustic characteristics was selected, in order to eliminate transients and variations present in the voice recording. For all samples, about 1 s of voice sample
was selected and divided into 40 shares of 512 points, approximately 24 ms each. Before applying the technique of feature extraction, the signals were preprocessed by a min-max normalization to result in signals with amplitudes between 0 and 1.
The proposed method is to apply the Discrete Wavelet Transform on one audio frame of 24 ms that is divided into 4 sub-frames of duration of 6 ms to accommodate rapid oscillations and allow to follow the temporal evolution of the average energy per sample in each band. As the speech signal is stationary for a duration of up to 10 ms due to physical limitation of motion in joints of speech production, any further reduction in the duration of the frame is not useful [21].
The wavelet decomposition is applied to each sub-frame and the energy of wavelet coefficients in each frequency band is calculated. This energy is normalized by the number of samples in the corresponding track, resulting in an average energy per sample in each range. Normalization is essential because each band will have a different number of samples. These average energy per sample for different age are used as features for classification. The features extracted on a sub-frame basis not only give energy in each band, but also gives an idea of how the energy in each band varies with time (temporal variation).
The amount of extracted features depends on the level of decomposition of each sub-frame. A decomposition level� of a sub-frame draws�+1features. Thus, on a frame of 512 samples, one extracts a total of�+ 4features. A three-level decomposition of a sub-frame gives 4 features, thus over the 24ms frame duration there will be a total of 16 features. The level of decomposition is increased to 7, giving the lowest frequency band of 0172.4 Hz. Any further decomposition is not expected to improve upon the recognition performance, as very low frequency content will be insignificant and will not have discriminatory information.
Once extracted the features, the problem is to obtain a discriminant function to separate the different classes in feature space. The Fig. 2 presents a summary of the proprosed algorithm.
The classifier used to classify the attributes extracted is an MLP neural network with two layers, being one hidden layer whose number of neuronsqhas been determined using the Kolmogorov’s rule, �= 2�+ 1, where nis the number of attributes used in classification. The parameters of neural network are chosen to obtain a more accurate and are 200 training epochs, MSEdesired10−4, learning factor of0.01
and momentum factor of 0.2.
Figure 2. Summary of the algorithm used for analyzing the voice signal.
drawn from 20 independent simulations. V. RESULTS
This section describes the results of this work and as-sessments based on the metrics described in the previous section.
Table I
CLASSIFICATION PERFORMANCEFOR THECLASSES:HEALTHY VOICE,
VOCAL FOLD NODULES ANDREINKE’SEDEMA.
Level Recognition rates(%)
DWT minimum average maximum standard deviation
3 79.35 82.23 84.51 1.98
4 88.38 90.01 91.95 1.30
5 89.53 90.27 90.93 0.55
6 91.57 93.03 94.00 0.70
7 84.51 86.63 88.32 1.67
The statistics of success rate and standard deviation of the accuracy rate obtained by the proposed method, using samples of healthy voice, vocal nodules and Reinke’s edema are shown in Table I, where it is observed that the average rate of success ranges from 82% and 94%. The best result was obtained for a wavelet decomposition level 6 in each sub-frame.
The average hit rates for the three classes analyzed is shown in Table II. In this table it appears that the best results for classes Reinke’s edema and vocal nodules occur to a wavelet decomposition level 6, with rates above 90%. As for the class of healthy voices, the best result occurred for level 7, with almost 100% accuracy.
The average hit rates by class for the configuration with six levels of wavelet decomposition in each sub-frame, highlighted in the Table II, where all classes had an average success rate above 90%, demonstrate that the proposed
Table II
CLASSIFICATION PERFORMANCEFOREACH CLASS(VOICEHEALTHY, VOCAL FOLD NODULES ANDREINKE’SEDEMA).
Level Rating (%)
DWT Reinke’s ed. Nodules Healthy
3 81.27 74.71 94.61
4 89.50 88.62 92.05
5 87.41 89.25 94.39
6 91.19 90.37 97.46
7 82.47 81.91 99.51
approach allows to discriminate these two diseases of the larynx with good probability of success.
Table III
CLASSIFICATION PERFORMANCEFOR ALL CLASSES.
Level Recognition rates(%)
DWT minimum average maximum standard deviation
3 76.37 77.15 78.22 0.68
4 77.34 79.41 81.05 1.37
5 78.22 79.45 80.66 1.16
6 85.35 86.86 89.16 1.41
7 87.70 89.14 90.53 1.30
Table IV
CLASSIFICATION PERFORMANCEFOREACH CLASS(INCLUDING NEUROLOGICAL DYSPHONIA).
Level Rating (%)
DWT Reinke Nodules Neurological Healthy
3 79.33 78.18 74.07 76.89
4 83.76 79.09 72.43 82.31
5 82.55 77.26 74.50 83.38
6 88.15 84.14 81.85 93.14
7 87.61 86.56 89.40 93.33
Including the class of people with neurological dysphonia, it occurs a decrease of 7% in average hit rate for the con-figuration with 6 levels DWT in each sub-frame, as shown in Table III. To obtain similar results to those obtained with only three classes, it was necessary to increase the number of wavelet decomposition levels, i.e., the number of extracted features. This reduction in classification performance with the addition of Neurological Dysphonia class occurs due to this class has some characteristics similar to the spectral class voice healthy and to have voice samples from patients with different neurological diseases.
VI. CONCLUSION
This study explored the power of a mathematical tool widely known, Discrete Wavelet Transform, to extract char-acteristics of voice signals, allowing classifying them using artificial neural network MLP in four possible classes: healthy, nodules, Reinke’s edema and neurological dyspho-nia.
The results presented indicate that the proposed method is quite effective to achieve results equivalent to those
presented in other studies [1], [4] with the same bank samples, but using different methods for feature extraction. In addition the proposed approach obtained classification rates equal to or greater than other studies [7], [8] using the traditional approach to feature extraction with DWT.
These results demonstrate that the proposed approach not only allows discriminating healthy and pathological voices with accuracy rates above 90%, but it also allows to classify the voice samples in one kind of laryngeal pathology. Some improvements in the proposed method are being made to increase the separation between all classes, especially that of Neurological Dysphonia.
As future prospects, we intend to have a set of attributes that allow classifying the four classes of samples with rates close to those obtained with only three classes.
ACKNOWLEDGMENT
The authors would like to thank to Coordination for the Improvement of Higher Level Personnel (CAPES), Wireless Telecommunications Research Group (GTEL), Computer SystemsEngineering Laboratory (LESC) and Department of Teleinformatics Engineering (DETI), of Federal University of Cear´a (UFC), Brazil, by supporting this research.
REFERENCES
[1] P. R. Scalassara, M.E. Dajer, C. D. Maciel, R. C. Guido, and J. C. Pereira, “Relative entropy measures applied to healthy and pathological voice characterization,”Applied Mathemat-ics and Computation, vol. 270, no. 1, pp. 95 – 108, 2009.
[2] I. C. Zwetsch, R. D. R. Fagundes, T. Russomano, and D. Sco-lari, “Digital signal processing for differential diagnosis of benign laryngeal diseases,” Scientia Medica, vol. 16, no. 3, September 2006.
[3] H. H. Falc˜ao, S. Correia, S. C. Costa, J. M. Fechine, and B. Aguiar Neto, “The use of entropy in pathological voices discrimination,”Salvador, Brazil, 2008.
[4] P. R. Scalassara, C. D. Maciel, R. C. Guido, J. C. Pereira,
E. S. Fonseca, A. N. Montagnoli, S. B. J´unior, L. S. Vieira, and F. L. Sanchez, “Autoregressive decomposition and pole tracking applied to vocal fold nodule signals,”Pattern Recog-nition Letters, vol. 28, no. 11, pp. 1360 – 1367, 2007.
[5] P. Hosseini, F. Almasganj, and M. Darabad, “Pathological voice classifcation using local discriminant basis and genetic algorithm,” in Control and Automation, 200816th Mediter-ranean Conference on, june 2008, pp. 872 –876.
[6] J. B. Alonso, F. D. de Mar´ıa, C. M. Travieso, and M. A. Fer-rer, “Using nonlinear features for voice disorder detection,” ITRWon Non-Linear Speech Processing, pp. 94–106, 2005.
[7] E. Fonseca and J. Pereira, “Normal versus pathological voice signals,” IEEE Eng. in Medicine and Biology Magazine, vol. 28, no. 5, pp. 44–48, september-october 2009.
[8] A. Parraga, “Application of wavelet packet transform in the analysis and classification of pathological signs and voices,” Master’s thesis, Federal University of Rio Grande do Sul, Brazil, School ofEngineering, 2002.
[9] M. B. Paula, “Spoken word recognition using artificial neural networks,”Monography Final Course, Federal University of Pelotas, Brazil.
[10] R. T. S. Carvalho, “Comparative study of feature extraction techniques for recognition of phonemes,”Monography Final Course, Depart. of Teleinformatics Eng., Federal University of Cear´a, Brazil, December 2009.
[11] M. Hirano, “Vocal mechanisms in singing: Laryngological and phoniatric aspects,,” Journal of Voice, vol. 2, no. 1, pp. 51 – 69, 1988.
[12] R.E. Hillman,E. B. Holmberg, J. S. Perkell, M. Walsh, and C. Vaughan, “Phonatory function associated with hyperfunc-tionally related vocal fold lesions,” Journal of Voice, vol. 4, no. 1, pp. 52 – 63, 1990.
[13] R. H. G. Martins, J. Defaveri, M. A. C. Domingues, R. de Al-buquerque e Silva, and A. Fabro, “Vocal fold nodules: Mor-phological and immunohistochemical investigations,”Journal of Voice, vol. 24, no. 5, pp. 531 – 539, 2010.
[14] B. M. J. Neves, J. G. Neto, and P. Pontes, “Histopathological and immunohistochemical differentiation of epithelial alter-ations in vocal nodules and polyps in relation to laryngeal edema,” Brazilian Journal of Otorhinolaryngology, vol. 70, pp. 439 – 448, 08 2004.
[15] M. Hirano, “Structure of the vocal folds in normal and disease states: anatomical and physical studies,”Proc. of the Conf. on the Assessment of Vocal Pathology, pp. 11–30, 1981.
[16] M. H. L. de Abreu, “Reinke’s edema: general aspects and treatment,”Monography Final Course.
[17] O. Kleinsasser,Microlaryngoscopy and Microsurgery of the Larynx. S˜ao Paulo, Brazil: Manole, 1997, vol. 2.
[18] M. Greene, Voice Disorders. S˜ao Paulo, Brazil: Manole, 1989, vol. 4.
[19] M. de Oliveira Rosa, J. Pereira, and M. Grellet, “Adaptive estimation of residue signal for voice pathology diagnosis,” IEEE Trans. on Biom. Eng., vol. 47, no. 1, pp. 96 –104, jan 2000.
[20] V. Uloza, V. Saferis, and I. Uloziene, “Perceptual and acoustic assessment of voice pathology and the efficacy of endolaryn-geal phonomicrosurgery,”Journal of Voice, vol. 19, no. 1, pp. 138 – 145, 2005.
[21] O. Farooq and S. Datta, “Phoneme recognition using wavelet based features,”Information Sciences, vol. 150, no. 1-2, pp. 5–15, Mar 2003.
[22] O. Rioul and M. Vetterli, “Wavelets and signal processing,” Signal Processing Magazine, IEEE, 1991.
![Figure 1. The video-laryngoscope images were collected at the Otolaryn- Otolaryn-gology Department and the Head and Neck Surgery Department of the Medical School at Ribeirao Preto, State of Sao Paulo, Brazil [1].](https://thumb-eu.123doks.com/thumbv2/123dok_br/15249874.537930/2.918.483.834.374.504/laryngoscope-collected-otolaryn-otolaryn-department-surgery-department-ribeirao.webp)