Rev Bras
Cineantropom
Hum
DOI: http://dx.doi.org/10.5007/1980-0037.2017v19n3p309
original article
Peak height velocity in anthropometry and body
composition of students
Pico de velocidade de crescimento em antropometria e
composição corporal de escolares
Edilson Hobold1,2
Lucinar Jupir Forner Flores1
Ricardo Brandt1
Oldemar Mazzardo Junior1
Miguel de Arruda2
Abstract – he aim of this study was to analyze the age of Peak Height Velocity (PHV), anthropometric variables and body composition of students from the western state of Paraná. he study included 1,011 male students aged 12-15 years from 11 municipalities located around the Itaipu lake. Anthropometric and body composition variables were obtained according to international criteria. Biological maturation was determined by age of PHV and for the purpose of analysis, it was categorized into developmental levels. he results reinforce, as expected, an increasing trend of variables analyzed as students advanced in maturity. hus, it was concluded that with the advancement of maturation, anthropometric variables maintain a linear growth observed in each PHV stratum. his linear trend is not observed in body composition. Body fat showed a decrease in average values as the individual approaches PHV.
Key words: Adolescent; Anthropometry; Body Composition; Growth.
Resumo – O objetivo deste estudo foi analisar a idade do PVC, variáveis antropométricas e composição corporal de estudantes da região do estremo oeste do Paraná. Participaram do estudo 1.011 escolares do sexo masculino de 12 a 15 anos de 11 municípios localizados no entorno do lago de Itaipu. As variáveis antropométricas e de composição corporal foram obtidas seguindo os critérios internacionais. A maturação biológica foi determinada pela idade do PVC e para efeito de descrição e análise foi categorizada em estratos. Os resultados reforçam, conforme esperado, uma crescente evolução das variáveis analisadas à medida que os escolares avançaram na maturação. Sendo assim, concluímos que com o avanço da maturação as variáveis antropométricas mantêm um crescimento linear que é observado em cada estrato do PVC. Este comportamento linear não é observado na composição corporal. O percentual de gordura apresenta uma diminuição de seus
1 Western Parana State University. Physical Education Program. Mare-chal Cândido Rondon, PR. Brazil.
2 University of Campinas. Physical Education College. Graduate Program in Physical Education. Campinas, SP. Brazil.
Peak height velocity in students Hobold et al.
INTRODUCTION
Adolescents undergo skeletal, neuroendocrine transformations, and sexual maturation, thus, the anthropometric and body composition evaluation be-comes necessary to follow the entire process of growth and development1,2. he peak height velocity (PHV) is one of the most used indicators in studies that investigate the maturation processes in adolescents3-5, and may appear as an alternative of biological classiication. he moment the individual reaches PHV can be estimated by monitoring the growth of body structures. Although it is possible to determine the peak velocity of height, body weight, skinfolds, among others, the somatic landmark most used in studies on growth and maturation is the age of peak height velocity6. By objectively measuring physical growth rates, it is suggested that children should be stimulated according to biological development as opposed to chronological age, adding individualized aspects to physical development during a phase of signiicant increases in somatic growth.
Originally, to use PHV, several measures were required during a given growth period, making this methodology impracticable for cross-sectional investigations, when only a single measurement was possible7. herefore, researchers3 developed a practical technique with good reliability (r2 = 0.89) and with low standard error of estimation (SEE = 0.569). It is a noninvasive technique that requires a single evaluation of a few anthropometric variables, capable of predicting the distance in years from the individual´s age at PHV.
Using the known diferential synchronisms of height, trunk-cephalic height, and lower limb length, it is possible to assume that the proportional relations of change between these segments can provide an indication of maturational status6. In this model, interactions between leg length and trunk-cephalic height, age and leg length, age and trunk-cephalic height, as well as between weight and height ratio were included.
In the literature7, there are few epidemiological studies that have used PHV as an indicator of somatic maturation, especially involving schoolchildren. herefore, the aim of this study was to describe the values of anthropometric and body composition variable by age at Peak Height Velocity in students aged 12-15 years.
METHODOLOGICAL PROCEDURES
Faculty of Medical Sciences of the State University of Campinas - FCM / UNICAMP, through protocol No. 370/2011, according to Resolution 196/96 of the National Health Council.
In order to assemble the thesis database, a survey, with the collaboration of the State Department of Education (SEED-PR), and the Municipal Secretaries of Education, was carried out to identify the total number of schools and students in each of the participating municipalities. hirty-four schools were randomly selected, considering only the geographic location, aiming to achieve a signiicant representation of the municipalities´ pop-ulations. he sample of each municipality was randomly established con-sidering the proportionality of students in each school region. he sample size was calculated in a stratiied probabilistic manner for each sex and age group separately, following the procedure: ICA = SN / N and n = ICA x SN. Where: ICA = Sample Calculation Index; SN = Sub-Universe; N = Universe; n = calculated sample size. Exclusion criteria were: presence of pathologies, the non-delivery of the informed consent form duly signed by parents or legal guardians and non-attendance in data collection.
Speciically for this study, data corresponding to sex and age group were used, therefore, the present sample was composed of 1,011 male students. he selection of 12 to 15-year-old males was based on the study of Malina and Koziel8, who concluded that PHV is inluenced by chrono-logical age and by the state of real maturity, suggesting that this somatic evaluation technique has applicability in boys who are in the maturation period and during the growth spurt that occurs approximately between 12 and 15 years of age.
Body weight, height, sitting height, tricipital and subscapular skinfold measurements followed well known international protocols9,10. Fat percent-age was computed using the predictive equation of Lohman11.
The chronological age of students was decimally determined by comparing the date of birth and the date of data collection, according to established criteria12.
Data quality control
he Technical Error of Measurement - TEM was calculated to demonstrate the measurement quality control dimension adopted by the International Society for Advancement in Kinanthropometry – ISAK13.
he TEM calculation was performed between the two evaluators who performed the collections (Inter-raters) on height (TEM = 1.2%), body mass (TEM = 1.1%) and sittingd height (TEM = 1.6%). he calculation of skinfold TEM was performed by a single evaluator (Intra-evaluator), triceps skinfold (TEM = 4.6%) and subscapular skinfold (TEM = 5.3%). he results have shown acceptable values of relative TEM according to criteria adopted by the International Society for Advancement in Kinan-thropometry – ISAK13, indicating good reliability of measurements.
Peak height velocity in students Hobold et al.
Mirwald et al.3 were used, which are diferentiated by sex.
• Male
PHV = -9.236 + 0.0002708 (LLxCT) - 0.001663 (AGExLL) + 0.007216 (AGExCT) + 0.02292 (BW / STA)
Where: LL is the leg length (cm) obtained by the difference between height (STA) in centimeters and cephalic trunk height (CT), SH is the sitting height (cm), decimal age measured in years, BW is body weight (kg).
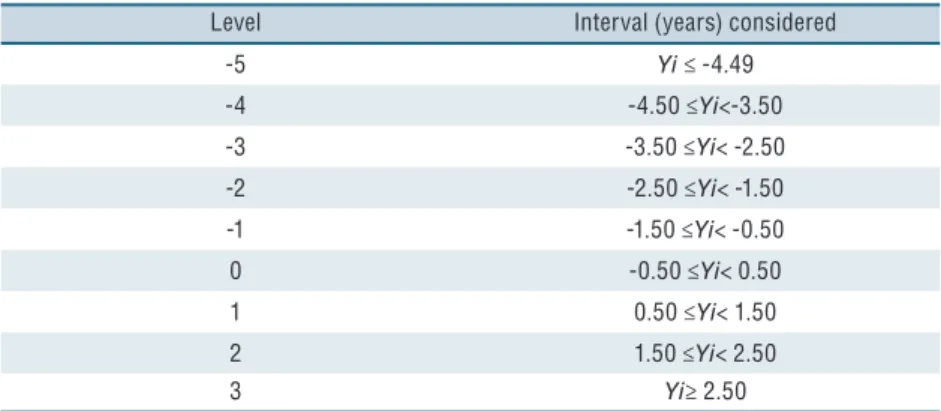
For purposes of analysis, the adolescents were grouped into PHV categories deined according to Table 1.
Table 1. Peak of Growth Velocity Classification.
Level Interval (years) considered
-5 Yi ≤ -4.49
-4 -4.50 ≤Yi<-3.50
-3 -3.50 ≤Yi< -2.50
-2 -2.50 ≤Yi< -1.50
-1 -1.50 ≤Yi< -0.50
0 -0.50 ≤Yi< 0.50
1 0.50 ≤Yi< 1.50
2 1.50 ≤Yi< 2.50
3 Yi≥ 2.50
Source: Machado and Bonfim14
Statistical treatment
Statistical analyses were performed with statistical software SPSS for Win-dows® - version 15.0. he students were grouped by PHV age aiming the analysis and description of results. To characterize the sample, parametric measures of central tendency were calculated (Mean and standard devia-tion). Measurements of all variables showed normal distribution observed in the K-S distance test (Kolmogorov-Smirnov).
In order to identify the diferences of independent variables among PHV levels, one way ANOVA was used considering one factor (PHV) followed by the Tukey Post-hoc test. For all analyses, the statistical sig-niicance level adopted was less than or equal to 5%.
RESULTS
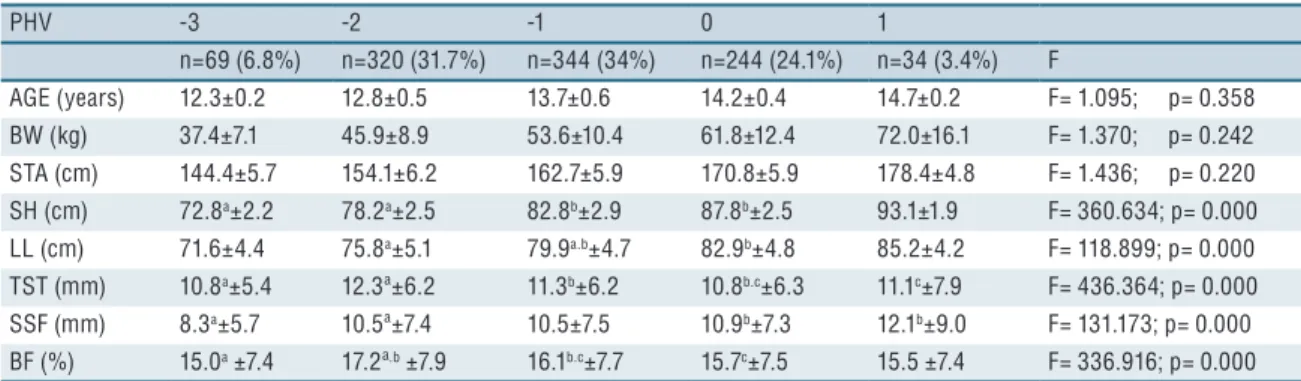
thick-increase in values between PHV strata -3 and -2, followed by a decrease in strata -1, 0 and 1. he highest value was observed in PHV stratum -2 (17.26 ± 7.99%). In PHV, the mean body fat percentage value was 15.77 ± 7.57% (Table 2).
he one factor analysis of variance (PHV) indicated statistically sig-niicant diferences among strata in some of the factors compared (Table 2).
Table 2. Description of anthropometric variables (ẍ / ±) according to PHV classifications of male adolescents aged 12-15 years (n = 1,011) living in municipalities around the Itaipu lake in western Paraná State.
PHV -3 -2 -1 0 1
n=69 (6.8%) n=320 (31.7%) n=344 (34%) n=244 (24.1%) n=34 (3.4%) F
AGE (years) 12.3±0.2 12.8±0.5 13.7±0.6 14.2±0.4 14.7±0.2 F= 1.095; p= 0.358 BW (kg) 37.4±7.1 45.9±8.9 53.6±10.4 61.8±12.4 72.0±16.1 F= 1.370; p= 0.242 STA (cm) 144.4±5.7 154.1±6.2 162.7±5.9 170.8±5.9 178.4±4.8 F= 1.436; p= 0.220 SH (cm) 72.8a±2.2 78.2a±2.5 82.8b±2.9 87.8b±2.5 93.1±1.9 F= 360.634; p= 0.000
LL (cm) 71.6±4.4 75.8a±5.1 79.9a.b±4.7 82.9b±4.8 85.2±4.2 F= 118.899; p= 0.000
TST (mm) 10.8a±5.4 12.3ª±6.2 11.3b±6.2 10.8b.c±6.3 11.1c±7.9 F= 436.364; p= 0.000
SSF (mm) 8.3a±5.7 10.5ª±7.4 10.5±7.5 10.9b±7.3 12.1b±9.0 F= 131.173; p= 0.000
BF (%) 15.0a ±7.4 17.2ª.b ±7.9 16.1b.c±7.7 15.7c±7.5 15.5 ±7.4 F= 336.916; p= 0.000
Letters indicate significant differences p <0.05. BW = Body Weight; STA = Height; SH = Sitting Height; LL = Leg Length; TST = Tricipi-tal skinfold thickness; SSF = Subscapular skinfold thickness; BF = Body Fat Percentage.
DISCUSSION
he age at PHV, calculated in the present study, was 14.2 ± 0.5 years. Machado and Bonin14 developed a cross-sectional study with Brazilian soccer practitioners using the same methodology of this study and found an average age PHV corresponding to 14.7 years. his value is close to that observed in students of our study. In a longitudinal study, with 70 students aged 10-14 years, earlier PHV, between ages of 12 and 13, was observed15, when controlling for height, body weight, tricipital and sub-scapular skinfold thickness.
A cross-sectional study16 involving schoolchildren identiied PHV at 13.4 years. Two other studies17,18 found PHV values at 13.8 years. In general, the PHV age of participants of this study difers from most studies, since it occurs at later age. Malina et al.19 analyzed a series of European studies involving male subjects and identiied that PHV occurred between 13.8 and 14.2 years of age and reported a probable interference of sociocultural and ethnic factors in PHV variations.he mean age PHV in the European studies, 14.2 years, is similar to the age PHV in the present study.
When analyzing the anthropometric measurements by PHV strata, the results are similar to results obtained in another study8. Small variations in mean values were observed in variables height, body weight, trunk-cephalic height and leg length.
Peak height velocity in students Hobold et al.
identiied an increase in total height of 25.9 cm but diferent in body weight (20.8 kg). Another variable they analyzed was the sum of tricipital and subscapular skinfolds thickness, where a reduction of 1.34mm was observed15, whereas in the present study, the alterations in this variable was lower (0.95mm). A longitudinal study investigating changes in growth and performance of soccer athletes18 indicates that PHV coincides with the peak weight velocity. Our data corroborate the hypothesis that these variables show parallel increases.
For the analysis of body fat percentage, the descriptive form classiied by PVC strata was adopted, and signiicant oscillations were observed in most strata.
he cross-sectional design is a study limitation because it makes it impossible to establish cause and efect relations. he study sample, which is limited to the male adolescent population of a region of the State of Paraná characterized by municipalities with high HDI and ethnic descent population are also limitations.
CONCLUSION
he results of the present study demonstrated that with the advancement of maturation, the anthropometric variables maintain a linear growth that is observed in each PHV stratum. his linear trend is not observed in body composition. Fat percentage presents a decrease in average values mainly near the maximum peak of maturation.
REFERENCES
1. Portas MD, Parkin G, Roberts J, Batterham AM. Maturational efect on
fuc-tional movement screen score in adolescente soccer player. J Sci Med Sport 2016; 19(10):854-8.
2. Pérez BM, Serrano MDM, Martínez CP, Viramontes JÁ, Armesillas MDC.
Assessment of somatic maturation of Venezuelan adolescents. Nutr Hosp 2015;32(5):2216-22.
3. Mirwald RL, Baxter-Jones ADG, Bailey DA, Beunen, GP. An assessment of
ma-turity from anthropometric measurements. Med Sci Sports Exer 2002;34(4):89–94.
4. Malina RM, Bouchard C, Bar-Or, O. Growth, Maturation, and Physical Activity.
Champaign, Illinois: Human Kinetics. 2004. 712p.
5. Aerenhouts D, Clarys P, Taeymans J, Cauwenberg JV. Estimating body
composi-tion in adolescente Sprint athletes: Comparison of diferente methods in a 3 years longitudinal design. Plos One 2015 10(8): e0136788.
6. Baxter-Jones ADG, Eisenmann JC, Sherar LB. Controlling for maturation in
pediatric exercise science. Pediatr Exerc Sci 2005;17(1):18-30.
7. Granados A, Gebremariam A, Lee JM. Relationship between timing of peak
heigh velocity and pubertal staging in boys and girls. J Clin Res Pediatr Endocrinol 2015;7(3):235-7.
8. Malina, RM, Koziel SM. Validation of maturity ofset in a longitudinal sample
of Polish boys. J Sports Sci 2014;32(5):424-37.
9. Gordon CC, Chumlea WC, Roche AF. Stature, recumbent length and weight.
Rev Bras Cineantropom Desempenho Hum 2017, 17(3):309-315 315
CORRESPONDING AUTHOR Edilson Hobold
Rua Paraná, 790 – Apto. 902 - Centro
CEP 85960-000 - Marechal Cândido Rondon, PR. Brasil
Email: [email protected]
AF, Matorell R, Editores. Antropometric standardization reference manual. Champaign, Illinois: Human Kinetics, 1988. p.55-70.
11. Lohman TG. Aplicability of body composition techniques and constants for
chil-dren and youth. J Phys Educ Recreat Dance 1986;58(9):98-102.
12. Ross WD, Marfell-Jones MJ. Kinanthropometry. In: Macdougall JD, Wenger
HA, Green HJ, Editors. Physiological testing of the high performance athlete (2nd ed.). Champaign, Illinois: Human Kinetics;1991.p.223-308.
13. Norton K; Olds T. (Eds). Antropométrica. Porto Alegre: Artmed, 2005.
14. Machado DRL, Bonim MR, Costa LT. Pico de velocidade de crescimento como
alternativa para classiicação maturacional associada ao desempenho motor. Rev Bras Cineantropom Desempenho Hum 2009;11(1):14-21.
15. Bergmann GG, Bergmann MLA, Lorenzi TDC, Pinheiro ES, Garlipp DC,
Moreira RB et al. Pico de velocidade em estatura, massa corporal e gordura sub-cutânea de meninos e meninas dos 10 aos 14 anos de idade. Rev Bras Cineantropom Desempenho Hum 2007;9(4):333-8.
16. Iuliano-Burns S, Mirwald R, Bailey D. Timing and magnitude of peak height
velocity and peak tissue velocities for early, average, and late maturing boys and girls. Am J Hum Biol 2001;13(1):1-8.
17. Sherar LB, Mirwald RL, Baxter-Jones, ADG, homis M. Prediction of adult
height using maturity based cumulative height velocity curves. J Pediatrics 2005;147(4):508-14.
18. Philippaerts RM, Vaeyens R, Janssens M, Van Renterghem B, Matthys D, Craen
R et al. he relationship between peak height velocity and physical performance in youth soccer players. J Sports Sci 2006; 24(3): 221–30.
19. Malina RM, Bouchard C, Bar-Or O. Crescimento, maturação e atividade física.