revbrashematolhemoter.2016;38(2):172–174
w w w . r b h h . o r g
Revista
Brasileira
de
Hematologia
e
Hemoterapia
Brazilian
Journal
of
Hematology
and
Hemotherapy
Letter
to
the
Editor
Trends
in
mortality
due
to
myeloid
leukemia
in
regions
of
Brazil
and
the
country
as
a
whole
between
1980
and
2012
DearEditor,
Weread with great interest the article entitled “Trends in mortalityofadultpatientsdiagnosedwithmyeloidleukemia from 1994to 2011in southeastern Brazil”by Calleraet al. publishedintheRevistaBrasileiradeHematologiaeHemoterapia (2015;37(1):7–11),1andwewouldliketomakesomecomments. Thesubject ofthe article is very importantfor clinical oncologyandcancersurveillanceasitpresentsatimeseries analysisshowingadecliningtrendinmortalityfrommyeloid leukemiainoneareaoftherichestregionofBrazil.Itis under-stoodthatthisdeclineisaresultoftheimprovingqualityof accesstohealthserviceswithearlydiagnosisofthedisease andclinicalmanagement.However,Brazilisthesizeofa conti-nentaland,therefore,webelieveitisimportanttoobservethe trendofmortalityduetomyeloidleukemiainotherregionsof Brazilandthecountryasawhole.
In2014,theBrazilianNationalCancerInstituteestimated the incidenceofleukemia inBrazil tobearound 5050and 4320new casesfor menand women, respectively. Exclud-ingnon-melanomaskintumors,leukemia isthefifthmost common cancer in men in the Northern Region of the country (3.57/100,000) and in the Northeastern Region, it isthe eighthmostcommon (4.15/100,000).However,inthe South (8.13/100,000), Southeast (5.42/100,000) and Midwest (4.14/100,000), it is ranked the tenth most common can-cer.For women, it isthe seventh mostcommon cancer in the North (2.81/100,000), the eighth most common in the South(6.30/100,000)andintheNortheast(3.40/100,000),itis rankedthetenthmostcommonmalignancy.IntheSoutheast (4.50/100,000) and Midwest (3.41/100,000),it isthe eleventh mostfrequent.2
Thisinconsistencyhasbeenobservedworldwide. GLOBO-CAN estimates the global prevalence of leukemia to be 4.7/100,000inhabitants.Thesamereportshows,however,that thereare differencesintherateswhencomparingmedium (3.8/100,000) and under (2.5/100,000) developed countries. Withregard tomortality, the globalestimate is3.4/100,000
inhabitants,3.2/100,000formediumand2.4/100,000forunder developmentcountries.3
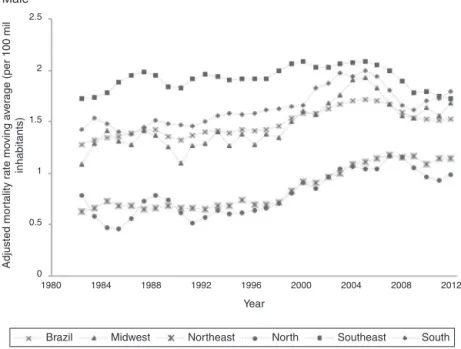
By using a methodology4 similar to Callera et al.,1 we identifiedimportantdifferencesindifferentBrazilianregions. Myeloidleukemiamortalityratesbetween1980and2012are different when stratified by gender. The rates in men are consistentlyhigher[in1987inBrazil(24.65%),in1988inthe Midwest(42.71%),in1982intheNortheast(40.78%),in1985in theNorth(71.79%)and,morerecently,in2003intheSoutheast (26.13%)andtheSouth(34.67%)],whichmaypointto impor-tantdifferencesbetweenthegenders.Inaddition,theratesare consistentlyhigherintheSoutheastandSouth,regardlessof gender,whichshowsregionaldifferencesintheimpactofthe disease(Figure1).
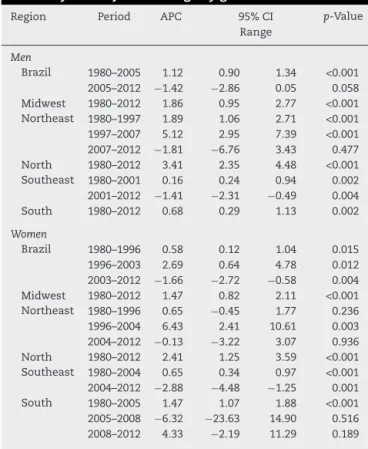
Regardingthetrend,thereisadifferencerelatedto gen-der and region.For males,there wasasignificant increase intheincidenceratesinBrazilbetween1980and2005.After 2005, there was a statistically non-significant drop in the rates.IntheMidwest,NorthandSouth,thereweresignificant andlinearincreasesfortheentireperiod.FortheNortheast, therewere twoperiodsofsignificantincreases(atdifferent degrees):1980–1997and1997–2007.Sincethen,therehasbeen nosignificant decrease.TheSoutheasthasshowna signifi-cantreductioninratesfrom2001,afteraperiodofsignificant increasesbetween1980and2001.
For women, Brazil has seen a statistically significant declinesince2003,althoughtherateincreasedbetween1980 and 1996,and from 1996to2003,bydifferentextents.The Northern region and Midwest have had significant linear increases in rates for the whole period, similar to males. TheNortheast has shownacyclicfluctuation, witha non-significant increase between 1980 and 1996, a significant increasebetween1996and2004,andanon-significantdecline between2004and2012.TheSoutheastandSouthshowed sig-nificantincreasesbetween1980and2004,and1980and2005. Afterthat,anon-significantdecreasewasseen(Table1).
revbrashematolhemoter.2 0 1 6;38(2):172–174
173
2.5
2
1.5
1
0.5
0
2
1.8
1.6
1.4
1.2
1
0.8
0.6
0.4
0.2
0
1980 1984 1988 1992 1996
Year
Midwest Brazil
Female Male
Northeast North Southeast South
2000 2004 2008 2012
1980 1984 1988 1992 1996
Year
Midwest
Brazil Northeast North Southeast South
2000 2004 2008
Adjusted mor
tality r
ate mo
ving a
ver
age (per 100 mil
inhabitants)
Adjusted mor
tality r
ate mo
ving a
ver
age (per 100 mil
inhabitants)
2012
Figure1–Trendinmortalityratesduetomyeloidleukemiaadjustedforagebygender.
strategieshaveprovidedincreasedsurvivalratesforpatients sufferingfrommyeloidleukemia.5Bothincidenceand mor-talityratesaredifficulttointerpretbecauseleukemiaisoften diagnosedincidentallyorwhileevaluatingotherconditions. Therefore,differencesinmedicalcaremaybeasubstantial biasinrespecttoincidencedata.Moreover,duetodifferences inaccesstotreatment, thereare considerablevariationsin survivalratesworldwide,whichmayexplainthedifferences intheratesinspecificregionsofBrazil.
There are alsohuge regionaldifferences related to sec-ondarypreventionstrategies,whicharebetterintheSouth and Southeast, and worse in the North and Northeast. Nonetheless, some particularities ought to be considered
whendiscussingriskfactors.For example,thereare places intheNorthwherethesoilhasanaturalsourceofradiation andBrazilhasthehighestrateofpesticideuseintheworld.
Finally, drops inmortality ratesare associatedwith the improvementoftheuseofantibiotics,suchasvoriconazole, caspofunginandpiperacillin/tazobactam,whichhavelow tox-icity(lessrenalandhepaticlesions).
174
revbrashematolhemoter.2 0 1 6;38(2):172–174Table1–Annualpercentagechangeintheleukemia
mortalityrateadjustedforagebygender.
Region Period APC 95%CI p-Value
Range
Men
Brazil 1980–2005 1.12 0.90 1.34 <0.001 2005–2012 −1.42 −2.86 0.05 0.058 Midwest 1980–2012 1.86 0.95 2.77 <0.001 Northeast 1980–1997 1.89 1.06 2.71 <0.001 1997–2007 5.12 2.95 7.39 <0.001 2007–2012 −1.81 −6.76 3.43 0.477 North 1980–2012 3.41 2.35 4.48 <0.001 Southeast 1980–2001 0.16 0.24 0.94 0.002 2001–2012 −1.41 −2.31 −0.49 0.004
South 1980–2012 0.68 0.29 1.13 0.002
Women
Brazil 1980–1996 0.58 0.12 1.04 0.015
1996–2003 2.69 0.64 4.78 0.012
2003–2012 −1.66 −2.72 −0.58 0.004 Midwest 1980–2012 1.47 0.82 2.11 <0.001 Northeast 1980–1996 0.65 −0.45 1.77 0.236
1996–2004 6.43 2.41 10.61 0.003
2004–2012 −0.13 −3.22 3.07 0.936 North 1980–2012 2.41 1.25 3.59 <0.001 Southeast 1980–2004 0.65 0.34 0.97 <0.001 2004–2012 −2.88 −4.48 −1.25 0.001 South 1980–2005 1.47 1.07 1.88 <0.001 2005–2008 −6.32 −23.63 14.90 0.516 2008–2012 4.33 −2.19 11.29 0.189
APC:annualpercentchange;95%CI:95%confidenceinterval.
inBrazil,itisimportanttoidentifyareaswherethetrendis stillincreasinginordertoadaptpublichealthstrategiesfrom wherethetrendisdecreasingtoachieveapositiveresultin thecountryasawhole.
Conflicts
of
interest
Theauthorsdeclarenoconflictsofinterest.
r
e
f
e
r
e
n
c
e
s
1.CalleraF,CalleraAF,RosaES.Trendsinmortalityofadult patientsdiagnosedwithmyeloidleukemiafrom1994to2011 insoutheasternBrazil.RevBrasHematolHemoter.
2015;37(1):7–11.
2.InstitutoNacionaldeCâncerJoséAlencarGomesdaSilva. Coordenac¸ãodePrevenc¸ãoeVigilânciaEstimativa2014: IncidênciadeCâncernoBrasil.RiodeJaneiro:INCA;2014.
3.GLOBOCAN2012.Estimatedcancerincidence,mortalityand prevalenceworldwidein2012;2012.Availablefrom:
www.globocan.iarc.fr[cited2015April2][Internet].
4.KimHJ,FayMP,FeuerEJ,MidthuneDN.Permutationtestsfor Joinpointregressionwithapplicationtocancerrates.StatMed. 2000;19(3):335–51.
5.HamerschlakN.Myeloidleukemia:arewegettingbetter?Rev BrasHematolHemoter.2015;37(1):3–4.
RaphaelMendonc¸aGuimarães∗,JulianaValentimChaiblich,
BárbaraCamposSilvaValente
EscolaPolitécnicadeSaúdeJoaquimVenâncio(EPSJV),Riode Janeiro,RJ,Brazil
∗Correspondingauthorat:EscolaPolitécnicadeSaúdeJoaquim
Venâncio,Sala319,Av.Brasil4365,Manguinhos,RiodeJaneiro, RJ,Brazil.
E-mailaddress:[email protected]
(R.M.Guimarães).
Received4April2015 Accepted16December2015 Availableonline3February2016
http://dx.doi.org/10.1016/j.bjhh.2015.12.003