THIS REPORT WAS PREPARED BY TIAGO PASSOS, A MASTERS IN FINANCE STUDENT OF THE NOVA SCHOOL OF BUSINESS AND ECONOMICS, EXCLUSIVELY FOR ACADEMIC PURPOSES.THIS REPORT WAS SUPERVISED BY ROSÁRIO ANDRÉ WHO REVIEWED THE
VALUATION METHODOLOGY AND THE FINANCIAL MODEL. (SEE DISCLOSURES AND DISCLAIMERS AT END OF DOCUMENT)
See more information at WWW.NOVASBE.PT Page 1/35
M
ASTERS IN
F
INANCE
E
QUITY
R
ESEARCH
With plans to divest its international operations, Portugal’s domestic activity will drive BPI’s future growth. Nonetheless, the participation interest in Banco de Fomento Angola will still be an
important boost for BPI’s net income despite the expected loss of
its majority interest in 2016
Lower funding costs will be the main driver of Portuguese banks recovery, and we expect BPI to follow the trend. Lower funding costs allied with a gradual decrease of impairments, with the improvement of credit quality, will bring BPI to positive domestic profit already in 2015
The economic outlook of Angola, motivated by the continuous falling of international oil prices, will pressure BFA’s contribution to the group. In the following years Angola’s financial institutions Sector will experience higher costs, namely funding and impairment costs, and a shortening of foreign reserves
BPI’s intention of divesting its African operations, keeping
only a minority interest in BFA, may open the possibility for a future consolidation in the Portuguese market
Our valuation was achieved through a sum of the parts methodology, in which the price target of €1.22 implies an upside
of 16% to the current share price of €1.19, and our
recommendation is to buy Company description
Established in 1981, is a Portugal-based financial institution company, focused on corporate and retail banking businesses, as well as, in the provision of investment banking and asset management services. Is Portugal’s fourth-largest financial institution in terms of total assets amounting €42.6bn in 2014.
B
ANCO
BPI
SA
C
OMPANY
R
EPORT
F
INANCIAL
I
NSTITUTIONS
8
J
ANUARY2016
S
TUDENT
:
T
IAGO
P
ASSOS
[email protected]
International operations to take the
backstage
Recovery to be driven by improved domestic trends
Recommendation: BUY
Vs Previous Recommendation Not rated
Price Target FY15: 1.22 €
Vs Previous Price Target Not rated
Price (as of 9-Jan-16) 1.05
Reuters: BBPI.LS, Bloomberg: BPI PL
52-week range (€) 0.760-1.570
Market Cap (€m) 1.531
Outstanding Shares (m) 1.457
Source: Analyst’s estimates and Blomberg
.800 1.00 1.200 1.400 1.600 jan -1 5 fe v -1 5 mar -1 5 a b r-1 5 ma i-1 5 jun -1 5 jul-1 5 a g o -1 5 s e t-1 5 o u t-1 5 n o v -1 5 d e z -1 5 jan -1 6
BPI Euro Stoxx Bank Index (rebased)
Source: DataStream
(Values in € millions) 2014 2015e 2016e Net Interest Income 514 563 332
Net Banking Income 858 1,079 693
Net Income 137 150 186
ROE -7.3% +6.0% +6.7%
ROA -0.1% 0.3% 0.4%
Loans/deposits 84% 84% 106%
RWA 22,934 23,055 23,707
Core tier 1 8.4% 9.% 9%
BANCO BPISA COMPANY REPORT
PAGE 2/35
Table of Contents
EXECUTIVE SUMMARY ... 3
BPI GROUP ... 3
HISTORY ... 4
SHAREHOLDER STRUCTURE ... 5
DOMESTIC MARKET
... 6
MACROECONOMICS ... 6
RESOLUTION FUND AND THE SALE OF NOVO BANCO ... 7
FUNDING STRUCTURE ... 8
Deposits ... 8
Transformation ratio ... 9
Debt securities & credit institutions’ resources ... 10
ECB funding ... 11
MAIN OPERATIONS ... 12
Credit portfolio ... 12
Financial assets portfolio... 14
REGULATORY CAPITAL ... 15
Capital requirements ... 15
Basel III ... 16
Pension fund... 17
PROFITABILITY ... 17
ANGOLA ...20
MACROECONOMICS ... 20
FINANCIAL SECTOR ... 21
FUNDING STRUCTURE ... 21
MAIN OPERATIONS ... 21
CAPITAL REQUIREMENTS ... 22
PROFITABILITY ... 22
VALUATION ...23
COST OF EQUITY ... 23
EQUITY INTEREST ... 24
PORTUGAL ... 25
ANGOLA ... 25
SUM-OF-THE-PARTS ...27
MULTIPLES ... 28
APPENDIX ...29
FINANCIAL STATEMENTS ... 29
VALUTATION: DCFE ... 33
VALUTATION: EQUITY METHOD ... 34
BANCO BPISA COMPANY REPORT
PAGE 3/35
Executive summary
A solid 2015 3Q performance seems to have set BPI in the right path to recover from the 2010 sovereign debt crisis. In fact, we believe that BPI will fully recover from the sovereign crisis by the end of 2017, beginning of 2018, driven by solid P&L trends in its domestic market, which will allow the management team to focus on growth strategies instead of restructuring plans.
As for BPI’s international operations the outlook is different: Banco de Fomento
Angola has been an important contributor for the group’s profit, easing the considerable losses of BPI’s domestic operations following the 2010 sovereign
crisis. However, Angola’s unfavourable economic outlook, as a result of a continuous falling of the international oil prices, allied with a sharp devaluation of its domestic currency, the kwanza (the kwanza currency devaluated by more than 20% between April and October of 2015), will impact the banks revenue and subsequent contribution to the BPI Group. Moreover, BPI will deconsolidate BFA from its accounts in 2016 by selling (or carving-out) part of its majority stake due to breaches in ECB regulations. Since the breach in large exposures needs to be solved until March 2016, we do not expect any gain on the sale of minority participation, and we believe that BPI will want to keep a stake of c.40% given the importance of the bank to the group and the money that was invested in it.
BPI Group
BPI Group, headed by Banco BPI, is a Portugal-based financial institution that offers financial services and products for corporate, institutional and individual customers.
BPI operates mainly in Portugal and Angola and is the fourth largest Portuguese private financial institution operating in Portugal (in terms of business volume), with a market capitalization of c.€1.6bn weighting 2.36% of the PSI-20 (as of 31/12/2014) and 0.77% in the Euronext Top 150 (as of 07/01/2015).
Portugal’s domestic market is the main activity of the BPI group, operating in commercial banking, investment banking and private equity & financial investments. The Group’s domestic operations serve more than 1.7m customers through a multi-channel distribution network comprising 495 retail branches, 39 investment centres and 51 corporate banking centers, supported by 5,934 employees (as of September 2015).
Angola is the main international activity of the BPI Group (more than 99% in terms of assets) operating through its 50.1% participation in Banco de Fomento Angola (BFA). BFA serves more than 1.4m customers through a distribution
Domestic operations valued at
€0.83 per share
BFA valued at €0.23 per
share
Figure 1 - BPI’s geographical footprint
BANCO BPISA COMPANY REPORT
PAGE 4/35 Notes: (1) A carve-out is a partial divestiture of a business unit; (2) Excluding Banco Económico, former BESA; (3) Caixa Geral de Depósitos owns a 51% stake in BCI
network comprising 165 retail branches, 9 investment centres and 16 corporate centres, supported by 2,618 employees (as of September 2015). In addition to that, BPI has a 30% participation in Banco Comercial e de Investimentos (BCI) in Mozambique, serving 1m customers, supported by a distribution network of 146 retail branches and 1 corporate centre.
Moreover, BPI Group announced on the 30th of September 2015 a Demerger Plan, approved by the Board of directors, entailing a carve-out(1) of the international operations (BFA, BCI and BPI Mozambique) from Banco BPI. Nonetheless, the Demerger Plan is still subjected to shareholders and regulatory approval and also to the approval of Unitel concerning the BFA divestment. Although there is no consensus between shareholders regarding the carve-out, we believe that the most likely outcome will result in BPI group detaining its domestic operations with only one minority interest stake in BFA (between 30% to 40%) and a complete divestment of its Mozambique operations.
History
BPI Group was created in 1981 by Artur Santos Silva as Sociedade Portuguesa
de Investimento (SPI), a well-defined project created with the purpose of financing investment projects launched by the private sector, participating in the creation of a dynamic capital markets and contributing to the country’s industrial modernization.
By 1985, SPI was converted into an investment bank, allowing it to attract deposits and grant loans, and, in the following year, SPI launched its IPO, being listed in the Lisbon and Oporto Stock Exchange.
Following the IPO, Banco BPIengaged in an acquisition strategy to leverage its growth. It started in 1998, with the integration of three banks, Banco Fonsecas & Burnay (BFB), Banco Fomento e Exterior (BFE) and Banco Borges & Irmão (BBI).
As shown by figure 2, from 1998 to 2002, BPI’ total assetshad a compounded annual growth rate (GAGR) of 13% reaching €26bn in 2002 with loans to customers representing over 75% of total assets.
The BPI Group saw its domestic position well consolidated in the early 20’s and decided to embrace an international expansion with the creation of Banco de
Fomento Angola in 2002, currently the 3rd largest bank in Angola(2), and, in the following year, acquiring a 30% stake of Banco Comercial e de Investimentos (BCI), a Mozambique retail bank focused on capturing customer resources and granting loans(3).
16 17
22 25
26
Total Assets
10 12
17 19
20
Loans to customers
9 9 10
11 12
Customer deposits 1998 1999 2000 2001 2002
Figure 2 –BPI’s steady growth
between 1998 and 2002 (€bn)
BANCO BPISA COMPANY REPORT
PAGE 5/35 Notes: (4) ROI is calculated taking into account the selling price (last closing market price) the initial price (IPO) and the total amount of dividends paid since the IPO
Shareholder structure
Banco BPI has a share capital of €1,293m, with 1,457m normative and
dematerialized ordinary shares held by 21,418 shareholders. From the total shareholders, c.98% are individuals owing 11.1% of BPI’s share capital and c.2% are institutional investors and companies owning 88.9% of the company’s share capital.
BPI’s concentrated shareholder structure (Figure 2) has 4 shareholders with a
stake higher than 2%. CaixaBank, Spain-based financial institution company offering banking, insurance and investment services, is the largest minority shareholder holding 44%, followed by Santoro Financial Holding, Angola-based company founded by Isabel dos Santos, daughter of Eduardo dos Santos, that also has a 49.9% participation in BFA. The two remaining shareholders are Allianz, German-based insurance company which has a partnership with BPI in the non-life and life-risk insurance business, and HVF (through Violas Ferreira Financial), a Portugal-based holding company.
Since the IPO (September 1986), until the last closing market price the annual average return (ROI(4)) of Banco BPI shares stands at 1.7%, underperforming the market (PSI Geral Index) that in the same period has a total return of 6.9%. If we
analyse the performance of the Banco BPI’s share price in the same period we
see that BPI share price is trading -13.9% below the IPO price, which means the
positive investors annual average return (ROI) comes from the company’s
dividend and buy-back policy (figure 3 displays the value creation and share price performance of Banco BPI).
In the past 3 years, BPI faced two main events that changed the shareholder structure of the Group. The most recent of these started on the 27th of May 2014, and ended on the 6th of June of the same year. It consisted in a Public Offer for
general and Voluntary Trade of Securities (“Oferta Pública de Troca geral e voluntária dos Valores Mobiliários”) by BPI shares. This offer increased the share
capital by 8.66% (€103 063 to €1 293 063). This increase diluted the stakes of
the La Caixa Group, Santoro and HVF SGPS, SA (interest held via Violas
Ferreira Financial, S.A.) and Allianz Group, BPI’s main shareholders. (Figure
displays the changes in BPI’s shareholder structure from 2011 until 1Q15) BPI had already suffered some important changes on its shareholders structure in 2012. Firstly, in April, La Caixa Group and Santoro (the two biggest shareholders of BPI) acquired in equal shares the 18.9% stake of Banco Itaú on BPI (held for almost two decades). Secondly, the Board of Directors of Banco BPI decided on 10 July 2012 to increase the share capital as part of the 9%
3% 9%
2% 9%
2% 9%
2% 8%
3%
Allia nz Gro up HVF Value creation
Banco BPI Market Last 1m (5.2%) (3.9%)
Last 3m
18.0% 3.8%YTD 5.4% 15.7%
Last 5y 0.1% (2.1%) Last 10y (6.8%) (0.1%) Since IPO 1.9% 6.9%
Share price performance
Banco BPI Last 1m 0.7% Last 3m 27.5%
YTD (23.9%)
Last 5y (9.9%) Last 10y (63.6%) Since IPO (5.1%)
30%
10% 46%
20% 46%
19% 46%
10% 44%
19%
CaixaBank San tor o
2011 2012 2013 2014 1Q15 CaixaBank
44%
Santoro Financial Holdings
19% Allianz Group
8% HVF
2% Others
27%
Figure 2 – Shareholder structure (03/2015)
Source: Company
Source: Company; DataStream
Figure 3 –BPI’s value creation and performance over the years
Figure 4 – Shareholder structure evolution since 2011
BANCO BPISA COMPANY REPORT
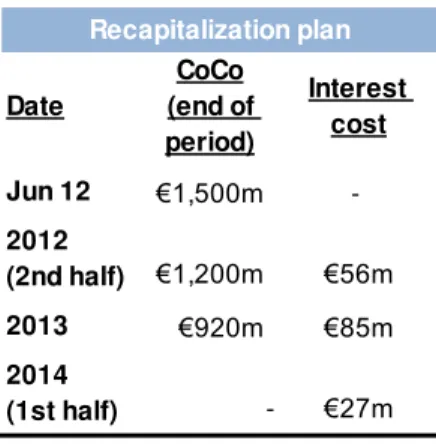
PAGE 6/35 Recapitalisation Plan approved by BPI’s shareholders in order to strengthen the
Core Tier 1 capital. Banco BPI, then, issued €1,500 million of Contingent
Convertible Subordinated Bonds (CoCos) subscribed by the Portuguese
government, aside with a capital increase of €200 million, in August 2012,
subscribed by the shareholders.
The expected divestment of BPI’s international operations in Africa, showing the
intention to keep only a minority stake in BFA, opens the possibility of market consolidation, with Caixa Bank being a good candidate for the acquisition of BPI (after failing a tender offer in 2015. As a result, there is a significant probability of future changes in the shareholder structure of BPI.
Domestic market
Macroeconomics
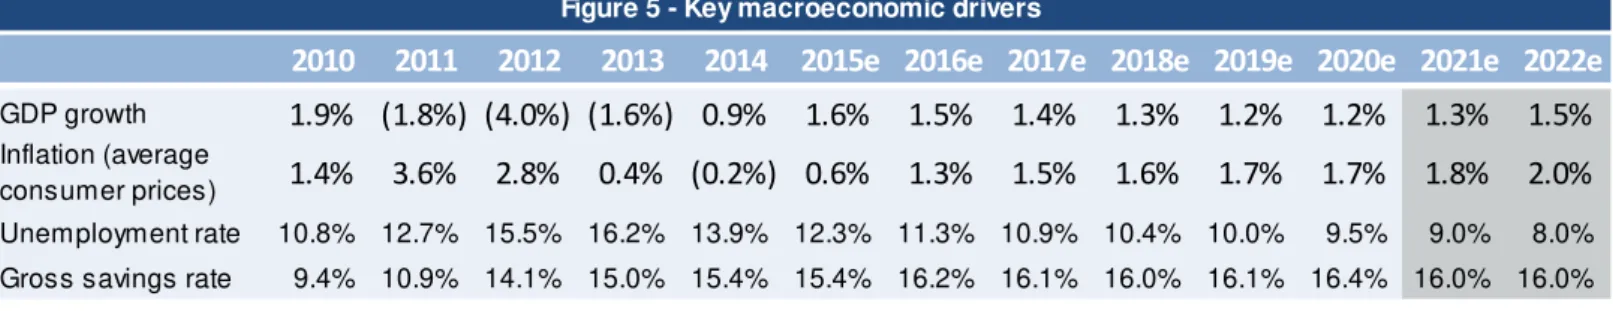
Portugal was the third country to leave its rescue program in May 2014, after Ireland became the first to do so in December 2013 followed by Spain in January 2014. After facing some severe austerity measures and a large number of restructuring reforms on many economic sectors, which continued after the rescue program, Portugal’s economic activity seems to have stabilized and continues to gather momentum driven by exports and private consumption. In 2014, GDP grew by 0.9% and accelerated in the first-half of 2015 by growing 1.6% y-o-y. However, the latest short-term indicators show a deceleration of growth in the second-half of 2015 due to weaker retail indicators and a slower pace of employment creation as capital stocks are rebuilt, following the decline in investment of nearly 35% between 2007 and 2014.
Moreover, Portugal faced a period of political instability (more than 20 days without government) after the elections in October 2015. The government named after the elections (right-wing colligation) was dissolved and, after an agreement between all the left parties, a socialist government was appointed by the President of the Republic. The main risks to the short-term macroeconomic outlook, lies in the ineffective implementation of policies, by the new left-wing alliance, to reduce the burden of private and public sector debt and to strengthen investment and job creation.
Figure 5 - Key macroeconomic drivers
2010
2011
2012
2013
2014
2015e 2016e 2017e 2018e 2019e 2020e 2021e 2022e
GDP growth
1.9% (1.8%) (4.0%) (1.6%) 0.9%
1.6%
1.5%
1.4%
1.3%
1.2%
1.2%
1.3%
1.5%
Inflation (average
consumer prices)
1.4%
3.6%
2.8%
0.4% (0.2%) 0.6%
1.3%
1.5%
1.6%
1.7%
1.7%
1.8%
2.0%
Unemployment rate 10.8% 12.7% 15.5% 16.2% 13.9% 12.3% 11.3% 10.9% 10.4% 10.0% 9.5% 9.0% 8.0%
BANCO BPISA COMPANY REPORT
PAGE 7/35 Notes: (5) Last intervention was on December 09, 2015; (6) Extended until March 2017 (may be further
extended);(7) Constituents of the Resolution Fund; (8) will not be the whole amount (€700m) since part of that
loss will be diluted by the contributions made by the institutions that didn’t subscribed the loan
Portugal’s borrowing costs also reacted to the Portuguese political situation
between October and November, with the Portuguese 10-year bond rate increasing to 2.54% (a 3-week high) in October, increasing the spread between the Portuguese and Spanish 10-year bond rates to 0.8%. The Spanish 10-year bond yield has been a good benchmark for the behaviour of the Portuguese 10-year bond yield as shown by figure 6.
The European Central Bank (ECB) continues to encourage liquidity into the Euro area. Besides keeping the key interest rates at historical low rates (the deposit facility rate was set at -0.3%, the main refinancing operations rate at 0.05% and the marginal lending facility rate at 0.3%)(5), the ECB launched in March 2015 a Public Sector Purchase Programme (PSPP)(6), targeting sovereign bonds and securities from European institutions and national agencies, in order to address a period of low inflation in the Eurozone and to stimulate the credit to the economy by lowering the funding costs.
Resolution Fund and the sale of Novo Banco
The Resolution Fund was created in 2012 with the objective of making available certain resources from the Bank of Portugal (BoP) to the application of resolution measures when a given financial institution would be in distress. It has 69 constituents that are obliged to make periodic contributions for the fund.
In August 03, 2014, BoP requested the Resolution Fund an amount of €4,900m
for the realization of Novo Banco’s equity. At that date, the Fund had collected
€377m through contributions and it was necessary to raise more than €4bn. The
lacking amount was covered through a state loan in the amount of €3,900m, with quarterly interest payments, and a loan conceded by a group of Financial Institutions(7), including BPI, in the amount of €700m that can only be restored after the State Loan is fully paid, with non-capitalized interest paid upon the amortization of the loan.
The way the finance aid was structured makes a group of financial institutions both creditors and contributors of the fund, which means that, if the amount received for the sale of NB is less than the sum of the amounts provided by the Fund, the proceeds will first be used to repay the State Loan and only then the credit institutions loan, and any loss on both loans will be supported by contributions made to the Fund. Since the contributions to the fund are made by financial institutions, the group that conceded the loan to NB may incur in a
maximum loss of €700m(8)
, jeopardising the welfare and recovery of the sector from the 2010 sovereign debt crisis.
2.4% 1.5% 2.3% 3.0% 2.7% 2.3% 1.5% 1.2% 1.8% 2.2% 2.0% 1.7% J a n -1 5 Feb -1 5 Ma r-1 5 A p r-1 5 May -1 5 J u n -1 5 J u l-1 5 A u g -1 5 S e p -1 5 O c t-1 5 N o v -1 5
Portuguese 10y Bond Spanish 10y Bond
Figure 8 - Inflation in the Euro Area (%) 2.0% 0.1% (1.0%) (0.5%) -0.5% 1.0% 1.5% 2.0% J a n -1 3 A p r-1 3 J u l-1 3 Oc t-1 3 J a n -1 4 A p r-1 4 J u l-1 4 O c t-1 4 J a n -1 5 A p r-1 5 J u l-1 5 Oc t-1 5 (0.5%) -0.5% 1.0% 1.5% 2.0% 2.5% 3.0% 3.5% D e c -0 8 A u g -0 9 A p r-1 0 D e c -1 0 A u g -1 1 A p r-1 2 D e c -1 2 A u g -1 3 A p r-1 4 D e c -1 4 A u g -1 5
Deposit facility MRO MLF
Figure 6 - Portugal vs. Spain (%)
Figure 7 - ECB’s key interest rates (%)
Source: ECB Source: DataStream
BANCO BPISA COMPANY REPORT
PAGE 8/35 Banco BPI contributed with €116.2m for the loan. Since the sale of NB will be completed in 2016 (according to BoP), the price that will be paid for NB will have
a significant impact on BPI’s 2016 domestic net profit, since it may incur on a loss
that may exceed €100m. Figure 9 displays some possible outcomes regarding
the sale of NB and the respective impact on BPI’s share price.
Funding structure
The funding structure of financial institutions is, since the 2010 sovereign debt crisis, a very central and important topic. Following the crisis, European regulators (following ECB directives) strengthened the financial institutions capital regulations, which lead to a wave of capital reinforcements. Portuguese financial institutions were forced to present restructuring plans to face the new regulations, which limited their ability to access the wholesale debt market funding increasing their dependence on the customer deposits funding. Going forward, the way financial institutions structure their funding will dictate the pace of expansion when the sector fully recovers. Solid funding structures with a strong customer deposits base will allow them (financial institutions) to place more products and still complying with the new banking regulations.
Deposits
Customer resources are the main source of funding of Group BPI accounting for more than 60% of the total liabilities in 2014. Growing at a slow pace in the beginning of the XXI century, BPI’s deposits account started experiencing a high growth rate in the beginning of 2005, a pace that lasted until the 1Q of 2009 with
almost €22bn of deposits. The Lehman Brothers’ bankruptcy in September 2008
followed by the European Sovereign Debt Crisis that started in the end of 2009 led to a short-period of mistrust on financial institutions. In Portugal, this mistrust was reflected through a considerable decrease on the deposits’ account of the
main financial institutions. Millennium BCP saw its domestic deposits’ account
36.1 36.1 36.0 36.0 35.4
34.5 35.1
1Q09 2Q09 3Q09 2009 1Q10 2Q10 3Q10
21.7 20.8
19.8 19.0
18.6 18.6 18.8
1Q09 2Q09 3Q09 2009 1Q10 2Q10 3Q10 Source: Analysts estimates
Figure 11 - BPI
(domestic deposits’ account -
€bn) Figure 10 - BCP (domestic deposits’ account -
€bn)
Source: Company
Source: Company
Figure 9 - Impact of the sale of NB (€m)
Purchase Price 3,500 3,900 4,000 4,500 4,900 5,000
Loss for State (400) - - - -
-Loss for Financial institutions (700) (700) (600) (100) -
-BPI stake on group loan 16.6% 16.6% 16.6% 16.6% 16.6% 16.6%
Potential loss for BPI (116) (116) (100) (17) -
-Impact on share price -2.4% -2.4% -1.8% 1.6% 2.2% 2.2%
Resolution Fund (300) (300) (300) (300) 300 400
BANCO BPISA COMPANY REPORT
PAGE 9/35
shrink by c.€1.5bn in the first 6 months of 2009 followed by Banco BPI, with a
decrease of c€1.2bn from the 1Q 2009 to the 2Q 2010, and with CGD registering
a decrease of c.€0.8bn in just 3 months (figure 10, 11 and 12).
In order to regain clients trust and attain more deposits, Portuguese Financial Institutions started increasing the interest rates paid to its deposits’ account (figure 12). This shift to a more aggressive strategy translated into a hog growth rate of Portuguese deposits but in expense of higher funding costs, which led the BoP to intervene, during the 1Q 2012, setting a roof for the maximum spread allowed to 300bp over the market rate (typically the 3m Euribor rate).
Recently, given the environment of low interest rates set by the European Central Bank (3m Euribor is trading at negative rates since May 2015), Portuguese financial institutions have been able to lower their interest rate costs as a way to improve/generate profits, since the credit to the economy (mainly the consumption and mortgage credit) has been contracting given the high levels of indebtedness of the private sector. We believe that rates will continue at low levels at least until mid-2017 and we expect interest rates to start increasing by 2018, when the ECB is expected to start easing some of the monetary policies implemented since the 2010 sovereign crisis.
Transformation ratio
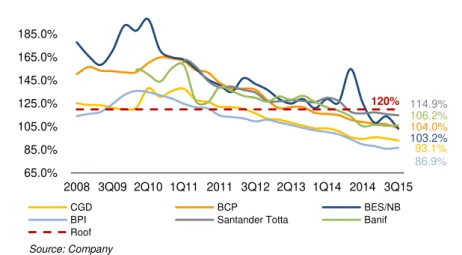
Following the Economic and Financial Assistance Programme (EFAP) to Portugal, which started in 2011, the Portuguese financial institutions were forced to keep a loan-to-deposit ratio below 120% by the end-2014. This measure intended to deleverage the banking sector and to promote stability.
Given the limitations in attracting customer savings due to the low interest rates environment, the deleveraging of the banking sector was achieved through a reduction in the credit: mainly the corporate and consumption credit given the limited ability of deleveraging through mortgage loans.
56.0 56.5 57.2 57.8
57.0 58.0 61.4
1Q09 2Q09 3Q09 2009 1Q10 2Q10 3Q10
-0.5% 1.0% 1.5% 2.0% 2.5% 3.0% 3.5% 4.0% 4.5%
2008 2009 2010 2011 2012 2013 2014
BPI CGD
BES/NB 3m Euribor
Figure 12 - CGD (retail deposits’ account - €bn)
93.1%
104.0%
103.2%
86.9% 114.9% 106.2% 120%
65.0% 85.0% 105.0% 125.0% 145.0% 165.0% 185.0%
2008 3Q09 2Q10 1Q11 2011 3Q12 2Q13 1Q14 2014 3Q15
CGD BCP BES/NB
BPI Santander Totta Banif
Roof
Source: Company
Source: Company
Source: Company
Figure 13 - Average deposit interest rates & 3m Euribor (%)
BANCO BPISA COMPANY REPORT
PAGE 10/35 Notes: (9) e.g. Funds, pension funds, asset managements
Figure 14 displays the evolution of the consolidated transformation ratio of the 6 largest Portuguese financial institutions.
We see that even after achieving ratios below the threshold, there was no need of further deleveraging, and the ratio continued to decrease. This continued decrease is explained in part by the high level of indebtedness of the private sector (figure 15 displays the debt as percentage of household disposable income), which discouraged the demand for new loans despite the incentives promoted by the ECB (increase of liquidity).
Nonetheless, we believe that the environment of low interest rates on deposits (both term and sight) will pressure the transformation ratios, as the economy recovers, for levels close to the ones recommended by the regulators (roof of 120%) limiting banks capacity to provide new loans when the demand for new credits starts to increase again.
Debt securities & credit institutions
’ resources
The 2010 sovereign debt crisis triggered a cut to junk of Portugal’s credit rating
by Moody’s, S&P and Fitch in 2011, and the country was forced to request an
assistance program with the European Union. This sequence of downgrades limited the access of the Portuguese financial institutions to the debt market since a large number of investment houses(9)arenot allowed to buy securities (bonds, equities, among others) that are classified as junk. As a result, the funding from debt security instruments decreased significantly as one can see in figure 16. Debt securities have been the second main source of funding for Banco BPI. Nonetheless, its percentage of the total domestic liabilities is relatively small when compared with its peers (figure 17).
We believe that BPI’s debt securities will continue at relatively low values (around
€1bn) in the next two years, given the low demand for such securities and some uncertainty regarding Portugal’s current political situation. As markets started to
recover (both bond and equity market) we expect this source of funding to follow the trend.
With respect to the resources from other credit institutions, we believe that this source of funding will have an important role in the following years and that it will become the second main source of funding of Banco BPI. The difficulty of placing debt securities in the market and the lower interest rates charged within banks will encourage this source of funding.
7.8 8.3
26.2 5.3 5.3 2.2 13.3 2.9 1 6 11 16 21 26 200 7 200 8 200 9 201 0 201 1 201 2 201 3 201 4 CGD BCP BPI Santander 50% 100% 150% 200% 250% 300% 350% 200 3 20 0 4 200 5 200 6 200 7 200 8 200 9 201 0 20 1 1 201 2 201 3 201 4 Belgium France Germany Denmark Italy Portugal Spain UK Source: OECD 39% 10% 15% 7% 33% 8% -10% 20% 30% 40% 50% 200 7 200 8 200 9 201 0 201 1 201 2 201 3 20 1 4
Figure 15 - Debt as % of Household disposable income
Figure 16 - Debt securities (domestic - €bn)
Figure 17 - Debt securities as % of total liabilities (domestic)
Source: Company
Source: Company
BANCO BPISA COMPANY REPORT
PAGE 11/35 Notes: (10) Targeted long-term refinancing operations; (11) As of September 2015; (12) As of February 2015
ECB funding
As mentioned above, the sovereign debt crisis, that stroke Portugal particularly in 2011, limited the sources of funding for the Portuguese financial institutions. The access to the wholesale debt market closed and banks didn’t have surplus to lend funds to each other. Given the outlook, Portuguese banks resorted heavily to ECB for funding (figure 18).
The successful exit from the assistant program and the gradual recovery of the Portuguese economy led to a progressive decrease of the ECB funding as other sources of funding became available (e.g. BES and CGD issued debt securities at the end of 2013).
BPI presents the smallest dependence on resources obtained from ECB, in absolute terms, within the financial institutions sector amounting €1.5bn (as of 3Q 2015), which corresponds entirely to funds raised under the TLTRO(10). Going forward, we believe that BPI will maintain this source of funding at around €1.5bn
given the liquidity incentives provided by ECB’s monetary policy.
BPI’s medium and long-term net refinancing needs, up until the end of 2018,
amount to €659m, which are fully covered with additional assets (net of haircuts)
capable of being transformed into liquidity via operations with the ECB, amounting to €5.9bn(11). It is worth mentioning that in 2019 there will be a significant release of liquidity by way of prepayment of the MLT Eurozone sovereign debt held by BPI in portfolio.
Main operations
Credit portfolio
In the period prior to the financial crisis, loans to customers were showing an upward trend and were growing at a very high pace both in Portugal and in the Euro area (figure20). From 2005 to 2008, lending registered a CAGR of 10.5% in Portugal and 9.9% in the Euro area. In the summer of 2008, credit growth started to slow down but between 2009 and April 2011 it still registered a GAGR of 6.2% and 4.5% in Portugal and in the Euro area respectively. After the sovereign debt crisis affected Portugal, with the implementation of the EFAP program, loans to customers started contracting at a high pace, increasing the gap to the Euro area average (figure 21). Despite the contraction, loans to customers still account for
c.50% of the Portuguese banks’ assets, above the Euro area average of
36.8%(12)
2.8
6.1
1.5 3.8
5.5
0 2 4 6 8 10 12 14 16 18 20
200
9
201
0
201
1
201
2
20
1
3
20
1
4
1Q
15
2Q
15
3Q
15
9.0
2.0 4.0
-5 10 15
200
7
200
8
200
9
201
0
201
1
201
2
201
3
201
4
Source: Company
Figure 18 - Deposits from other credit institutions (domestic - €bn)
BCP BPI Santander
CGD BCP
BPI Santander BES/NB
Source: Company
BANCO BPISA COMPANY REPORT
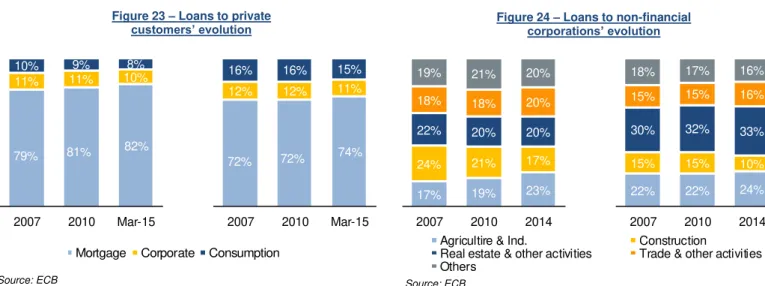
PAGE 12/35 In Portugal, loans to households and to non-financial corporations represent more than 70% of the overall (figure 22). Portuguese mortgage loans are the main business segment of the household loan’s offerings, weighting more than the euro average (figure 23), while loans to non-financial corporations are mainly to the construction and real-estate businesses. Nonetheless, the aggregated weight of the construction and real estate sectors has been falling since 2007 and the agricultural, industry and trade, accommodation & food service activities have been increasing substantially in the last seven years (figure 24). This trend is in line with the increase of Portuguese exports with the most influent sectors being agricultural, industry and trade, accommodation & food service activities.
BPI’s domestic credit portfolio followed the trend of the sector and contracted
c.17.5% between 2007 and 2014 (figure 25). Its credit portfolio is mainly composed by loans to private customers (51%, mortgage alone accounts for 48% of the total) and by loans to non-financial corporations (39%).
60 65 70 75 80 85 90 95 100 105 110
95 105 115 125 135 145
Portugal Euro Area CAGR 05-08:
Portugal: 10.5% Euro area: 9.9%
CAGR 09-04/11: Portugal: 6.2% Euro area: 4.5%
CAGR 05/11-03/15: Portugal: 6.2% Euro area: 4.5%
17% 19% 23%
24% 21% 17%
22% 20% 20%
18% 18% 20%
19% 21% 20%
2007 2010 2014
22% 22% 24%
15% 15% 10%
30% 32% 33%
15% 15% 16%
18% 17% 16%
2007 2010 2014
79% 81% 82%
11% 11% 10%
10% 9% 8%
2007 2010 Mar-15
Mortgage Corporate Consumption
72% 72% 74%
12% 12% 11%
16% 16% 15%
2007 2010 Mar-15
Figure 20 – Loans in Portugal and in the euro area (Dec 2005=100) Figure 21 – Loans in Portugal and in the euro area (May 2011=100)
Household 44%
Non-financial corporations
30% General
Gorv. 4%
Ohers 22%
Figure 22 – Loan split by segment (Feb 2015)
Mortgage Corporate Consumption
Figure 24 – Loans to non-financial
corporations’ evolution
Figure 23 – Loans to private
customers’ evolution
Agricultire & Ind. Construction
Real estate & other activities Trade & other activities Others
Source: APB Source: APB
Source: ECB Source: ECB
Source: APB
BANCO BPISA COMPANY REPORT
PAGE 13/35 Private
Customers 51% Corporate
39% Others
10%
Corporate 82% SME
18%
Mortgage 93% Consumption
7%
Notes: (13) The ratio includes all credit in default and not just the amount overdue
Going forward we believe that the contraction trend that has been felt for the past 4 years will invert by mid-2017 when households’ confidence in the economy is regained, employment starts increasing and the overall European economy
enters in a “growing phase” after a prolonged period of stagnated growth. The
main recoveries will be in the mortgage loans (as new clients start applying for mortgage loans instead of relying in the rented housing market), consumer loans (as indebtedness reaches the Euro area average) and loans to corporations (excluding Small and Medium size Enterprises that are already growing in order to boost exports).
The non-performing loans also registered a significant increase in the banking sector since 2010. This increase was partly explained by the changes in regulation required by the EFAP program in order to present ratios in line with international practices(13) and partly due to the increase in default rates (figure 27). The mortgage loans suffered less deterioration on the ratio, increasing from 4.3% in 2010 to 5.9% in 2014. On the other hand, consumption loans (excluding mortgage), especially loans to the non-financial corporations, registered significant increases. NPLs of the consumption loans increased from 10.3% in 2010 to 17.5% in 2014, while NPLs of the non-financial loans increased from 5.9% in 2010 to 19.0% in 2014.
5% 8%
10% 11% 12%
2010 2011 2012 2013 2014 Total
4%
6% 6% 6% 6%
2010 2011 2012 2013 2014 Housing
10% 12%
15% 17% 18%
2010 2011 2012 2013 2014 Consumption & other
6% 10%
14% 16%
19%
2010 2011 2012 2013 2014 Non-financial Corporations
Figure 25 –BPI’s credit portfolio (%)
Source: Company
Figure 27 – Non-performing loans as a percentage of total corresponding credit
Source: APB 11 12 12 11 11 12 13 10
8 7
27,5 29,7
26,3
23,4 22,7
2007 2010 2012 2014 3Q15 Mortgage Corporate Consumption SME Others
Figure 26 –BPI’s credit portfolio (€bn)
BANCO BPISA COMPANY REPORT
PAGE 14/35
Since BPI’s credit portfolio is mainly composed by mortgage loans, its NPL ratio
registered levels below the Portuguese banking sector average (figure 28) between 2010 and 2014. The Portuguese bank most penalized by the deterioration of credit quality was BCP with a credit at risk ratio of 12% compared to the one of 5.4% of Banco BPI. In 2015 the NPL ratio has improving slightly as economic conditions improve, with BPI registering a ratio of 5.1% in the 3Q 2015 and BCP a ratio of 11.9% in the same period.
Financial assets portfolio
In order to strengthen the capital ratios, as imposed by the ECB prudential rules, the Portuguese Banking sector decreased its exposure to sovereign debt securities after the sovereign debt crisis affected Portugal in 2011. One of the critical exposures was to the Greek sovereign debt, which led to the recognition of significant impairment losses in the Portuguese banking sector (figure 29). From 2011 forward, we saw two opposite trends pressuring the financial assets portfolio of the Portuguese financial institutions. On one hand, the macroeconomic instability in the world and the strict requirements for the capital ratios led to a downward trend with the contraction of the sovereign debt securities in the portfolio. On the other hand, some financial institutions acquired securities that are eligible for refinancing operations at ECB increasing the financial assets portfolio.
BPI’s portfolio of financial assets available for sale was comprised mainly by
Portuguese sovereign debt securities (c.66%), followed by exposure to Italian public debt (c.15%) and finally to Spanish Public debt (c.3.6%). The table below presents the risk inherent to those exposures and the respective impact in the share price.
Going forward we believe that BPI’s financial assets portfolio will not register any significant increase or decrease over the next two years, pressured by the economic outlook, with the focus being on the strengthening of the capital ratios. As financial markets recover (bond and equity markets) and the Portuguese
financial sector stabilizes (the outcome of the sale of the state’s participation in
Novo Banco and Banif will play a crucial role for the welfare of the financial sector and for the overall Portuguese economy)(14), we expect the portfolio to increase slightly.
-500 1,000 1,500 2,000 2,500
200
7
200
8
200
9
201
0
20
1
1
201
2
201
3
20
1
4
Notes: (14) The outcome of both Novo Banco and Banif may lead to new tranches of special contributions from the financial sector, which may harm the sector profitability and stability
7% 10%
13%
12% 12%
5% 8%
10% 11% 12%
3% 3%
4% 5%
5%
-2% 4% 6% 8% 10% 12% 14%
2010 2011 2012 2013 2014
Figure 28 – NPL ratio benchmark
BCP PT avg. BPI
Source: Company and APB
Figure 29 – Total impairments
Source: Company
CGD BCP
Santander BPI
Figure 30 –BPI’s financial assets portfolio
Source: Company
Portfolio of assets
2014 3Q15
Portugal 3,352 2,727
as % of total 68.9% 65.9%
Italy 566 628
as % of total 11.6% 15.2%
Spain - 150
as % of total - 3.6%
Corporate 631 318
Equities 120 115
Others 193 202
BANCO BPISA COMPANY REPORT
PAGE 15/35
Regolatory capital
Capital requirements
Capital requirements became a central focus for the banking sector after the 2010 European sovereign crisis. European financial institutions were forced to register significant impairments on sovereign debt securities in their balance-sheet revealing, in most cases, a lack of capital to face adverse macroeconomic situations. As a result, the European Banking Authority (EBA) implemented new and more demanding capital requirements for the financial institutions, imposing a minimum core tier one of 9% at the end of 2011 and 10%, since the end of 2012, on a consolidated basis which resulted in a recapitalisation exercise for 71 European banks.
Banco BPI was one of the 71 banks affected by the recapitalisation exercise with a shortfall of €1,389m, c.98% from sovereign debt exposure (mainly Portuguese
sovereign debt amounting €989m). BPI approved a Recapitalisation Plan which
consisted in issuing €1.5bn of contingent convertible subordinated bonds
(CoCo’s) subscribed by the Portuguese State in June 2012, allied with a capital
increase of €200 million in August 2012. By the end of 2012, Bank of Portugal
also established a new regulation imposing a minimum core tier 1 capital requirement of 10%, meaning that Portuguese banks needed to comply with both BoP core tier 1 requirements of 10% and EBA requirements of 9%.
Since early 2014, EBA implemented a new transitional regime for adapting its own funds implemented by CRD IV/CRR, which requires a Common Equity Tier 1 ratio (CET1) of 7%. At the end of 2013 BPI had a CET1 capital ratio of 11.2%, which represented a capital surplus of €713m allowing the bank to repay the full
amount of the CoCo’s to the state, with the last tranche paid in June 2014 (figure
31).
After repaying the CoCo’s, the CET1 ratio started to improve and reached 9.8% in the 3Q 2014, well above the 7% threshold. However, on December 2014, Banco BPI received unfavourable news from the European Commission regarding the list of countries with regulations and supervision equivalent to those of the European Union. The European Commission released a list of 17 countries and/or territories which didn’t include the Angolan State. This meant that, for the
purpose of calculation of Banco BPI’s capital ratios, exposures to Angola started
being weighted at 100%. The new equivalent regulation led to an increase of
€4.5m in risk-weighted assets and BPI’s exposure to the Angolan State and BNA
were no longer exempt from application of the limit to large exposures, which will Recapitalization plan
Date
CoCo (end of period)
Interest cost
Jun 12 €1,500m
-2012
(2nd half) €1,200m €56m
2013 €920m €85m
2014
(1st half) - €27m
Figure 31 – CoCos reimbursement
Source: Company
€0.9bn
€0.9bn
€0.9bn €3.0bn €3.0bn
€0.8bn
€1.2bn
€0.9bn
2012 2013 2014
CGD BCP BPI
Figure 32 – CoCos reimbursement benchmark
BANCO BPISA COMPANY REPORT
PAGE 16/35 ultimately result in the loss of the majority stake in BFA (carve-out keeping a minority stake).
Going forward, we believe that after the problem of the limit to large exposures is solved, with BPI keeping a minority stake in BFA (addressed further in this report) and divesting all the remaining international operations, BPI will have no issue in complying with the new capital requirements, namely the 7% Core Tier 1.
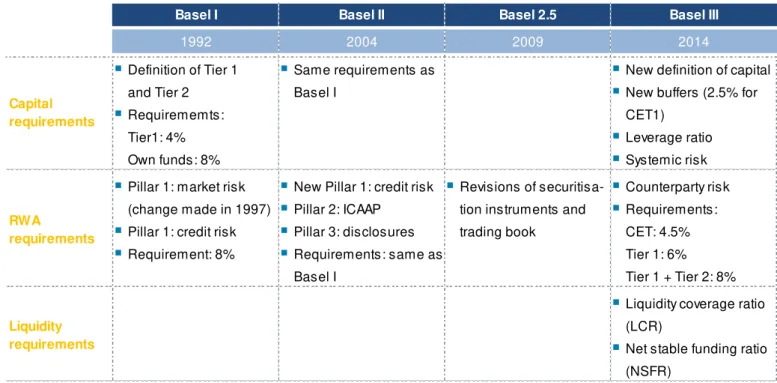
Basel III
The Basel Committee on Banking Supervision structured, by the end of 2010,
“BASEL III” as a comprehensive set of reform measures designed to improve the
regulation, supervision and risk management within the banking sector, which is supposed to phase-in until 2019. Figure 33 presents the different Basel guidelines implemented since 1992:
The Portuguese financial institutions sector will face some important challenges in the years to come that may jeopardize the compliance of the new Basel III ratios: CGD has to repay €900m of CoCo bonds to the Portuguese state in 2016,
needing c.€800m of additional capital do to so; Novo Banco is searching for a
private investor in order to comply with the necessary capital requirements imposed by ECB while Banif was partially sold to Santander Totta (resolution measures implemented by the Portuguese Government); Banco BPI is in breach with the maximum limit to large exposures and will need to divest its majority participation in BFA. From those challenges, the ones that inspire close attention
Basel I Basel II Basel 2.5 Basel III
1992 2004 2009 2014
g Definition of Tier 1 g Same requirements as g New definition of capital
and Tier 2 Basel I g New buffers (2.5% for
g Requirememts: CET1)
Tier1: 4% g Leverage ratio
Own funds: 8% g Systemic risk
g Pillar 1: market risk g New Pillar 1: credit risk g Revisions of securitisa- g Counterparty risk
(change made in 1997) g Pillar 2: ICAAP tion instruments and g Requirements:
g Pillar 1: credit risk g Pillar 3: disclosures trading book CET: 4.5%
g Requirement: 8% g Requirements: same as Tier 1: 6%
Basel I Tier 1 + Tier 2: 8%
g Liquidity coverage ratio
(LCR)
g Net stable funding ratio
(NSFR) Capital
requirements
RWA
requirements
Liquidity requirements
BANCO BPISA COMPANY REPORT
PAGE 17/35 are Novo Banco and Banif since its outcome affects not only the financial sector but the whole Portuguese economy.
Pension fund
Portuguese credit institutions, up to June 2011, used the corridor method to recognize actuarial deviations relating to pension plans and other post-employment benefits under defined benefit plans. In December 2011 credit institutions adopted the new rules introduced by IAS 19 and changed the accounting policy for the recognition of actuarial and financial variances relating to pension funds.
The new rules implemented by the IAS 19 also resulted in a partial transfer of the pension liabilities and funds to Social Security. Banco BPI saw its pension liabilities and funds decreased by 62% and 63% respectively (figure 34). Since then, both assets and liabilities have been growing slightly, mainly due to the recapitalisation plan, implemented in 2011, which increased the number of early retirements
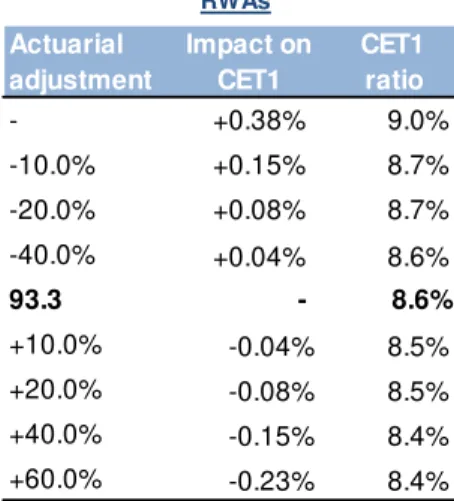
The actuarial method recognizes any loss or gain in the statement of
comprehensive income, thus, affecting directly the shareholders’ equity account.
As a result, if the assets under management are not enough to cover the liabilities, BPI needs to register the actuarial directly in the shareholders’ equity difference which may jeopardize the compliance of its capital ratios. Figure 35 measures how different actuarial losses would impact the 2014 CET1 ratio. Every 10% variation has an impact of c.0.04% in the CET1 ratio, and, even with a 60% increase in the actuarial deviations, the CET1 ratio would stand above the
minimum threshold of 7%. Thus, the pension fund’s actuarial deviations do not
pose a significant threat for Banco BPI.
The Banco BPI’s pension fund composition has been changing over time. In
2012, fixed-income and real estate asset classes were the main focus of investment, but in 2014, equity investments aggregate the highest stake (figure 36). When compared to some of its main peers we see that BPI has a more diversified portfolio in relative terms and the percentage of liquidity stands out for being the main difference (figure 37).
Profitability
Portuguese banks’ return on assets (ROA) and return on equity (ROE) have fallen in recent years and have not accompanied the European climate of recovery (figure 38). This behaviour is mainly explained by the significant increase in impairments following the European sovereign crisis and by a reduction in the net interest income mainly between 2011 and 2013 (figure 39)
Figure 34 – Assets under management evolution
Source: Company
Actuarial adjustment
Impact on CET1
CET1 ratio
- +0.38% 9.0%
-10.0% +0.15% 8.7%
-20.0% +0.08% 8.7%
-40.0% +0.04% 8.6%
93.3 - 8.6%
+10.0% -0.04% 8.5%
+20.0% -0.08% 8.5%
+40.0% -0.15% 8.4%
+60.0% -0.23% 8.4%
Figure 35 – Pension fund impact on RWAs
Source: Analysts estimates
30%
19% 29% 23% 34%
5% 24%
20% 27%
21%
10% 24% 9%
55%
37% 33%
BPI CGD BCP Novo Banco Fixed-Income Equities Real Estate Others
27% 37% 31% 30% 27%
25% 32% 34% 26%
35% 31% 27% 19% 4% 5% 9%
2011 2012 2013 2014 Fixed-Income Equities Real Estate Others
Figure 36 – Pension fund split by assets
Source: Company
Source: Company
Figure 37 – Pension fund – Peer analysis
15.9
8.6 9.910.5
7.47.5 7.9
10.0
BANCO BPISA COMPANY REPORT
PAGE 18/35 due to lower average interest rates (sharp decrease on the Euribor rate) and the higher cost of financing (as explained above, in a first stage banks increased interest rates on deposits in an attempt to attract customers).
BPI’ profitability was mostly affected by its exposure to sovereign debt securities,
while being most resilient to the deterioration in the credit quality given its higher exposure to the mortgage loan segment in its portfolio (Santander had a similar behaviour but its lower exposure to sovereign debt securities resulted in higher profits when compared to its main peers – Figure 40). The deterioration of the credit quality had higher impact on credit institutions with a credit portfolio focused on corporate clients, such as BCP that saw its domestic impairments as percentage of its domestic banking income increase significantly when compared to BPI and Santander (figure 41).
In 2014, Portuguese banks changed strategy and started decreasing the average interest rates charged on deposits following the trend of Euribor (figure 13). This strategy is having a positive impact on the net interest income despite the contraction of the loan portfolio (Figure 42), which aligned with a gradual decrease in the credit impairments (Figure 40) as well as with gradual recovery of the Portuguese and European economy, will bring the Portuguese credit institutions to positive domestic profits already in 2015.
Despite the historical low interest rates both households and a significant stake of non-financial corporations are still reluctant in applying for new credit lines given the high levels of indebtedness. The contraction of the loans portfolio limits the
credit institutions’ ability to improve their net interest income through the lending
side by re-pricing its new issued loans, thus, the focus shifted to the funding side.
Banco BPI’s net interest income has been under pressure since 2008 contracting
c.48% between 2007 and 2014, driven by the contraction of the credit portfolio and its higher concentration on mortgage loans (mortgage loans carry lower interest rates and are harder to re-price given the higher maturity of its loan contracts). Following the market trend, BPI re-priced its funding costs. Its average cost on deposits decreased from €473m in 2012 to €291m in 2014 (c.55% of domestic banking income), and should continue to decrease at least until mid-2017 as ECB monetary policy is supposed to ease and rates are expected to start to gradually increase. Nonetheless, the expected increase in funding costs should be balanced by a gradual recovery of the credit portfolio, driven by low interest rates, declining unemployment figures and economic growth that are expected to stimulate consumer confidence and credit availability. Net commission income performance is linked to the performance of the overall economy. Commercial banking commissions are mostly dependent on the
-20% 40% 60% 80% 100% 120% 140%
2010 2011 2012 2013 2014
(0.1%) (0.1%)
0.1%
EU
(0.1%)
(0.3%)
(0.8%)
Portugal
€8bn € 7bn
€5bn
(€7bn)
(€7bn)
(€6bn) (€2bn) (€2bn)
(€4bn)
NII Impairment Income before tax 2008 2012 2013
Figure 38 – ROA (%)
Source: APB
Figure 39 – Credit risk evolution
2011 2012 2013
(1,200) (1,000) (800) (600) (400) (200) -200 400 600
2010 2011 2012 2013 2014
BCP BES / NB BPI Santander
Figure 40 – Net income evolution of Portuguese largest banks (€m)
Source: APB
Source: Company
Figure 41 – Impairment as % of NBI
Source: Company
BANCO BPISA COMPANY REPORT
PAGE 19/35 domestic economy of the bank, while asset management and investment commissions are mainly affected by the international economic activity (the performance of the European markets is the most important economy for Portuguese banks). Banco BPI’s net commission income represented c.55% of its domestic banking income in 2014 and has also been under pressure since the 2008 crisis. BPI’s asset management and investment banking commissions were the most affected with the economic and sovereign crisis (Figure 42). The reduction in the asset management fees was motivated by a generalized risk aversion, with customers re-allocating off-balance sheet resources into
on-balance sheet resources and, as a result, BPI’s assets under management
decreased significantly (figure 34). As for the investment banking fees, the overall bad performance of the capital markets led to significant reduction of the amount invested by clients, which decreased significantly BPI’s brokerage fees (in 2007 brokerage fees amounted €23.7m decreasing to €9.2m in 2012).
Nonetheless, the overall performance of BPI’s net commission income, in relative
terms, contracted far less than the net interest income between 2007 and 2014 (-6% vs. -48% respectively). The main contributors for this behaviour were commercial banking commissions related to insurance products that increased by c.28% between 2007 and 2014. As for the overall commercial banking commissions the performance was negative, as a result of a reduction in the fees related with the loan portfolio and a reduction of the banking services fees, driven by a loss of confidence in the financial institutions sector.
Going forward, BPI’s net commission income should recover at a slow pace in the next 3 years, influenced by a continuous lack of confidence in the financial institutions credit as a result of Banif and Banco Espírito Santo resolutions measures, and by the slow recovery of the capital markets. As confidence returns and capital markets start to improve again, net commission income’s growth should also accelerate.
BPI’s trading income is highly dependent on the performance of the capital
markets, both domestic and international. As seen above, BPIs financial assets’ portfolio is mainly exposed to Portuguese debt securities, followed by Italian and Spanish debt securities, thus, the gains and losses obtained from trading activity will mostly be linked with the performance of these 3 peripheral countries.
Since 2008, BPI’s gains and losses on financial assets have not been steady
(figure 43), with either significant gains arising from sovereign debt securities or considerable losses on those same securities. Substantial losses arising from the trading activity may seriously jeopardize the financial wealth of the bank as seen by figure 45. Nonetheless, the overall European economy has been improving
-200 400 600 800 1,000
2010 2011 2012 2013 2014 Funding costs (deposits) Interest income NII
Figure 42 –BPI’s NII evolution (€m)
Source: Company
€175m €189m
€62m
€41m
€19m €17m
-50 100 150 200
2008 2009 2010 2011 2012 2013 2014 Commercial banking Asset management Investment banking
Figure 43 –BPI’s net commissions
evolution (€m)
Source: Company
(20) 93
51 143
326
172
(93) 2008 2010 2012 2014
Figure 44 –BPI’s gains and loss with
financial assets (€m)
BANCO BPISA COMPANY REPORT
PAGE 20/35 Notes: (15) According to IMF
significantly and we expect capital markets to fully recover by mid-2017, beginning of 2018. The main risks to BPI arise from the current political situation in Portugal, given the inherent risks of a minority government in parliament, and the political impasse in Spain (the elected party is yet to be confirmed, due to lack of agreement in parliament, and there is a possibility of new elections in the beginning of 2016).
However, the probability of significant losses in the forecasted period is minimal, given the strict regulations imposed to the financial institutions sector which penalize riskier portfolios with higher capital requirements.
Angola
Macroeconomics
Africa’s second-largest petroleum producer (after Nigeria), Angola was one of the
fastest growing economies in the world between 2002 and 2008. This growth was achieved almost exclusively through the oil sector, allied with a political stability
environment, started with the end of Angola’s civil war in 2002 (figure 45).
The continuous fall of the international oil prices, started in mid-2014, posts a significant challenge for Angola’s economy since its oil sector is estimated to account for c.95% of exports, c.70% of total government revenue and c.46% of GDP. As a result, economic growth slowed down to 4.8% in 2014, from 6.8% in
2013(15). To extend the unfavourable outlook of Angola’s economy, China, its
number one importer of goods and services, is facing an economic crisis and has been decreasing its level of imports. However, this situation forces the Angolan government to implement structural reforms needed to enhance economic diversification by promoting the non-oil sectors, reduce unemployment (that have increased to more than 25% in 2014) and address income inequality and poverty.
Going forward, the Angolan government will most likely be forced to implement austerity measures in order to address the sharp decrease on fiscal revenues
and to increase Angola’s economy resilient to the volatility of oil revenues (figure
46). National Bank of Angola allowed the devaluation of the kwanza against the US dollar (down c.24% since the beginning of 2015) to boost exports, and has been increasing its base interest rate (currently at 11% from 9% in October 2014) to control inflation and to attract foreign currency (figure 47).
-05% 10% 15% 20% 25% -20 40 60 80 100 120 140 200 5 200 6 200 7 20 0 8 200 9 201 0 201 1 201 2 201 3 201 4 201 5e 20 1 6e
Oil prices evolution (Brent) Angola's GDP growth
Figure 46 –Angola’s GDP growth rate (%) vs. Brent oil prices ($)
Source: IMF and DataStream
38% 35%
28% 26%
21% 22% 6%
5%
6% 6%
7% 6% 44%
40%
34% 32%
28% 29%
2011 2012 2013 2014 2015e 2016e
Contributios Fiscal revenue
Figure 47 – Angolan government revenues as % of PIB
Source: African Economic Outlook
-5 10 15 20 25 30 35 200 9 201 0 201 1 201 2 20 1 3 201 4 201 5e 20 1 6e
Figure 48 – Foreign reserves evolution ($m)
Source: IMF
Figure 45 – Financial loss impact on price
Source: Analyst’s estimates Financial loss impact
Loss Impact on price
Domestic Price 1x -100m (6.3%) €0.75
2x -100m (12.4%) €0.68
BANCO BPISA COMPANY REPORT
PAGE 21/35 Notes: (16) excluding Banco Económico, former BESA; (17) Banco de Poupança e Crédito,Banco Angolano de Investimentos, Banco de Fomento Angola and Banco BIC; (18) According to Financial Inclusion in Africa, AfDB, 2013; (19) Total assets converted to euros using 1 year AOA / EUR 2013 average from oanda
Financial sector
Angola financial sector is highly concentrated with the top four banks(16) (BPC, BAI, BFA and BIC)(17) controlling c.55% of the total assets in 2013 (figure 48),
enjoying close connections with the country’s elite, which creates barriers for
other international banks to enter in the market. One of the main challenges of the sector is the access to finance, with just c.39% of individuals holding bank accounts and only 8% with access to credit. As for SMEs, 86% have bank accounts, but only 9% have access to credit(18).
Funding structure
Angolan banks rely almost exclusively on customer deposits to fund their operations. In 2013, deposits accounted for c.70% of total funding, the same level as the USA market and slightly below South Africa level (figure 49)
BFA’s customer deposits accounted for 87% of 2014 funding structure,
registering the highest stake when compared to its main peers (figure 50), with
an absolute value of c.€7.2bn (a 21.8% increased vs. 2013 figures). The ongoing
process of de-dollarization have been also impacting the Angola’s customer deposits, with deposits in domestic currency representing more than 50% of the overall for all top four Angolan banks (figure51). Going forward, we believe that
deposits are expected to continue to grow at a pace higher than Angola’s GDP
growth, with the percentage of deposits in foreign currency continue to decrease and eventually disappear (given that many institutions, including the state, have loans or operate in dollars, the completely de-dollarization in Angola’s economy is not expected in the forecasted period).
The restricted access to credit allied with a strong customer deposits base is reflected by a relatively low transformation ratio. In 2013 Angola’s transformation ratio amounted to 58%, below South Africa and Portugal average (figure 52). BFA registered in 2014 the lowest transformation ratio when compared to its main peers (figure with transformation ratio), registering 24.7%. We believe that
BFA’s transformation ratio will continue at relatively low values, with a slight
increase as BFA starts to expand its credit portfolio to non-oil sectors
Main operations
The main focus of operations of BFA is the operations in the financial markets, with its financial assets weighting c.44.9% of total assets in 2014, the highest among the top four Angolan banks, followed closely by BIC with 44.6%. BPC is the top four banks with the lowest weight on financial assets, being focused BAI
16%
BPC 15%
BFA 13% BIC
11% Others
45%
€51.6bn
Figure 49 – 2013 Ranking by total assets(19)
70% 81% 70% 55%
27% 19% 11% 19%
38%
64% 11%
8% 11%
6% 9%
Angola South Africa
USA Portugal Brazil
Deposits Other liabilities Equity
Figure 50 – Sources of funding – country benchmark
Source: Deloitte
Source: Deloitte
73% 86% 87% 82% 8% 10% 10%
11% 19% 3% 3%
7%
€9.2bn€8.5bn€ 8.3bn
€6.4bn
BPC BAI BFA BIC Depostis Equity Others
Figure 51 – Sources of funding – company benchmark in Angola
Source: Company
92%
55% 68% 72% 8%
45% 32% 28%
BPC BAI BFA BIC Domestic currency Foreign currency
Figure 52 – Deposits split by currency