*e-mail: [email protected] Recebido: 09/01/2012 / Aceito: 29/02/2012
Methodology for the study of metabolic syndrome by heart rate
variability and insulin sensitivity
Erika Severeyn*, Sara Wong, Gianfranco Passariello, José Luis Cevallos, Deyanira Almeida
Abstract This work presents a methodology for studying the Heart Rate Variability (HRV) and Insulin Sensitivity (IS) during the Oral Glucose Tolerance Test (OGTT) in subjects with Metabolic Syndrome (MS). For this, it was designed a clinical protocol that includes the acquisition of ECG signals during OGTT for 15 subjects with MS and 10 subjects for control group. HRV parameters were obtained from electrocardiographic recordings. Signiicant differences in RR values were found between groups in the 30 minutes stage of the OGTT. In control subjects the RR values were higher compared with subjects with MS. The values of normalized low frequencies between baseline stages and the stage at 30 minutes in subjects with MS showed a signiicant increase in sympathetic tone during the OGTT, that was not observed in group control. The following methods were implemented for quantiication of IS: integral equation, insulin sensitivity index, insulin sensitivity, metabolic, HOMA and QUICKI. We found signiicantly lower values of IS in the group with MS. It was concluded that there are changes in the HRV and the IS in the subjects with MS, which is a pre-diabetic disease. These indings suggest that HRV and IS can be used for diagnosis of MS and prevention of Diabetes Mellitus.
Keywords Diabetes mellitus, Metabolic syndrome, Heart rate variability, Insulin sensitivity, Oral glucose tolerance test.
Metodologia para o estudo da síndrome metabólica partindo da variabilidade
da frequência cardíaca assim como da sensibilidade à insulina
Resumo Este trabalho apresenta uma metodologia para o estudo da Variabilidade da Frequência Cardíaca (VFC) e Sensibilidade à Insulina (SI) durante o Teste de Oral de Tolerância à Glicose (TOTG) em indivíduos com Síndrome Metabólica (SM). Para isso, foi projetado um protocolo clínico que inclui a aquisição de sinais ECG durante o TOTG em 15 pacientes com SM e 10 indivíduos do grupo controle. Os parâmetros da VFC
foram obtidos a partir de registros eletrocardiográicos. Diferenças signiicativas nos valores de RR foram encontradas entre os grupos na fase de 30 minutos do TOTG. No grupo controle os valores de RR foram
maiores em comparação com indivíduos com SM. Os valores normalizados de baixas frequências entre as
fases da linha de base e a fase de 30 minutos em pacientes com SM mostraram um aumento signiicativo
no tônus simpático durante o TOTG, não observado no grupo controle. Os seguintes métodos foram
implementados para a quantiicação de SI: integral, índice de sensibilidade à insulina, sensibilidade à insulina, metabólicos, HOMA e QUICKI. Valores signiicativamente menores de IS foram encontrados no
grupo com MS. Podemos concluir que existem alterações na VFC e SI nos indivíduos com MS, caracterizando uma doença pré-diabética. Estas descobertas sugerem que a VFC e SI podem ser usados para o diagnóstico
da SM e prevenção da Diabetes Mellitus.
Introduction
Diabetes mellitus is a disease characterized by the accumulation of glucose in the blood. This is the result of poor performance of the pancreas to produce insulin. The causes of this disease are still unclear, however, there are pre-diabetic conditions that predispose or prelude the development of the disease. Among these conditions is the Metabolic Syndrome (MS). Therefore, early diagnosis and treatment of MS can prevent the development of diabetes, as well as associated diseases such as hypertension and neuropathy (Zimmet and Alberti, 2005).
Several studies reveal the importance of some parameters, such as physiological signs and symptoms, in the diagnosis of diabetes mellitus. Among these we can highlight the Heart Rate Variability (HRV), which, in the early stages of diabetes, show changes including increased sympathetic tone and decreased parasympathetic tone, which could indicate also cardiovascular disorders (Weissman et al., 2006). It was also reported low values of insulin sensitivity in diabetic and hypertensive subjects (Burattini et al., 2009). The methods to quantify the Insulin Sensitivity (IS) are numerous and there are not consensual borders to discriminate MS subjects from normal subjects.
This work proposes a methodology for the study of HRV and IS during Oral Glucose Tolerance Test (OGTT) in subjects with MS. For this, it was designed a clinical protocol that allowed the construction of a database. This database includes the acquisition of Electrocardiographic (ECG) signals during the OGTT, in order to study HRV. This allowed us to determine possible relationships between blood glucose levels and HRV, as well as the determination of IS in both populations.
Materials and Methods
Selection of subjects
Subjects were chosen for this study by the following criteria: male, age between 20 and 44 years old, non-smoker, not on drug treatment, without disabilities and without known cardiovascular diseases. Each subject signed an informed consent form, which
explains the conditions of test, importance and
usefulness.
For the diagnosis of MS it was used the criteria of National Cholesterol Education Program-Adult Treatment Panel (NCEP ATP III), which consist in the presence of two or more of the following characteristics: abdominal circumference in men greater than 102 cm and in women greater than 88 cm,
blood pressure equal or higher than 130/85 mmHg,
triglycerides higher than 150 mg/dL, HDL-cholesterol in men lower than 40 mg/dL and in women lower than 50 mg/dL, fasting blood glucose equal to or higher than 110 mg/dL.
Clinical protocol
Table 1 shows the tests, measurements and recordings made during the clinical protocol, which consists of the following steps:
• ECG signal acquisition before the OGTT; • Extraction of blood sample at baseline, with
the subject on fasting;
• Ingestion of 75 grams of liquid glucose; and • Four blood samples extracted in intervals of
30 minutes and, before each of these samples, a ifteen-minute ECG signal was acquired.
The Cardiosoft® software was used for the
acquisition of ECG signals and extraction of the
RR and QRS intervals. The ECG recordings were
Table 1. Description of tests and measurements during the clinical protocol.
Tests and measurements Description
Blood tests
Includes complete hematology, fasting blood glucose, urea, creatinine, cholesterol, triglycerides, high density lipids (HDL), low density lipids (LDL), very low density lipid (VLDL), uric acid and alanine transaminase (ALT).
Anthropometric variables measurement Height, weight, waist circumference and Body Mass Index (BMI). Clinical variables measurement Blood pressure.
Oral Glucose Tolerance Test (OGTT)
It consists of oral intake of 75 grams of liquid glucose, followed by the extraction of blood samples at intervals of 30 minutes and laboratory measurements of insulin and glucose for each sample. The test lasts 2 hours and, at the end, two curves are generated: insulin concentration and glucose concentration (these data are used in different methods for the quantiication of insulin sensitivity).
ECG recording The ECG recordings were performed before each blood sampling of the OGTT,
performed at sampling frequency of 1 kHz, resolution of 16 bits and 12-lead records (CardioSoft, 2012).
Heart rate variability
Measurement of HRV is the oscillation during the interval between consecutive heartbeats. This is an established quantitative method, allowing the assessment of cardiac autonomic activity through the study spectral HRV. Based on HRV values, it can be studied the autonomic nervous system and its
luctuations, and, thereby, cardiovascular disorders
and diabetes (Chan et al., 2007).
Analysis of the RR series
The CardioSoft® program was used for the detection
of the QRS complex and construction of the RR series.
The RR series for each time interval in the OGTT
were validated and resampled at 2 Hz. The Wilcoxon and Kruskal-Wallis tests were used in order to ind
differences between groups and stages of the OGTT in relation to HRV parameters. In all cases, ‘p’ values
‘<0.05’ were considered signiicant. HRV parameters
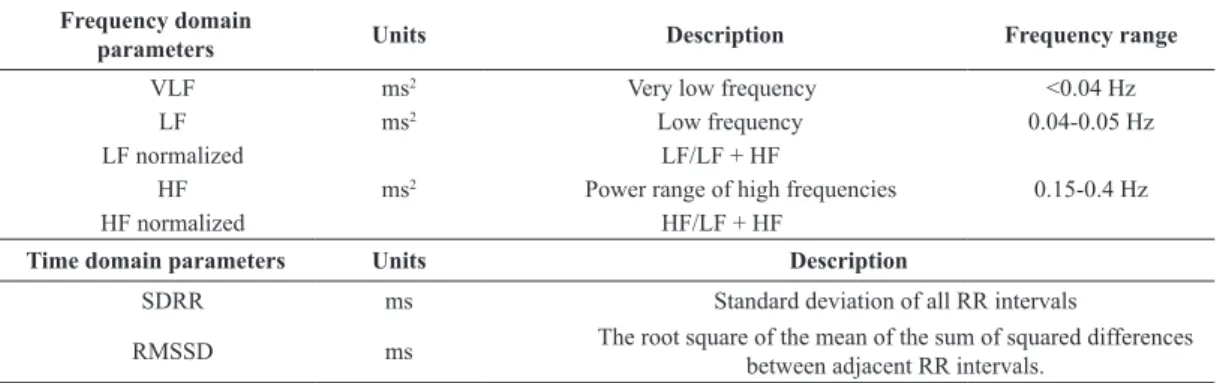
From the RR series, SD and RMSSD were calculated in the time domain, and the Low Frequency (LF), High Frequency (HF) and LF/(LF + HF) were calculated in the frequency domain. All calculations and algorithms
used were implemented and executed in MATLAB.
Table 2 shows the description of the parameters.
The RR series extracted were resampled at 2 Hz
to make them a uniform sampled series. From the RR uniform sampled series, the temporal domain parameters (SD and RMSSD) and the frequency domain parameters (LF, HF, and LF/(LF + HF)) were calculated. Frequency domain parameters were calculated using the autoregressive Burg’s algorithm.
Insulin sensitivity
Insulin sensitivity (IS) is deined as the ability of the
cells to react to the presence of insulin (Clausen et al.,
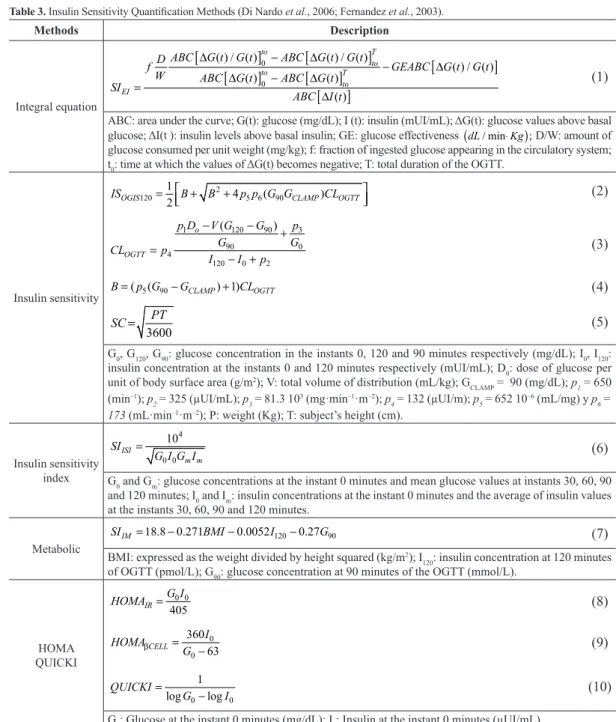
1996). The IS can be quantiied by existing methods that use data from the OGTT; the methods used in this study for the quantiication are: integral equation, insulin sensitivity index, insulin sensitivity, metabolic,
HOMAIR, HOMAβCELL and QUICKI. The formulation
of these methods is speciied in Table 3.
Results
Database
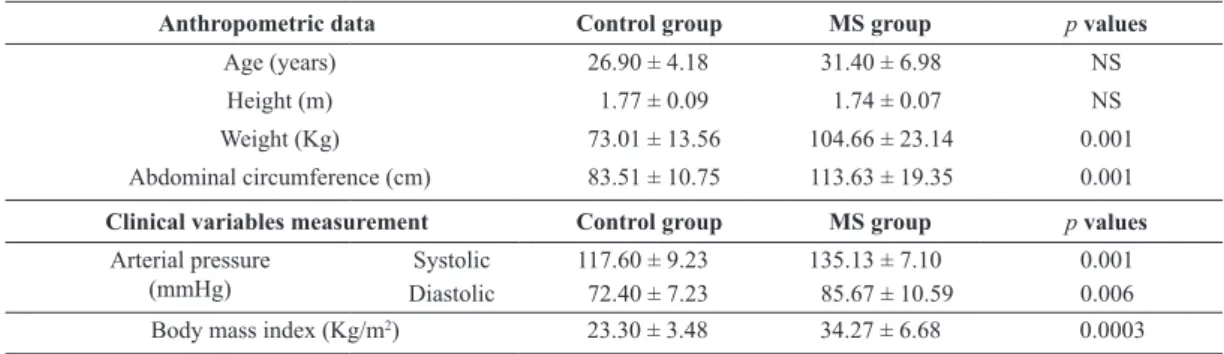
The database obtained consisted in 25 subjects, of which 15 correspond to a group with MS and 10
to the control group. Signiicant differences were
found between groups in weight and abdominal
circumference. However, no signiicant differences
were found in age and height. The MS group presents
obesity (with a Body Mass Index (BMI) above 30),
which is located mainly in the abdomen. Table 4 shows the anthropometrics data for the MS and control groups.
Parameters obtained from the study of HRV
The study was performed on HRV data obtained during the OGTT. The following parameters were obtained from the electrocardiographic recordings: RR, HF, LF, RMSSD, SD and LF/(HF + LF). Those values were recorded for each one of the OGTT stages, for both groups.
Signiicant differences were found between groups in the values of RR during the 30 minutes stage of the
OGTT (control group 966.286 ± 160.146 ms versus MS
group 843.200 ± 137.478 ms). Subjects with MS showed
an increase in sympathetic tone during the OGTT, which
was not observed in the control group. Signiicant
Table 2. HRV parameters in time and frequency domain found in this study (Task Force of the European Society of Cardiology and the North American Society of Pacing and Electrophysiology, 1996).
Frequency domain
parameters Units Description Frequency range
VLF ms2 Very low frequency <0.04 Hz
LF ms2 Low frequency 0.04-0.05 Hz
LF normalized LF/LF + HF
HF ms2 Power range of high frequencies 0.15-0.4 Hz
HF normalized HF/LF + HF
Time domain parameters Units Description
SDRR ms Standard deviation of all RR intervals
RMSSD ms The root square of the mean of the sum of squared differences
differences were observed for LF/LF + HF in the MS
group between the baseline stage (0.692 ± 0.093) and the 30 minutes stage (0.757 ± 0.067).
The signiicant differences between groups and
stages found in this study might indicate a very early stage of cardiac dysfunction induced by dysfunctional metabolism of sugars.
Insulin sensitivity obtained from the methods
Signiicant differences between groups were found
in the following methods: integral equation, insulin
sensitivity, index of insulin sensitivity, HOMAβCELL,
HOMAIR and QUICKI. The insulin sensitivity in the control group is higher than in MS group, indicating that for control group the quality of insulin metabolism is better than in MS group. Table 5 shows the values of IS obtained from each method, for both groups.
Discussion
This study shows the design of a clinical protocol for the study of heart rate variability and insulin sensitivity
Table 3. Insulin Sensitivity Quantiication Methods (Di Nardo et al., 2006; Fernandez et al., 2003).
Methods Description Integral equation
[
]
[
]
[
]
[
]
[
]
[
]
0 0 ( ) / ( ) ( ) / ( ) ( ) / ( ) ( ) ( ) ( ) to T to to T to EIABC G t G t ABC G t G t
D
f GEABC G t G t
W ABC G t ABC G t
SI
ABC I t
∆ − ∆ − ∆ ∆ − ∆ = ∆ (1)
ABC: area under the curve; G(t): glucose (mg/dL); I (t): insulin (mUI/mL); ΔG(t): glucose values above basal glucose; ΔI(t ): insulin levels above basal insulin; GE: glucose effectiveness (dL/ min⋅Kg); D/W: amount of glucose consumed per unit weight (mg/kg); f: fraction of ingested glucose appearing in the circulatory system; t0: time at which the values of ΔG(t) becomes negative; T: total duration of the OGTT.
Insulin sensitivity
2
120 5 6 90
1
4 ( )
2
OGIS CLAMP OGTT
IS = B+ B + p p G G CL
1 120 90 3
90 0
4
120 0 2
( )
o OGTT
p D V G G p
G G
CL p
I I p
− −
+ =
− +
5 90
( ( CLAMP) 1) OGTT
B= p G −G + CL
3600 = PT SC (2) (3) (4) (5)
G0, G120, G90: glucose concentration in the instants 0, 120 and 90 minutes respectively (mg/dL); I0, I120: insulin concentration at the instants 0 and 120 minutes respectively (mUI/mL); D0: dose of glucose per
unit of body surface area (g/m2); V: total volume of distribution (mL/kg); G
CLAMP = 90 (mg/dL); p1 = 650 (min–1); p
2 = 325 (µUI/mL); p3 = 81.3 10
3 (mg·min–1·m–2); p
4 = 132 (µUI/m); p5 = 652 10
–6 (mL/mg)y p
6 = 173 (mL·min–1·m–2); P: weight (Kg); T: subject’s height (cm).
Insulin sensitivity index 4 0 0 10 ISI m m SI
G I G I
= (6)
G0 and Gm: glucose concentrations at the instant 0 minutes and mean glucose values at instants 30, 60, 90
and 120 minutes; I0 and Im: insulin concentrations at the instant 0 minutes and the average of insulin values
at the instants 30, 60, 90 and 120 minutes.
Metabolic
120 90
18.8 0.271 0.0052 0.27
IM
SI = − BMI− I − G (7)
BMI: expressed as the weight divided by height squared (kg/m2); I
120: insulin concentration at 120 minutes
of OGTT (pmol/L); G90: glucose concentration at 90 minutes of the OGTT (mmol/L).
HOMA QUICKI
0 0 405
IR G I
HOMA = 0 0 360 63 β = − CELL I HOMA G 0 0 1 log log QUICKI G I = − (8) (9) (10)
in patients with MS. The database obtained consists of electrocardiographic signals collected during OGTT for a MS group and a control group. Data were analyzed from the point of view of HRV and IS.
The study included 25 subjects - 10 formed the control group and 15 the MS group. The database includes, in addition to traditional variables in the study of subjects with metabolic syndrome (clinical, laboratory and anthropometric variables), the ECG recording during the OGTT. This ECG provides more points of comparison between groups, facilitating the diagnosis of MS. There are alterations in HRV and IS that can appear in a pre-diabetic stage as Metabolic Syndrome. These parameters, HRV and IS, may constitute diagnostic features in the evolution of pre-diabetic patient. This may contribute for easier prevention, diagnosing and managing of important illnesses, such as diabetes and its complications (Navarro and Vargas, 2008).
The ECG acquisition, allowed the calculation of HRV parameters in the time domain (SD and RMSSD) and in the frequency domain (RR, LF, HF and LF/
(LF + HF)). Signiicant differences were found in the
MS group between stages of OGTT for the values
of LF/(LF + HF) – the same was not observed in the control group. This indicates an increase in sympathetic tone during the OGTT in the MS group.
In the study of insulin sensitivity, the following methods were used: integral equation, insulin sensitivity
index, insulin sensitivity, metabolic, HOMA and QUICKI. Signiicant differences between groups in
all methods were found. The MS group showed lower insulin sensitivity compared with the control group,
which represents a metabolic dysfunction relected
in the poor metabolism of glucose.
Conclusion
Globally, the metabolic syndrome is increasing among the population and should be monitored carefully, since it is a precursor to diabetes and cardiovascular disease. The main contribution of this work is the introduction of a methodology that allows, from a noninvasive test such as the electrocardiogram, to obtain parameters that provide a better understanding
of the mechanisms associated with MS. It is expected
that the results obtained in this pilot study provide a basis for future research.
Table 4. Mean anthropometric data and clinical variables for both study groups.
Anthropometric data Control group MS group p values
Age (years) 26.90 ± 4.18 31.40 ± 6.98 NS
Height (m) 1.77 ± 0.09 1.74 ± 0.07 NS
Weight (Kg) 73.01 ± 13.56 104.66 ± 23.14 0.001
Abdominal circumference (cm) 83.51 ± 10.75 113.63 ± 19.35 0.001
Clinical variables measurement Control group MS group p values
Arterial pressure (mmHg)
Systolic 117.60 ± 9.23 135.13 ± 7.10 0.001
Diastolic 72.40 ± 7.23 85.67 ± 10.59 0.006
Body mass index (Kg/m2) 23.30 ± 3.48 34.27 ± 6.68 0.0003
Table 5. Insulin sensitivity according to the following methods: Integral equation, insulin sensitivity index, insulin sensitivity, metabolic, HOMA and QUICKI.
Insulin Sensitivity methods Control group MS group p values
Mean Mean
Integral equation
(dL Kg–1 min–1/(µUI/mL)) 6.31.10–3 ± 5.62.10–3 5.93.10–4 ± 6.21.10–4 0.001
Insulin sensitivity
(mL/min m2) 403.71 ± 26.44 307.86 ± 56.31 0.00006
Insulin sensitivity index 9.57 ± 4.70 3.48 ± 2.90 0.001
Metabolic
(mg/min Kg) 6.99 ± 2.66 4.29 ± 2.83 0.012
HOMAβCELL 40.86 ± 24.22 106.00 ± 59.75 0.006
HOMAIR 0.98 ± 0.64 3.15 ± 1.77 0.001
References
Burattini R, Di Nardo F, Casagrande F, Boemi M, Morosini P. Insulin action and secretion in hypertension in absence of metabolic syndrome: model based assessment from oral glucose tolerance test. Metabolism Clinical and Experimental. 2009; 58:80-92. PMid:19059535. http:// dx.doi.org/10.1016/j.metabol.2008.08.010
CardioSoft. Enhanced cardiology research and development of innovative applications -Open-platform ECG system for research. 2012 Jan [cited 2012 Jan 28]. Available from: http://www.cardiosoft.com/index.html
Chan H, Ming-An L, Pei-Kuang C, Chun-Hsien L. Correlates of the shift in heart rate variability with postures and walking by time-frequency analysis. Computer Methods and Programs in Biomedicine. 2007; 86:124-30. PMid:17403552. http:// dx.doi.org/10.1016/j.cmpb.2007.02.003
Clausen JO, Borch-Johnsen K, Ibsen H, Bergman RN, Hougaard P, Winther K, Pedersen O. Insulin sensitivity index, acute insulin response, and glucose effectiveness in a population-based sample of 380 young healthy Caucasians. The Journal of Clinical Investigation. 1996; 98(5):1195-209. PMid:8787683. PMCid:507542. http://dx.doi.org/10.1172/ JCI118903
Di Nardo F, Casagrande F, Boemi M, Fumelli P, Morosini P, Burattini R. Insulin resistance in hypertension quantiied
by oral glucose tolerance test: comparison of methods. Metabolism Clinical and Experimental. 2006; 55:143-50. PMid:16423619. http://dx.doi.org/10.1016/j. metabol.2005.08.006
Fernandez J. Supericie corporal como indicador de masa muscular en el adulto del sexo masculino. Revista Cubana de Salud Pública. 2003; (29):124-7.
Navarro E, Vargas R. Síndrome metabólico en el suroccidente de barranquilla. Salud Uninorte. 2008; 24(1):40-52. Task Force of the European Society of Cardiology and the North American Society of Pacing and Electrophysiology. Heart rate variability. Standars of measurement, physiological interpretation, and clinical use. Circulation. 1996; 93:1043-65. http://dx.doi.org/10.1161/01.CIR.93.5.1043
Weissman A, Lowenstein L, Peleg A, Thaler I, Simmer EZ. Power espectral analysis of heart rate variability during the 100g oral glucose test in pregnant women. Diabetes Care. 2006; 29:571-4. PMid:16505508. http://dx.doi. org/10.2337/diacare.29.03.06.dc05-2009
Zimmet P, Alberti G. Una nueva deinición mundial del síndrome metabólico por la federación internacional de diabetes: fundamento y resultados. Revista Española de Cardiología. 2005; 58(12):1371-6. http://dx.doi.org/10.1016/ S0300-8932(05)74065-3
Authors
Erika Severeyn*, Sara Wong, Gianfranco Passariello
Grupo de Bioingeniería y Biofísica Aplicada – GBBA¸ Universidad Simón Bolívar – USB, Valle de Sartenejas, Baruta, Caracas, Venezuela
José Luis Cevallos
Laboratorio de Investigaciones Clínicas, Universidad Central de Venezuela – UCV, Ciudad Universitaria, Caracas, Venezuela
Deyanira Almeida