www.the-cryosphere.net/8/877/2014/ doi:10.5194/tc-8-877-2014
© Author(s) 2014. CC Attribution 3.0 License.
The Cryosphere
Bathymetric and oceanic controls on Abbot Ice Shelf thickness and
stability
J. R. Cochran, S. S. Jacobs, K. J. Tinto, and R. E. Bell
Lamont-Doherty Earth Observatory of Columbia University, Palisades, NY 10964, USA
Correspondence to:J. R. Cochran ([email protected])
Received: 29 October 2013 – Published in The Cryosphere Discuss.: 19 November 2013 Revised: 14 March 2014 – Accepted: 26 March 2014 – Published: 15 May 2014
Abstract. Ice shelves play key roles in stabilizing
Antarc-tica’s ice sheets, maintaining its high albedo and returning freshwater to the Southern Ocean. Improved data sets of ice shelf draft and underlying bathymetry are important for as-sessing ocean–ice interactions and modeling ice response to climate change. The long, narrow Abbot Ice Shelf south of Thurston Island produces a large volume of meltwater, but is close to being in overall mass balance. Here we invert NASA Operation IceBridge (OIB) airborne gravity data over the Ab-bot region to obtain sub-ice bathymetry, and combine OIB el-evation and ice thickness measurements to estimate ice draft. A series of asymmetric fault-bounded basins formed during rifting of Zealandia from Antarctica underlie the Abbot Ice Shelf west of 94◦W and the Cosgrove Ice Shelf to the south.
Sub-ice water column depths along OIB flight lines are suffi-ciently deep to allow warm deep and thermocline waters ob-served near the western Abbot ice front to circulate through much of the ice shelf cavity. An average ice shelf draft of
∼200 m, 15 % less than the Bedmap2 compilation, coin-cides with the summer transition between the ocean surface mixed layer and upper thermocline. Thick ice streams feed-ing the Abbot cross relatively stable groundfeed-ing lines and are rapidly thinned by the warmest inflow. While the ice shelf is presently in equilibrium, the overall correspondence between draft distribution and thermocline depth indicates sensitivity to changes in characteristics of the ocean surface and deep waters.
1 Introduction
Ice shelves are found along much of the Antarctic coastline and make up about 11 % of the surface area of Antarctic ice (Fox and Cooper, 1994). These floating extensions of the ice sheets play an important stabilizing role by buttressing and slowing the flow of inland ice across the grounding line (Dupont and Alley, 2005). For example, glaciers feeding into the Larsen A and a portion of the Larsen B accelerated when those ice shelves collapsed (Rott et al., 2002; De Angelis and Skvarca, 2003; Scambos et al., 2004), while glaciers feeding the remnant of the Larsen B in Scar Inlet did not accelerate (Rignot et al., 2004).
Many West Antarctic ice shelves, particularly within the Amundsen Sea Embayment, immediately to the west of the Abbot Ice Shelf, have experienced rapid thinning (e.g., Rig-not, 1998; Shepherd et al., 2004; Pritchard et al., 2012). Much of this thinning has been attributed to bottom melt-ing resultmelt-ing from relatively warm Circumpolar Deep Wa-ter (CDW) circulating on the continental shelf and beneath those ice shelves (e.g., Jacobs et al., 1996, 2011, 2013; Jenkins et al., 2010; Hellmer et al., 1998), and to unpin-ning from the sub-ice bathymetry (Jenkins et al., 2010). Pritchard et al. (2012) indicated that the Abbot is not thin-ning, but assigned it a −1.01 m yr−1 basal melt imbalance
for 2003–2008. Two studies combining satellite measure-ments and firn modeling suggest the Abbot has recently been relatively stable, but differ as to whether it is gaining or losing mass. Rignot et al. (2013) reported an area-average ice thickening of 0.16±0.6 m yr−1 and basal melting of
1.75±0.6 m yr−1, whereas Depoorter et al. (2013) estimated
< 1 m yr−1thinning with basal melting of 2.72±0.7 m yr−1.
Fig. 1.MODIS MOA image of the Abbot Ice Shelf from 2004 show-ing the location of features mentioned in the text. Contours are from the Bamber et al. (2009) DEM, contoured at 100 m intervals. Inset shows its position on the West Antarctic coastline
modeled remarkably similar basal melt rates of 2.1 m yr−1
and 2.01 m yr−1, respectively. All of these rates are lower
than have been calculated during the same time frame for the comparably sized George VI Ice Shelf to the east and Getz to the west (Rignot et al., 2013), a sign of regionally vary-ing influences on the mass balance of southeastern Pacific ice shelves.
Knowledge of the geometry of the seawater cavity under-lying an ice shelf is important for effective modeling of the sub-ice-shelf circulations and assessment of shelf vulnerabil-ity to bottom melting. Altimetry measurements of ice shelf surface elevation may be used to determine ice thickness with the assumption of hydrostatic equilibrium and a model for firn densification with depth (e.g., Griggs and Bamber, 2011). Radar methods can provide ice thickness (e.g., Holland et al., 2009) but cannot penetrate through the underlying water to map the seafloor bathymetry. Seismic techniques (e.g., Jarvis and King, 1995; Johnson and Smith, 1997) and direct obser-vations with autonomous underwater vehicles (Jenkins et al., 2010) have been used to map ice cavity morphology. Both methods are locally accurate but logistically difficult and ex-tremely time-consuming to obtain reasonable coverage.
NASA’s Operation IceBridge (OIB) has systematically collected airborne gravity data over ice shelves, observa-tions that can be inverted for seafloor bathymetry when com-bined with altimetry and radar measurements (Tinto and Bell, 2011; Cochran and Bell, 2012; Muto et al., 2013). Here we invert OIB airborne gravity data to estimate the bathymetry beneath the Abbot Ice Shelf (Fig. 1). We combine the gravity-derived bathymetry with ice thickness data and nearby ocean temperature profiles (Giulivi and Jacobs, 1997; Jacobs et al., 2011) to infer the presence of warm CDW and thermocline waters beneath the ice shelf, and discuss probable ice–ocean interactions.
2 Bathymetry beneath the Abbot Ice Shelf
The Abbot Ice Shelf, with a surface area of about 30 000 km2
including ice rises (Swithinbank et al., 2004; Shepherd et al., 2004; Rignot et al., 2013), is roughly the size of Belgium and extends for 450 km along the Eights Coast of West Antarc-tica between 103 and 89◦W, with an average width of about
65 km (Fig. 1). West of 95◦30′W, Thurston Island bounds the
northern side of the ice shelf, while the eastern half is pinned at the ice front by three islands and extends to the Fletcher Peninsula (Figs. 1 and 2). The western edge of the ice shelf faces the Amundsen Sea Embayment. The Bedmap2 compi-lation (Fretwell et al., 2013) indicates that ice thickness over most of the ice shelf is in the range of 200–325 m. The nu-merous islands and ice rises evident in Fig. 1 suggest a com-plex bathymetry beneath the Abbot.
2.1 Gravity anomalies over the Abbot Ice Shelf
NASA’s OIB program obtained 10 north–south, low-altitude airborne geophysical lines across the Abbot Ice Shelf and an east–west line along the axis of the ice shelf during the 2009 OIB Antarctic campaign (Fig. 2). Spacing between the north–south flights varied from 30 to 54 km with a mean separation of 39.2 km. Instrumentation on these lines in-cluded a laser altimeter, a variety of ice-penetrating radars and a gravimeter. With no OIB lines east of Farwell Island (∼91◦W, Fig. 1), we do not include the easternmost portion
of the Abbot in our analysis.
Surface elevation along the profiles was measured with the NASA Airborne Topographic Mapper (ATM) laser (Kra-bill, 2010), which can recover elevations with an accuracy of about 10 cm (Krabill et al., 2002). Ice thickness was determined using the Multichannel Coherent Radar Depth Sounder (MCoRDS) radar operated by the University of Kansas Center for Remote Sensing of Ice Sheets (CRESIS) (Leuschen, 2011). The base of the ice shelf was not imaged in the radar data for the very westernmost portion (west of 12 km) of our line 0 along the ice shelf axis and for most of line 1 across the westernmost ice shelf. This is likely due to the presence of marine ice near the ice front. We used least-squares regression to determine the relationship of surface elevation to draft in areas where the base of floating ice was clearly observed, and then utilized that relationship to esti-mate the draft in the areas where the base of ice is not ob-served. In a 15 km length of line 1 where the base of the ice was observed, our estimated values, at 0.2 km intervals along the flight line, all agree with the observed draft to within 10 m. In our final data set, mismatches in ice draft at line crossings over floating ice varied from 0.8 to 26.1 m with a standard error of 5.79 m. The laser and radar data were ac-quired on the same flights as the gravity data, so the data sets are coincident in time and space.
-110˚ -110˚
-105˚ -105˚
-100˚ -100˚
-95˚ -95˚
-90˚ -90˚
-85˚
-85˚
-74˚ -74˚
-73˚ -73˚
-72˚ -72˚
-71˚ -71˚
-70˚ -70˚
-80 -60 -40 -20 0 20 40 60 80 100
1
2 3
0
0 10 9
4 5
6 7 8
mG
al
PGA
BGA
Fig. 2.Free-air gravity anomalies from Operation IceBridge flights over the Abbot Ice Shelf plotted along flight lines. Gravity anomalies
in offshore areas are satellite-derived free-air anomalies from McAdoo and Laxon (1997) contoured at 10 mGal intervals. Color scale for airborne and satellite gravity anomalies is shown on the right. Numbers identify profiles shown in Fig. 3 and discussed in the text. PGA, Peacock gravity anomaly; BGA, Bellingshausen gravity anomaly.
(Argyle et al., 2000; Sander et al., 2004). A major advantage of the AIRGrav system compared to other airborne gravime-ters is that it is able to collect high-quality data during draped flights (Studinger et al., 2008) such as the OIB flights over the Abbot Ice Shelf. Flights during OIB surveys are flown at a nominal height of 1500 ft (457 m) above the Earth’s surface. The free-air gravity anomalies were filtered with a 70 s full-wavelength filter, resulting in a ∼4.9 km half-wavelength resolution for a typical flying speed of 140 m s−1 (272 kn).
Differences in the free-air anomalies at line crossings during the Abbot survey vary from 0.09 to 2.61 mGal with a stan-dard error of 0.75 mGal.
Free-air gravity anomalies measured on OIB flights over Abbot Ice Shelf are shown in map view in Fig. 2 and as profiles in Fig. 3. Observed free-air anomalies range from 80 to−61 mGal. Large positive free-air anomalies are found over Thurston Island. The maximum anomaly on line 1, at the western tip of the island, is 42 mGal (Figs. 2 and 3, line 1), but anomalies on the other lines over the island con-sistently reach 55 to 72 mGal (lines 2–6). A large positive anomaly of 77 mGal is also measured over Dustin Island at the edge of the ice shelf immediately east of Thurston Is-land (line 7). Other isIs-lands overflown during the survey also show positive gravity anomalies with recorded anomalies of 17.9 mGal over Johnson Island, 24.9 mGal over Sherman Is-land and 43.1 mGal over Farwell IsIs-land (lines 0, 3 and 8). An east–west band of large positive anomalies with maxi-mum amplitudes of 50–80 mGal also extends along the King Peninsula on the mainland (lines 1–4). This positive grav-ity anomaly extends offshore into the ice shelf east of 98◦W
with a reduced amplitude and dies out near 94◦E (lines 5–8).
Large negative free-air anomalies of −55 to −60 mGal are found southeast of Thurston Island over the northern part of the ice shelf from 96.5 to 94.5◦W and extend
west-ward to 97◦W along the southern edge of a ridge of higher
gravity extending eastward from Sherman and Carpenter is-lands (lines 0 and 5–7). Free-air anomalies over the ice shelf west of Sherman Island are generally in the range of −20 to−35 mGal, although reaching−55 mGal just to the north-west of Sherman Island (lines 0, 1 and 2). Free-air anomalies between Johnson and Farwell Islands in the eastern portion of the survey area are generally between−15 and−35 mGal, reaching−45 to−50 mGal in places (lines 0, 9 and 10).
2.2 Inversion of free-air gravity anomalies
for bathymetry
Inversion of the gravity data for bathymetry was under-taken in two dimensions along individual flight lines using Geosoft GMSys™software. The software does iterative for-ward modeling using the technique of Talwani et al. (1959). The bed was kept fixed where it is observed in the radar data and the bathymetry in water-covered areas (where the seafloor cannot be imaged with radar) varied to obtain the best match to the observed gravity. The model is pinned to the observed gravity value at a location within the region where the bed can be observed.
-1500 -1000 -500 0 500 1000
meters
-1500 -1000 -500 0 500 1000
meters
175 200 225 250 275 300 325 350 375
Kilometers
-40 0 40 80
mGal -400
40 80
mGal
175 200 225 250 275 300 325 350 375
W
E
W
E
Ice (0.915 gm/cm3)
Water (1.03 gm/cm3)
Rock (2.70 gm/cm3)
Dense Rock (2.85 gm/cm3)
Line 0
Model Gravity Anomaly Observed Gravity Anomaly
Farwell Island Johnson
Island
6 7 8 9 10
5
-1500 -1000 -500 0 500 1000
meters
-1500 -1000 -500 0 500 1000
meters
100 125 150 175 200
-40 0 40 80
mGal -40
0 40 80
mGal
100 125 150 175 200
Sherman Island
1 2 3 4 5
0 2
0 2
0 25 50 75
0 25 50 75
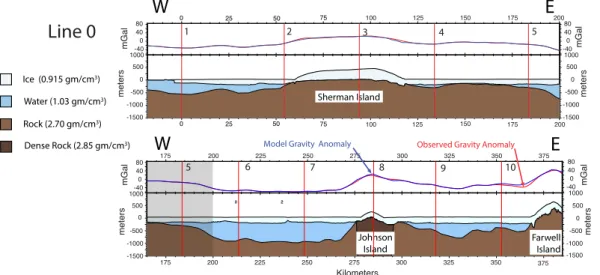
Fig. 3a.Airborne geophysics line 0 along the axis of the Abbot Ice Shelf (Fig. 2) broken into two segments with 35 km of overlap (shaded
area in the lower panel). Vertical red lines show where line 0 intersects north–south lines 1–10 (Fig. 3b). For each segment, the upper panel shows the observed free-air gravity in red and the anomaly predicted by the inversion in blue. Lower panels show the observed upper and lower ice surfaces from laser altimeter and radar measurements, respectively, and the upper surface of the solid Earth. Where ice is grounded, the Earth’s surface is determined from radar measurements. Where ice is floating, the bathymetry is determined from inversion of gravity anomalies.
beneath the Larsen C Ice Shelf (Cochran and Bell, 2012) with a later seismic reflection survey that obtained depths at 87 sites on the ice shelf (Brisbourne et al., 2014). Brisbourne et al. (2014) report that the difference between seismically and gravimetrically determined depths varied from less than 10 m to a maximum of 320 m with a root-mean-square (rms) mis-match of 162 m. We sampled the Cochran and Bell (2012) gravimetrically determined bathymetry grid at the locations of the seismic measurements and found the same difference range (1.6–329 m), but a standard error of 59.0 m. In fact, 84 % of the mismatches were less than the rms difference cited by Brisbourne et al. (2014) (Fig. S1 in the Supplement). Nonetheless, there are several factors that could con-tribute to errors in results obtained with the formal Parker– Oldenburg inversion (Oldenburg, 1974) used by Cochran and Bell (2012). That technique assumes gravity anomalies arise from relief on a single seawater–rock interface with a uni-form density contrast, in turn implying uniuni-form geology, probably unrealistic over an area as extensive as the Larsen C Ice Shelf. The Parker–Oldenburg technique also requires a uniform grid of gravity anomalies. In areas of uneven and somewhat sparse gravity coverage such as the Larsen, inter-polation between measured gravity lines is necessary. In the Larsen inversion, interpolated, rather than measured, gravity values were used at many sites.
The very different technique employed in this study in-volves iterative two-dimensional forward modeling along flight lines, where the gravity anomaly, surface elevation and ice thickness are known. This also allows us the incorpora-tion of lateral variaincorpora-tions in crustal density based on the local geology. We cannot include a sediment layer in the
inver-sions, but will discuss the possible effects of sediments later in this section.
We utilized all available geologic information to constrain crustal density variations and local heterogeneity, noting that rock exposures are limited on the mainland immediately to the south of Abbot. The only outcrops reported in this re-gion are at Lepley Nunatak and in the Jones Mountains. Lep-ley Nunatak, located at 73◦07′S, 90◦19′W (Fig. 1)
immedi-ately to the east of our survey area, exposes granite cut by mafic dikes (Craddock et al., 1969; Grunow et al., 1991). The Jones Mountains, located along the southern margin of the ice shelf between 93◦30′and 94◦45′W at about 73◦30′S
(Fig. 1) reach an elevation of 1500 m to the south of our line 8. The exposed Jones Mountains rocks consist of 500– 700 m of thin Miocene alkalic basalt flows overlying a base-ment of Early Jurassic arc-related granites cut by mafic and felsic dikes, overlain by middle–Late Cretaceous intermedi-ate to felsic lavas (Craddock et al., 1964; Rutford et al., 1972; Grunow et al., 1991; Pankhurst et al., 1993).
Outcrops are more common on Thurston Island, where rocks have been described from about 15 locations (White and Craddock, 1987; Lopatin and Orlenko, 1972; Storey et al., 1991; Pankhurst et al., 1993; Grunow et al., 1991). West-ern Thurston Island, from about 99 to 102◦W, is underlain
primarily by pink granite, although diorite and granodior-ite are found west of∼102◦W at the westernmost end of
the island close to our line 1. East of 99◦W, the
Line 3 Line 4 Kilometers Line 5 -1500 -1000 -500 0 500 meters -1500 -1000 -500 0 500 -50 -25 -40 0 40 80 mGal -40 0 40 80 mGal -50 -25 Line 2 -1500 -1000 -500 0 500 meters -1500 -1000 -500 0 500 meters -50 -25 -40 0 40 80 mGal -40 0 40 80 mGal -50 -25 Thurston Island N S
Line 1 0 25 50
0 25 50
0 25 50 75
0 25 50 75
meters
-50 -25 0 25 50 75
-50 -25 0 25 50 75
-1500 -1000 -500 0 500 meters -40 0 40 80 mGal -1500 -1000 -500 0 500 -40 0 40 80 mGal meters
-50 -25 0 25 50
-50 -25 0 25 50
-1500 -1000 -500 0 500 meters -40 0 40 80 mGal -1500 -1000 -500 0 500 -40 0 40 80 mGal meters
-50 -25 0 25 50
-50 -25 0 25 50
-1500 -1000 -500 0 500 meters -40 0 40 80 mGal -1500 -1000 -500 0 500 -40 0 40 80 mGal meters King Peninsula Thurston Island King Peninsula Thurston Island King Peninsula Sherman Island Thurston Island King Peninsula Thurston Island Eights Coast N S Line 6 Line 7 Line 8 Line 9 Kilometers Line 10 Eights Coast
-50 -25 0 25 50 75
-50 -25 0 25 50 75
-1500 -1000 -500 0 500 meters -40 0 40 80 mGal -1500 -1000 -500 0 500 meters -40 0 40 80 mGal
-50 -25 0 25 50
-50 -25 0 25 50
-1500 -1000 -500 0 500 meters -40 0 40 80 mGal -1500 -1000 -500 0 500 meters -40 0 40 80 mGal
-50 -25 0 25 50
-50 -25 0 25 50
-1500 -1000 -500 0 500 meters -40 0 40 80 mGal -1500 -1000 -500 0 500 meters -40 0 40 80 mGal
-50 -25 0 25 50 75
-50 -25 0 25 50 75
-1500 -1000 -500 0 500 meters -40 0 40 80 mGal -1500 -1000 -500 0 500 meters -40 0 40 80 mGal
-50 -25 0 25 50
-50 -25 0 25 50
-1500 -1000 -500 0 500 meters -40 0 40 80 mGal -1500 -1000 -500 0 500 meters -40 0 40 80 mGal Thurston Island Eights Coast Eights Coast Dustin Island Eights Coast Johnson Island Eights Coast
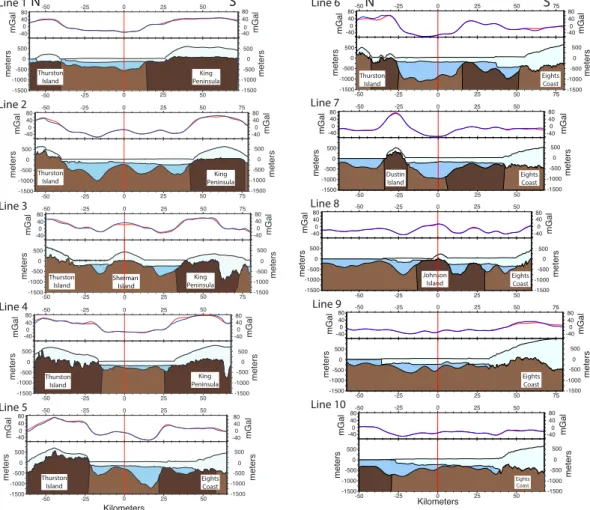
Fig. 3b.As in Fig. 3a, but for the north–south airborne geophysics lines, with vertical red lines indicating intersections with along-axis line 0
(Fig. 3a).
high magnetization”. Amphibolite-grade gneiss was reported from the eastern end of Thurston Island at Morgan Inlet and Cape Menzel (White and Craddock, 1987; Pankhurst et al., 1993) close to our line 6. Several investigators report that Dustin Island at 95◦W, just to the east of Thurston Island
and crossed by our line 7, is made up primarily of gabbro, with diorite also present (White and Craddock, 1987; Storey et al., 1991; Grunow et al., 1991). In summary, granite pre-dominates from 99 to 102◦W with denser rocks (gabbro and
diorite) present at the western and eastern ends of Thurston Island as well as on Dustin Island.
We began by assuming a base model with four bodies: air (0 g cm−3), ice (0.915 g cm−3), seawater (1.03 g cm−3)and
granitic rock (2.70 g cm−3). On lines 1, 4, 5 and 6 across
Thurston Island and line 7 across Dustin Island, we included a denser crustal body (2.85 g cm−3)where gabbro and diorite
outcrop. The upper surface of this dense body is at the radar-determined rock–ice interface and the lower surface deter-mined by the need for the final model to match the observed gravity where the bed is observed on radar both on the islands and on the mainland.
We assume that the high-density bodies beneath Thurston Island are restricted to the island based on two observations. First, the steep gravity gradient at the southern edge of the island on lines 4–6 is much steeper than observed on lines 2 and 3, where no high-density rocks are observed (Fig. 3b). Second, if we continued the high-density region beneath the ice shelf, a significant discrepancy emerges between the north–south and east–west lines. Assuming the dense body is present beneath the ice shelf, the inversions imply∼500 m of water on line 4 between Sherman Island and Carpenter Is-land while the inversions of orthogonal line 0 imply < 300 m of water at that location (Fig. 3). The orthogonal line is well controlled as it matches the gravity over the three islands (Sherman, Johnson and Farwell) where the bed can be ob-served on radar along line 0 (Fig. 3a).
beneath both coasts, we constrained their extent and depth by satisfying the observed anomalies onshore on both sides of the ice shelf where the bed is constrained by radar while also matching the seafloor depth beneath the ice shelf on or-thogonal along-axis line 0 at line crossings.
The zone of high-density crust beneath the King Penin-sula extends offshore under the ice shelf east of 98◦E. In this
area, the amplitude of the free-air anomalies over the ice shelf equals or exceeds that of the anomalies onshore where the ice surface is at an altitude of 500–800 m. If no dense body is in-cluded in this offshore region, the inversion pins the seafloor to the base of the ice and is still unable to match the ob-served anomalies. We used the observation that changes in ice thickness (Fig. 3, lines 5–8) and linear sets of ice rises and ice rumples (Swithinbank et al., 2004) (Fig. 1) underlie peaks in the gravity anomalies to constrain the dense bodies. We set the base of the dense body on each profile so that the seafloor just touched or approached the base of the ice at the locations of the ice rises and steps in ice thickness.
The region of high densities along the King Peninsula de-termined on individual profiles forms a coherent zone delin-eating an east–west-trending high-density body (Fig. 4). The thickness of this high-density body in our models also varies smoothly from profile to profile, increasing from 4.5 km on line 1 to 10–14 km on lines 2–6, then decreasing rapidly east-ward to 3 km on line 7 and 2.4 km on line 8. The high-density body modeled along the southern margin of the ice shelf is nearly in line with a WNW–ESE-trending gravity anomaly located between 105 and 110◦W on the continental shelf
west of the Abbot (McAdoo and Laxon, 1997) (Fig. 2). This “Peacock gravity anomaly” (Larter et al., 2002) was modeled by Gohl et al. (2007) on the basis of shipboard gravity and helicopter magnetics data, as arising from a large magmatic intrusion.
We also needed to introduce a higher-density region cor-responding to higher gravity anomalies at the seaward end of line 10 (Fig. 3b), without which the inferred seafloor reaches the sea surface. The depth to which this high-density body extended was set so that the average water depth along that portion of the profile agrees with the average depth in that area from the IBCSO (International Bathymetric Chart of the Southern Ocean) grid (Arndt et al., 2013). Large pos-itive gravity anomalies in this area appear to be related to an intense high (133 mGal) in the satellite altimetry gravity field (McAdoo and Laxon, 1997) centered at 72◦26.25′S,
89◦52.5′W (Fig. 2), which may result from concentrated
magmatic activity. An ice tongue extends out from the east-ernmost Abbot to the center of the gravity anomaly, suggest-ing the presence of a pinnsuggest-ing bathymetric high at that loca-tion (Fig. 2). This gravity anomaly lies directly on line with Peter I Island and the De Gerlache Seamounts offshore to the north. Early Miocene (20–23 Ma) basalts (Hagen et al., 1998) have been dredged from the De Gerlache Seamounts (∼65◦S, 91◦W), and Late Pleistocene (∼0.3 Ma) basalt
(Prestvik et al., 1990; Prestvik and Duncan, 1991) has been recovered from Peter I Island (∼68◦50′S, 90◦30′W).
In all of these denser regions, there is a trade-off be-tween the assumed density and the thickness determined for the body. If the actual density is greater than the assumed 2.85 g cm−3, the dense body will be thinner, but with
min-imal changes in the inferred bathymetry. We repeated the inversion of line 6 giving the southern dense body a den-sity of 3.0 g cm−3 rather than 2.85 g cm−3 while
maintain-ing the same criterion that the thickness of the dense body is adjusted so that the seafloor just touched or approached the base of the ice at the location of ice rises or abrupt changes in ice thickness. This resulted in a significantly thinner high-density body, but differences in the inferred bathymetry were less than 50 m across the entire region.
We tested the sensitivity of results to the choice of crustal density by repeating the inversion of east–west line 0 as-suming crustal densities that varied by 0.1 g cm−3 around
2.7 g cm−3 while holding the bed fixed where it is visible on radar records on Sherman, Johnson and Farwell islands and pinning the model to observed gravity over Sherman Island. The differences in bathymetry varied directly with water depth and reached a maximum of about 60 m in the deep basin west of Johnson Island (∼225–255 km on line 0, Fig. 3). A higher density results in shallower depths and a lower density in deeper depths.
We have no information on the presence or distribution of sediments and did not include a sediment layer in the mod-eling. If the structure of the seafloor beneath the ice shelf developed from continental rifting in the Late Cretaceous, sediment almost certainly accumulated in the basins prior to glaciation. This sediment may still exist or may have been scoured away. Bedrock is exposed on the inner portions of most Antarctic continental margins, including the Amund-sen Sea Embayment (Wellner et al., 2001; Lowe and Ander-son, 2002). If sediment is present, it will cause the gravity-derived bathymetry to be deeper than the actual seafloor. A simple Bouguer slab calculation implies that each 100 m of sediment with density 2.2 g cm−3will lead to a seafloor depth
-110˚ -110˚
-105˚ -105˚
-100˚ -100˚
-95˚ -95˚
-90˚
-90˚
-74˚ -74˚
-73˚ -73˚
-72˚ -72˚
-71˚ -71˚
-70˚ -70˚
-110˚ -110˚
-105˚ -105˚
-100˚ -100˚
-95˚ -95˚
-90˚
-90˚
-74˚ -74˚
-73˚ -73˚
-72˚ -72˚
-71˚ -71˚
-70˚ Fault -70˚
Limit of rifting Basin
Dense crustal body
4500 4250 4000 3750 3500 3250 3000 2750 2500 2250 2000 1750 1400 1200 1000 800 600 400 200 0
met
ers
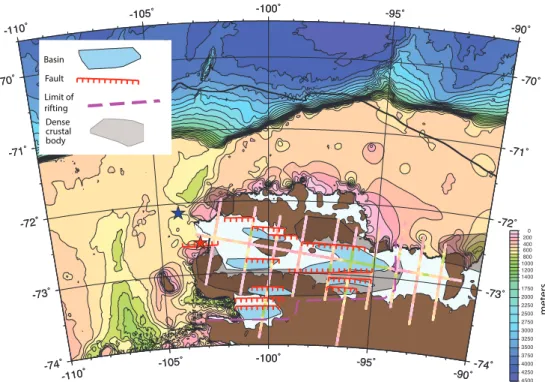
Fig. 4.Basins, faults and the spatial extent of rifting under Abbot and Cosgrove ice shelves, from inversion of Operation IceBridge gravity
data along flight lines. Shaded areas show the extent of the high-density crustal bodies determined from the inversion. Gravity-derived bathymetry and radar-determined bed are shown along flight lines. Offshore marine bathymetry is from the International Bathymetric Chart of the Southern Oceans (IBCSO) (Arndt et al., 2013) contoured at 100 m intervals to 1500 and 250 m intervals for greater depths. Black lines along the western ice front between 72◦30.6′and 72◦42.4′S and across the outer shelf to the north of Abbot show the location of shipboard bathymetry lines discussed in the text. Stars show location of CTD stations nbp9402-0091 (red) and nbp0901-008 (blue) (Giulivi and Jacobs, 1997; Jacobs et al., 2011) shown in Fig. 6.
3 Discussion
3.1 Tectonic setting of the Abbot Ice Shelf
Our inversion for the bathymetry beneath the Abbot Ice Shelf reveals a series of east–west-trending basins of varying depths and widths under the western portion of the ice shelf (Figs. 3, 4 and 5). The basins west of∼97◦W are
asymmet-ric with a steep slope, which we take to be faulted, bound-ing one side. These basins form fault-bounded half grabens. This interpretation is supported by the observation that radar images a deep, asymmetric basin under the King Peninsula that appears fault-bounded on the north and takes the form of a half graben (line 3, Figs. 3 and 5). The northern wall of that basin is steeper than the walls of the gravity-delineated basins, but the gravity-determined slopes are lower due to the 70 s gravity data filter. If we filter the radar-determined bed with the spatial equivalent of the gravity filter, the basin on the King Peninsula has slopes very similar to those in the basins identified from the gravity inversion.
The distribution of interpreted faults and basins is shown in Fig. 4. The entire southern margin of Thurston Island ap-pears to be comprised of overlapping, closely spaced sub-parallel faults. In the western portion of the ice shelf, on
lines 2 and 3, the structure takes the form of a series of south-facing half grabens forming 10–20 km wide topographic basins (Figs. 3b and 4). This pattern continues south across the King Peninsula to the Cosgrove Ice Shelf, which also ap-pears to be underlain by a half graben (Fig. 5).
The tectonic pattern changes east of Carpenter Island, where a set of large inward-facing faults delineate a deep basin that reaches depths of over 1200 m on line 5 (Figs. 3b and 4). Shallower small, asymmetric, fault-bounded basins are located along the southern margin of the ice shelf. Foot-wall rims of the faults bounding the northern side of these basins form sills associated with changes in ice thickness and create linear rows of ice rises and ice rumples on the ice shelf surface (Figs. 1 and 3b line 5 at 28.5 km, line 6 at 18 and 37 km, line 7 at 25 km, line 8 at 25 and 38 km). Rifting in this area does not extend south of the Abbot Ice Shelf as it does farther west (Fig. 5).
-1500 -1000 -500 0 500 1000
meters
-1500 -1000 -500 0 500 1000
meters
-40 0 40 80
mGal -40
0 40 80
mGal
-50 -25 100 125
Thurston Island
Sherman Island
King Peninsula
Canisteo Peninsula
N Line 3 S
Abbot Ice Shelf Cosgrove Ice Shelf
-1500 -1000 -500 0 500 1000
meters
Kilometers
-40 0 40 80
mGal
Line 6
Thurston Island
Eights Coast Abbot Ice Shelf
25
0 50 75
-50 -25 0 25 50 75 100 125
-50 -25 0 25 50 75 100 125
-50 -25 0 25 50 75 100 125
-40 0 40 80
mGal
-1500 -1000 -500 0 500 1000
meters
Fig. 5.Entire length of airborne geophysics lines 3 and 6, as in
Fig. 3, with line locations shown in Fig. 2. Red arrows show the location of faults mapped in Fig. 4. Note that actual faults will be steeper than shown here because of the filter applied to the gravity data.
were intruded prior to about 90 Ma (Leat et al., 1993) into 120–155 Ma plutonic rocks (Grunow et al., 1991) and imply regional extension during that time interval.
This rifted terrain ends abruptly near 94◦W at Johnson
Is-land. The dense crustal body under the southern ice shelf and the King Peninsula also terminates at Johnson Island (Fig. 4). The bathymetry inferred beneath the ice shelf on lines 9 and 10 (Fig. 3) located east of 94◦W between Johnson and
Far-well Islands is shallower, with gentler slopes than in the west, and shows no features suggesting tectonic activity.
The tectonic boundary at 94◦W is directly on line with
a linear, north–south-oriented bathymetric and gravity struc-ture, the Bellingshausen gravity anomaly (BGA) of Gohl et al. (1997), in the deep ocean north of the continental margin (Figs. 2 and 4). The BGA structure developed along a Cre-taceous ridge–trench transform separating the Phoenix and Pacific plates (Larter et al., 2002). Rifting nucleated along this transform, probably at an intra-transform spreading cen-ter (Bird and Naar, 1994), at about 90 Ma and propagated westward, splitting the Chatham Rise and Campbell Plateau from Antarctica (Larter et al., 2002; Eagles et al., 2004). The tectonic boundary at 94◦W beneath the Abbot Ice Shelf
im-plies that this rifting originally extended into the Antarctic continent before focusing north of Thurston Island.
The Abbot to the west of 94◦W occupies a different
ge-ologic and tectonic setting than most ice shelves, which are formed when the ice streams advance across the continen-tal shelf, thin and begin to float. The Abbot instead overlies a preexisting basin with well-defined and stable grounding lines defined by the tectonic structure along both the north-ern and southnorth-ern boundaries of most of the rift basin.
700 600 500 400 300 200 100 0
Depth (meters)
−2.0 −1.0 0.0 1.0 2.0 3.0 4.0 Temperature (°C)
T
A
NBP9402-091
NBP0901-008
700 600 500 400 300 200 100 0
Depth (meters)
0 10 20 30
Abbot Area (%)
B
T - Tf
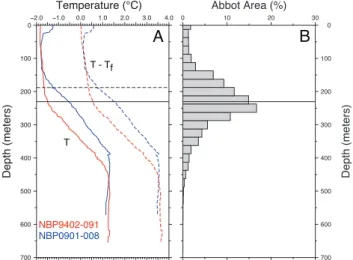
Fig. 6. (a)Measured temperature (T) and calculated temperature
above the in situ freezing point (T−Tf)on 13 March 1994 (CTD
091) and 14 January 2009 (CTD 008) (Giulivi and Jacobs, 1997; Ja-cobs et al., 2011) at the locations shown in Fig. 4.(b)Depth distri-bution of Abbot Ice Shelf drafts calculated from the 1 km Bedmap2 compilation of surface elevation and ice thickness (Fretwell et al., 2013). Solid horizontal lines show the mean draft determined
from the Bedmap2 compilation; dashed line in(a)shows the mean
draft determined from OIB surface elevation and ice thickness data (Fig. 7).
3.2 Ocean–ice interactions beneath the Abbot Ice Shelf
The IBCSO bathymetry grid shows a trough on the conti-nental shelf that extends northward along the western end of Thurston Island to the shelf break (Fig. 4). With a minimum depth of 575 m at∼72◦05′S, this trough is sufficiently deep
to allow the southward passage of warm deep water (Hellmer et al., 1998; Jacobs et al., 2011). Ocean temperature profiles at two CTD stations near the western ice front of the Abbot, marked by stars in Fig. 4, encountered CDW at depths be-low about 400 m (Fig. 6). Temperatures are > 3◦C above the
melting point of ice at those depths, and the overlying ther-mocline is > 1◦above freezing at depths up to∼200–250 m.
While the contoured IBCSO bathymetric grid suggests shoaling bathymetry eastward from station 91 toward the ice front, bathymetric data were lacking in that region (Arndt et al., 2013). A post-IBCSO 2012 RRS Shackleton single-beam echo sounder line (location shown in Fig. 4) shows about 800 m of water near the ice front at the base of the fault just south of station 91 (F. Nitsche, personal communi-cation, 2013). The shoaling is thus a gridding artifact in the IBCSO grid and is masked in Fig. 4.
500 400 300 200 100 0
Depth (meters)
0 10 20 30
Abbot Area (%)
BM2 sampled Draft
D
500 400 300 200 100 0
Depth (meters)
0 10 20 30
Abbot Area (%)
OIB Draft
C
010 20 30 40 50 60 70
Elevation (meters)
0 10 20 30
OIB Elevation
A
0 10 20 30 40 50 60 70
Elevation (meters)
0 10 20 30
BM2 sampled Elevation
B
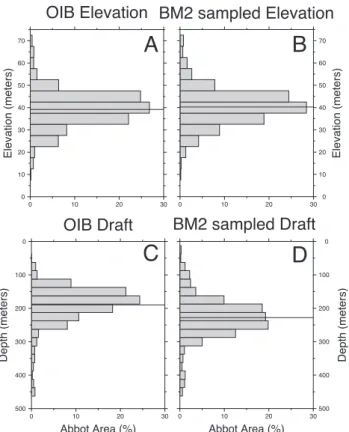
Fig. 7.Distribution of Abbot Ice Shelf surface elevations and drafts
below the sea surface.(A)Surface ice elevation from OIB altimeter data at 0.2 km intervals along flight lines.(B)Surface ice elevation from Bedmap2 surface elevation grid sampled at the same locations
as the OIB elevation data.(C)Draft from OIB altimeter and radar
data at 0.2 km intervals along flight lines.(D)Draft from the grid of Bedmap2 drafts sampled at the same locations as the OIB draft data. Horizontal lines show the mean values for each set of mea-surements.
they have access to and from the ice shelf cavity. The shal-lowest passage between the western and eastern sectors of the cavity is about 465 m (Fig. 3b, line 4), well within the CDW depth range in Fig. 6.
The deep eastern rift basin may also open onto the Belling-shausen Sea continental shelf between Dustin Island and Mc-Namara Island through a trough reaching a calculated depth of 785 m near−22 km on line 8 (Fig. 3b). Thermocline wa-ters and CDW may also flow through this cavity opening. IBCSO bathymetry to the north, very poorly constrained by sparse shipboard measurements (Graham et al., 2011; Arndt et al., 2013), does not define any bathymetric troughs extend-ing toward the edge of the continental shelf. A 1999 RV/IB
Nathaniel B. Palmerbathymetric line across the outer shelf
north of Abbot (location shown in Fig. 4) also does not re-veal any distinct troughs, but its continental shelf depths of 397–558 m are comparable to the CDW depths in Fig. 6. The depth of outer shelf sills is the primary control on CDW ac-cess to ice shelf cavities (e.g., Fig. 4 in Jacobs et al., 2013).
The Abbot Ice Shelf draft, calculated from the Bedmap2 compilation (Fretwell et al., 2013), averages 230.2 m b.s.l., with the base of the ice shallower than 300 m b.s.l. over 84 % of its area (Fig. 6). The mean Abbot Ice Shelf draft from along-track OIB altimeter and radar measurements is 189.7 m, ∼40 m less than the value obtained from the Bedmap2 compilation sampled at the same locations (Figs. 6 and 7). However, the OIB and Bedmap2 surface elevation distributions are similar, with insignificantly different means of 39.2 and 40.2 m (Fig. 7), indicative of anomalies in one or both draft calculations.
No firn corrections are applied to OIB MCoRDS radar measurements (Leuschen, 2011), which could lead to thick-ness underestimates of∼10 m (Fretwell et al., 2013). Radar results can also underestimate total thickness where bottom returns come from meteoric-ice–marine-ice interfaces. Ma-rine ice is probably not widespread at the base of the Abbot, but might be expected where ice drafts are less than adjacent near-freezing winter mixed layer depths (Fig. 6).
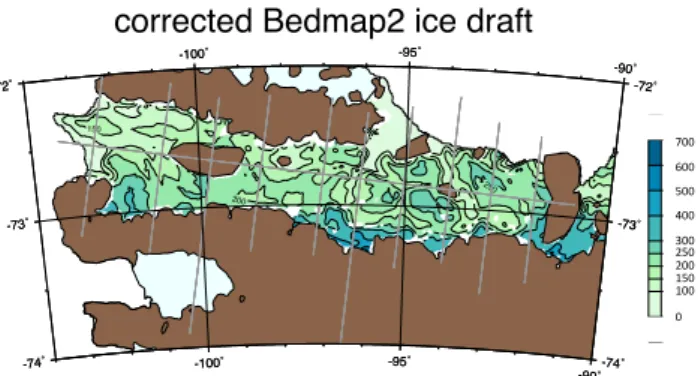
The Bedmap2 compilation utilized the Griggs and Bam-ber (2011) determination of ice shelf thickness, based on a firn densification model and the thickness necessary to sup-port the observed elevations assuming hydrostatic equilib-rium. Bedmap2 applied corrections of−21 to−81 m, based on firn-corrected radar data, to most of the Griggs and Bam-ber (2011) ice shelf thickness values in the Amundsen sec-tor (Fretwell et al., 2013). Since appropriate data were not available, no corrections were applied to the Abbot (Fretwell et al., 2013). Applying a 10 m firn correction to the OIB radar data suggests that the Bedmap2 values need to be re-duced by 30 m to bring the two into agreement. Figure 8 shows the revised Bedmap2 ice draft distribution. The mean draft is∼200 m, with 78 % of the ice shelf less than 250 m (Fig. 8). The average draft corresponds to the upper portion of the summer thermocline and base of the surface mixed layer (Fig. 6), similar to conditions reported for Wilkins Ice Shelf in the Bellingshausen Sea (Padman et al., 2012). The near surface “winter water” layer will cool and thicken sea-sonally, raising and lowering the upper thermocline, in turn influencing basal melt rates, as in the southern Amundsen Sea (Jacobs et al., 2013; Dutrieux et al., 2014).
Regions of thicker ice are confined to the southern margin of the ice shelf near the grounding lines and to the eastern area around Farwell Island (Fig. 8). This deeper ice extends more than a few kilometers from grounding lines only at lo-cations where fault footwall rims marked by linear sets of ice rises limit access by CDW and lower thermocline water (e.g., Fig. 3 line 6). Most of the ice shelf draft thus appears to be controlled by the thickness of the cold surface water overlaying the thermocline (Figs. 6 and 8).
-100˚
-100˚
-95˚
-95˚
-90˚
-90˚
-74˚ -74˚
-73˚ -73˚
-72˚ -72˚
150
200
250
corrected Bedmap2 ice draft
-100˚
-100˚
-95˚
-95˚
-90˚
-90˚
-74˚ -74˚
-73˚ -73˚
-72˚ -72˚
0 100 150 200 250 300 400 500 600 700
700
600
500
400
300 250 200 150 100
0
Fig. 8.Abbot Ice Shelf draft calculated from the 1 km Bedmap2
compilation of surface elevation and ice thickness (Fretwell et al., 2013) corrected as discussed in the text and contoured at 100 m in-tervals with 150 and 250 m contours added. Grey lines show OIB flight lines. Color bar gives ice draft in meters.
would be consistent with its exposure to CDW and lower thermocline waters as well as the mixing effects of tidal cur-rents in areas of low water cavity thickness near sills formed by the footwall rims (Mueller et al., 2012). Once the shelf ice has thinned to the depth range of upper thermocline and lower surface waters, its melting or freezing will depend on temporal variability of the upper ocean thermal struc-ture and the density-driven cavity circulation. Upwelling and downwelling responses to “local” winds, as observed near the Wilkins Ice Shelf (L. Padman, personal communication, 2014), may be less common near the Abbot, which is typi-cally surrounded by nearly fast sea ice in winter.
With an overall average draft of∼200 m, much of the Ab-bot will be sensitive to interannual variability in depth of the surface mixed layer, which can be high in the Amundsen Sea (Jacobs et al., 2013). Surface water properties depend mainly on atmospheric forcing, as does the ice shelf surface, where seasonal melting can cause instability by enhancing crevasse propagation (Scambos et al., 2000; Banwell et al., 2013). The current surface melt intensity on the Abbot is less than at ice shelves on the Antarctic Peninsula (Trusel et al., 2012), but its relatively thin state, low latitude for West Antarctica and exposure to the shifting Amundsen Sea low (Turner et al., 2013) make it more vulnerable than thicker shelf ice to in-creased summer air temperatures.
4 Conclusions
Inversion of NASA Operation IceBridge gravity data show the Abbot Ice Shelf west of 94◦W to be underlain by a
series of rift basins related to rifting between Antarctica and Chatham Rise in the Late Cretaceous. West of 99◦W,
the region of rifting extends farther south and includes the Cosgrove Ice Shelf; east of 94◦W, the bathymetry is
shal-lower and unmodified by tectonic activity. Gravimetrically determined depths reach 900–1200 m in deep basins of the
eastern Abbot rift. The presence of 1000 m of sediment in these basins would make actual depths 300 m shallower. The rift structures along with the likely thin sediment in shallower areas present pathways for seawater to circulate under much of the ice shelf.
OIB radar data show mean ice draft of∼200 m, correct-ing the Bedmap2 compilation by−30 m, with 78 % of ice shelf having a draft of less than 250 m. The Abbot is similar in some ways to the Getz Ice Shelf, without connections to large ice drainage basins and fast or broad ice streams, but it is thinner and overlies tectonically formed basins. The bed in surrounding areas on Thurston Island and the Eights Coast is near or above sea level, and other reports place the Abbot close to a state of mass balance between inflow, accumula-tion, minor calving and basal melting.
Sparse oceanographic measurements show a thermocline overlying “warm” CDW near the western Abbot ice front, with temperatures from 1 to > 3◦C above the in situ
melt-ing point up to 200–250 m. The CDW and lower thermocline waters will rapidly melt thicker inflowing ice. Most of the ice shelf draft distribution occupies the same depth range as the thermocline, making it sensitive to changes in thick-ness of the surface and deep waters. With an average near-equilibrium thickness coinciding with the transition region between the upper thermocline and cold surface water, the ice will respond to seasonal and longer-term forcings that change surface water characteristics and CDW volume on the continental shelf.
Supplementary material related to this article is
available online at http://www.the-cryosphere.net/8/877/ 2014/tc-8-877-2014-supplement.pdf.
Acknowledgements. We thank M. Studinger, N. Frearson, S. Elieff
and S. O’Rourke with OIB and the RV/IB Nathaniel B. Palmer
shipboard scientific party for their efforts during the 2009 field season. L. Padman, T. Scambos and A. Brisbourne undertook thoughtful reviews that greatly improved the paper. We also thank
F. Nitsche for providing the RRSShackletonbathymetry line along
the Abbot ice front and Alex Brisbourne for making the results of the BAS Larsen C seismic survey available to us. S. Starke provided technical assistance. This work was support by NASA grants NNX09AR49G, NNX10AT69G and NNX13AD25A, NSF grant ANT-06-32282 and Lamont-Doherty Earth Observatory of Columbia University. LDEO contribution no. 7790.
References
Argyle, M., Ferguson, S., Sander, L., and Sander, S.: AIRGrav re-sults: A comparison of airborne gravity data with GSC test site data, The Leading edge, 19, 1134–1138, 2000.
Arndt, J. S., Schenke, H. W., Jakobsson, M., Nitsche, F. O., Buys, G., Goleby, B., Rebesco, M., Bohoyo, F., Hong, J., Black, J., Greku, R., Udintsev, G. B., Barrios, F., Reynoso-Peraltra, W., Taisai, M., and Wigley, R.: The International Bathymetric Chart of the Southern Ocean (IBCSO) Version 1.0 – A new bathymet-ric compilation covering circum-Antarctic waters, Geophys. Res. Lett., 40, 3111–3117, doi:10.1002/grl.50413, 2013.
Bamber, J. L., Gomez-Dans, J. L., and Griggs, J. A.: Antarctic 1 km Digital Elevation Model (DEM) from Combined ERS-1 Radar and ICESat Laser Satellite Altimetry, National Snow and Ice Data Center, Boulder CO., Digital media., http://nsidc.org/ data/docs/daac/nsidc0422_antarctic_0421km_dem (last access: 7 April 2010), 2009.
Banwell, A. F., MacAyeal, D. R., and Sergienko, O. V.: Breakup of the Larsen B Ice Shelf triggered by chain reaction drainage of supraglacial lakes, Geophys. Res. Lett., 40, 5872–5876, doi:10.1002/2013GL057694, 2013.
Bird, R. T. and Naar, D. F.: Intratransform origins of mid-ocean ridge microplates, Geology, 22, 987–990, 1994.
Brisbourne, A. M., Smith, A. M., King, E. C., Nicholls, K. W., Hol-land, P. R., and Makinson, K.: Seabed topography beneath Larsen C Ice Shelf from seismic soundings, The Cryosphere, 8, 1–13, doi:10.5194/tc-8-1-2014, 2014.
Cochran, J. R. and Bell, R. E.: IceBridge Sander AIRGrav L1B Ge-olocated Free Air Gravity Anomalies, V01.5, digital media, Na-tional Snow and Ice Data Center, Boulder, Colorado, 2010. Cochran, J. R. and Bell, R. E.: Inversion of IceBridge
gravity data for continental shelf bathymetry beneath the Larsen ice shelf, Antarctica, J. Glaciol., 58, 540–552, doi:10.3189/2012JoG11J033, 2012.
Craddock, C., Bastien, T. W., and Rutford, R. H.: Geology of the Jones Mountains area, in: Antarctic Geology: Proceedings of the First International Symposium on Antarctic Geology, edited by: Adie, R. J., North Holland Publishing, Amsterdam, 171–187, 1964.
Craddock, C., White, C. M., and Rutford, R. H.: The geology of the Eights Coast, Antarct. J. US, 4, 93–94, 1969.
De Angelis, H. and Skvarca, P.: Glacier surge after ice shelf col-lapse, Science, 99, 1560–1562, 2003.
Depoorter, M. A., Bamber, J. L., Griggs, J. A., Lenaerts, J., Ligten-berg, S. R. M., van den Broeke, M. R., and Moholdt, G.: Calving fluxes and basal melt rates of Antarctic ice shelves, Nature, 502, 89–93, doi:10.1038/nature12567, 2013.
Dupont, T. K. and Alley, R. B.: Assessment of the importance of ice-shelf buttressing to ice-shelf flow, Geophys. Res. Lett., 32, L04503, doi:10.1029/2004GL022024, 2005.
Dutrieux, P., De Rydt, J., Jenkins, A., Holland, P. R., Ha, H. K., Lee, S. H., Steig, E. J., Ding, Q., Abrahamsen, E. P., and Schroeder, M.: Strong sensitivity of Pine Island ice shelf melting to climate variability, Science, 343, 174–178, doi:10.1126/science.1244341, 2014.
Eagles, G., Gohl, K., and Larter, R. D.: High-resolution ani-mated tectonic reconstruction of the South Pacific and West Antarctic Margin, Geochem. Geophy. Geosy., 5, Q07002, doi:10.1029/2003GC000657, 2004.
Fox, A. J. and Cooper, P. R.: Measured properties of theAntarctic ice sheet derived from the SCAR Antarctic digital database, Polar Rec., 30, 201–206, 1994.
Fretwell, P., Pritchard, H. D., Vaughan, D. G., Bamber, J. L., Bar-rand, N. E., Bell, R., Bianchi, C., Bingham, R. G., Blankenship, D. D., Casassa, G., Catania, G., Callens, D., Conway, H., Cook, A. J., Corr, H. F. J., Damaske, D., Damm, V., Ferraccioli, F., Fors-berg, R., Fujita, S., Gim, Y., Gogineni, P., Griggs, J. A., Hind-marsh, R. C. A., Holmlund, P., Holt, J. W., Jacobel, R. W., Jenk-ins, A., Jokat, W., Jordan, T., King, E. C., Kohler, J., Krabill, W., Riger-Kusk, M., Langley, K. A., Leitchenkov, G., Leuschen, C., Luyendyk, B. P., Matsuoka, K., Mouginot, J., Nitsche, F. O., Nogi, Y., Nost, O. A., Popov, S. V., Rignot, E., Rippin, D. M., Rivera, A., Roberts, J., Ross, N., Siegert, M. J., Smith, A. M., Steinhage, D., Studinger, M., Sun, B., Tinto, B. K., Welch, B. C., Wilson, D., Young, D. A., Xiangbin, C., and Zirizzotti, A.: Bedmap2: improved ice bed, surface and thickness datasets for Antarctica, The Cryosphere, 7, 375–393, doi:10.5194/tc-7-375-2013, 2013.
Giulivi, C. F. and Jacobs, S. S.: Oceanographic data in the
Amundsen and Bellingshausen Seas;N.B. Palmer Cruise 9402,
February–March 1994. Technical Report LDEO-97-3, Lamont-Doherty Earth Observatory of Columbia University, Palisades, New York, USA, 330 pp., 1997.
Gohl, K., Nitsche, F. O., and Miller, H. L.: Seismic and gravity data reveal Tertiary interplate subduction in the Bellingshausen Sea, southeast Pacific, Geology, 25, 371–374, 1997.
Gohl, K., Teterin, D., Eagles, G., Netzeband, G., Grobys, J. W. G., Parsiegla, N., Schlüter, P., Leinweber, V., Larter, R. D., Uenzelmann-Neben, G., and Udintsev, G. B.: Geophysical sur-vey reveals structures in the Amundsen Sea embayment, West Antarctica, in: Proceedings of the 10th Int. Symposium of Antarctic Earth Sciences, USGS Open-File Report 2007-1047, edited by: Cooper, A. K. and Raymond, C. R., 2007.
Graham, A. G. C., Nitsche, F. O., and Larter, R. D.: An improved bathymetry compilation for the Bellingshausen Sea, Antarctica, to inform ice-sheet and ocean models, The Cryosphere, 5, 95– 106, doi:10.5194/tc-5-95-2011, 2011.
Griggs, J. A. and Bamber, J. L.: Antarctic ice-shelf thickness from satellite radar altimetry, J. Glaciol., 57, 485–498, 2011. Grunow, A. M., Kent, D. V., and Dalziel, I. W. D.: New
paleomag-netic data from Thurston Island: Implications for the tectonics of West Antarctica and Weddell Sea opening, J. Geophys. Res., 96, 17935–917954, 1991.
Hagen, R. A., Gohl, K., Gesonde, R., Kuhn, G., Völker, D., and Kodagali, V. N.: A geophysical survey of the De Gerlache Seamounts: preliminary results, Geo-Mar. Lett., 18, 19–25, 1998. Hellmer, H. H., Jacobs, S. S., and Jenkins, A.: Oceanic erosion of a floating Antarctic glacier in the Amundsen Sea, in: Ocean, Ice and Atmosphere: Interactions at the Antarctic Continetal Mar-gins; Ant. Res. Ser. v75, edited by: Jacobs, S. S. and Weiss, R. F., Am. Geophys. Un., Washington, D.C., 83–99, 1998. Holland, P. R., Corr, H. F. J., Vaughan, D. G., Jenkins, A., and
Skvarca, P.: Marine ice in Larsen ice shelf, Geophys. Res. Lett., 36, L11604, doi:10.1029/2009GL038162, 2009.
Jacobs, S. S., Jenkins, A., Giulivi, C. F., and Dutrieux, P.: Stronger ocean circulation and increased melting under Pine Island Glacier ice shelf, Nat. Geosci., 4, 519–523, doi:10.1038/NGEO1188, 2011.
Jacobs, S. S., Giulivi, C. F., Dutrieux, P., Rignot, E., Nitsche, F. O., and Mouginot, J.: Getz Ice Shelf melting response to changes in ocean forcing, J. Geophys. Res., 118, 4152–4168, , doi:10.1002/jgrc.20298, 2013.
Jarvis, E. P. and King, E. C.: Seismic investigation of the Larsen Ice Shelf, Antarctica: in search of the Larsen Basin, Antarct. Sci., 7, 181–190, 1995.
Jenkins, A., Dutrieux, P., Jacobs, S. S., McPhail, S. D., Perrett, J. R., Webb, A. T., and White, D.: Observations beneath Pine Island Glacier in West Antarctica and implications for its retreat, Nat. Geosci., 3, 468–472, doi:10.1038/NGEO890, 2010.
Johnson, M. R. and Smith, A. M.: Seabed topography under the southern and western Ronne Ice Shelf, derived from seismic sur-veys, Antarct. Sci., 9, 201–208, 1997.
Krabill, W.: IceBridge ATM L2 Icessn Elevation, Slope, and Rough-ness, V01, digital media , National Snow and Ice Data Center, Boulder, Colorado, 2010.
Krabill, W., Abdalati, W., Frederick, E. R., Manizade, S. S., Martin, C. F., Sonntag, J. G., Swift, R. N., Thomas, R. H., and Yungel, J. G.: Aircraft laser altimetry measurement of elevation changes of the Greenland Ice Sheet: techniques and accuracy assessment, J. Geodyn., 34, 357–376, 2002.
Kusahara, K. and Hasumi, H.: Modeling Antarctic ice shelf re-sponses to future climate change and impacts on the ocean, J. Geophys. Res., 118, 2454–2475, doi:10.1002/jgrc.20166, 2013. Larter, R. D., Cunningham, A. P., Barker, P. F., Gohl, K., and
Nitsche, F. O.: Tectonic evolution of the Pacific margin of Antarctica 1. Late Cretaceous tectonic reconstructions, J. Geo-phys. Res., 107, 2345, doi:10.1029/2000JB000052, 2002. Leat, P. T., Storey, B. C., and Pankhurst, R. J.: Geochenistry of
Palaeozoic-Mesozoic Pacific rim orogenic magmatism, Thurston Island area, West Antarctica, Antarct. Sci., 5, 281–296, 1993. Leuschen, C.: IceBridge MCoRDS L1B Geolocated Radar Echo
Strength Profiles, V01.3, digital media, National Snow and Ice Data Center, Boulder, Colorado, 2011.
Lopatin, B. G. and Orlenko, E. M.: Outline of the geology of Marie Byrd Land and the Eights Coast, in: Antarctic Geology and Geo-physics, edited by: Adie, R. J., Universitetsforlage, Oslo, 245– 250, 1972.
Lowe, A. L. and Anderson, J. B.: Reconstruction of the West Antarctic ice sheet in Pine Island Bay during the Last Glacial Maximum and its subsequent retreat history, Quaternary. Sci. Rev., 21, 1879–1897, 2002.
McAdoo, D. C. and Laxon, S. W.: Antarctic tectonics: Constraints from an ERS-1 satellite marine gravity field, Science, 276, 556– 560, doi:10.1126/science.276.5312.556, 1997.
Mueller, R. D., Padman, L., Dinniman, M. S., Erofeeva, S., Y„ Fricker, H. A., and King, M. A.: Impact of tide-topography in-teractions on basal melting of Larsen C Ice Shelf, Antarctica, J. Geophys. Res., 117, C05005, doi:10.1029/2011JC007263, 2012. Muto, A., Anandakrishnan, S., and Alley, R. B.: Subglacial bathymetry and sediment layer distribution beneath the Pine Is-land Glacier ice shelf, West Antarctica, modeled using aerograv-ity and autonomous underwater vehicle data, Ann. Glaciol., 54, 27–32, doi:10.3189/2013AoG64A110, 2013.
Oldenburg, D. W.: The inversion and interpretation of gravity anomalies, Geophysics, 39, 536–536, 1974.
Padman, L., Costa, D. P., Dinniman, M. S., Fricker, H. A., Goebel, M. E., Huckstadt, L. A., Humbert, A., Joughin, I., Lenaerts, J., Ligtenberg, S. R. M., Scambos, T. A., and van den Broeke, M. R.: Ocean controls on the mass balance of Wilkins Ice Shelf, Antarctica, J. Geophys. Res., 117, C01010, doi:10.1029/2011JC007301, 2012.
Pankhurst, R. J., Millar, I. L., Grunow, A. M., and Storey, B. C.: The pre-Cenozoic magmatic history of the Thurston Island crustal block, West Antarctica, J. Geophys. Res., 98, 11835—11849, 1993.
Prestvik, T. and Duncan, R. A.: The geology and age of Peter 1 Øy, Antarctica, Polar Res., 9, 89–98, 1991.
Prestvik, T., Barnes, C. G., Sundvoll, B., and Duncan, R. A.: Petrol-ogy of Peter I Øy (Peter I Island), West Antarctica, J. Volcanol. Geoth. Res., 44, 315–338, 1990.
Pritchard, H. D., Ligtenberg, S. R. M., Fricker, H. A., Vaughan, D. G., van der Broeke, M. R., and Padman, L.: Antarctic ice-sheet loss driven by basal melting of ice shelves, Nature, 484, 502–505, doi:10.1038/nature10968, 2012.
Rignot, E.: Fast recession of a West Antarctic glacier, Science, 549, 549–551, doi:10.1126/science.281.5376.549, 1998.
Rignot, E., Casassa, G., Gogineni, P., Krabill, W., Rivera, A., and Thomas, R. H.: Accelerated ice discharge from the Antarctic Peninsula following the collapse of the Larsen B ice shelf, Geo-phys. Res. Lett., 31, L18401, doi:1029/2004GL020697, 2004. Rignot, E., Jacobs, S. S., Mouginot, J., and Scheuchl, B.:
Ice shelf melting around Antarctica, Science, 341, 266–270, doi:10.1126/science.1235798, 2013.
Rott, H., Rack, W., Skvarca, P., and De Angelis, H.: Northern Larsen ice shelf, Antarctica: Further retreat after collapse, Ann. Glaciol., 34, 277–282, 2002.
Rutford, R. H., Craddock, C., White, C. M., and Armstrong, R. L.: Tertiary glaciation in the Jones Mountains, in: Antarctic Geology and Geophysics, edited by: Adie, R. J., Universitetsforlage, Oslo, 239–243, 1972.
Sander, S., Argyle, M., Elieff, S., Ferguson, S., Lavoie, V., and Sander, L.: The AIRGrav aiborne gravity system, in: Airborne Gravity 2004 – Australian Society of Exploration Geophysi-cists Workshop, edited by: Lane, R., Geoscience Australia, avail-able at: http://sgl.com/technicalpapers/AIRGrav_airborne_grav_ sys.pdf (last access: 5 October 2010), 49–53, 2004.
Scambos, T. A., Hulbe, C. L., Fahnestock, M. A., and Bohlander, J.: The link between climate warming and the break-up of ice shelves in the Antarctic Peninsula, J. Glaciol., 46, 516–530, 2000.
Scambos, T. A., Bohlander, J. A., Shuman, C. A., and Skvarca, P.: Glacier acceleration and thinning after ice shelf collapse in the Larsen Bembayment, Antarctica, Geophys. Res. Lett., 31, L18402, doi:10.1029/2004GL020670, 2004.
Shepherd, A., Wingham, D., and Rignot, E.: Warm ocean is eroding West Antarctica, Geophys. Res. Lett., 31, L23402, doi:10.1029/2004GL021106, 2004.
Studinger, M., Bell, R. E., and Frearson, N.: Comparison of AIR-Grav and GT-1A airborne gravimeters for research applications, Geophysics, 73, 151–161, 2008.
Swithinbank, C., Williams, R. S., Ferrigno, J. G., Foley, K. M., Rosanova, C. E., and Dallide, L. M.: Coastal-change and glacio-logical map of the Eights Coast area, Antarctica 1972–2001, Text to accompany Map I-2600-E, U.S. Geological Survey Geologic Investigations Series Map I-2600-E, 2004.
Talwani, M., Worzel, J. L., and Landisman, M.: Rapid gravity com-putations for two-dimensional bodies with application to the Mendicino submarine fracture zone, J. Geophys. Res., 64, 49– 59, 1959.
Timmermann, R., Wang, Q., and Hellmer, H. H.: Ice-shelf basal melting in a global finite element sea-ice/ice-shelf/ocean model, Ann. Glaciol., 53, 303–314, doi:10.3189/2012AoG60A156, 2012.
Tinto, K. J. and Bell, R. E.: Progressive unpinning of Thwaites Glacier from newly identified offshore ridge – con-straints from aerogravity, Geophys. Res. Lett., 38, L20503, doi:10.1029/2011GL049026, 2011.
Trusel, L. D., Frey, K. E., and Das, S. B.: Antarctic surface melting dynamics: Enhanced perspectives from radar scatterometer data, J. Geophys. Res., 117, F02023, doi:10.1029/2011JF002126, 2012.
Turner, J., Phillips, T., Hosking, J. S., Marshall, G., J., and Orr, A.: The Amundsen Sea Low, Int. J. Climatol., 33, 1818–1829, doi:10.1002/joc.3558, 2013.
Wellner, J. S., Lowe, A. L., Shipp, S. S., and Anderson, J. B.: Dis-tribution of glacial geomorphic features on the Antarctic conti-nental shelf and correlation with substrate: Implications for ice behavior, J. Glaciol., 47, 397–411, 2001.