The Perceptual and Statistics Characteristic of Spatial Cues
and its application
Heng Wang1,2, Ruimin Hu 1, Weiping Tu 1 and Cong Zhang2
1
National Engineering Research Center for Multimedia Software, Wuhan University
Wuhan, China
2
School of Mathematic & Computer Science Wuhan Polytechnic University
Wuhan, China
Abstract
In present mobile communication system, low bit rate audio signal is supposed to be provided with high quality. This paper researches the mechanism exists of perceptual and statistics redundancy in spatial cues and establishes a selection model by joint perceptual and statistics characteristic of spatial cues. It does not quantize the values of spatial cues where the frequency bands can’t easily be perceived by human ears according to the selection model. Experimental results showed that this method can bring down the parametric bitrate by about 15% compared with parametric stereo, while maintaining the subjective sound quality.
Keywords: Interaural Level Difference, just notice difference, spatial cues, perceptual characteristic.
1. Introduction
Spatial audio coding is a method by downmixing stereo to mono and extracting spatial parameters which represent the orientation information of spatial sound field. The most important spatial cues contain: Interaural level difference (ILD), interaural time difference(ITD) and interaural correlation(IC)[1][2].The bitrate of stereo coding can be reduced effectively because the bitrate of spatial parameters is smaller than that of channel signals. With the multichannel audio encoding technology is mature and widely used, the direction of spatial audio coding technology gradually changes from stereo coding to multichannel coding. As the bitrate increases linearly with the increasing number of channels, how to effectively reduce the bitrate of spatial parameters is an important problem in the field of spatial audio coding.
Yang Won Jung in 2006 pointed out that the auditory sensitivity of spatial parameters is associated with the channel configuration, especially ILD. He proposed a quantization method which was used multiple quantization tables corresponding to different channel configuration
instead of existing single quantization table to improve quality and efficiency of quantification [3]. K. Kim in 2007 also pointed out that the quantitation method for spatial cues in MPS[4] lacks of theoretical background and appropriates quantization steps and proposed parameter quantization scheme based on position information of virtual sound source for spatial cues [5]. Because the movement of sound source in spatial sound field is generally slow and the spatial cues of adjacent frames have strong correlation, B. Cheng in 2008 proposed a differential coding scheme for ILD that calculated the difference of spatial parameters corresponding frequency band in adjacent frames and only quantized the difference [6].
These methods can reduce the parametric bitrate, but they did not consider the human ear's perceptual and statistics characteristics in different frequencies. There is still redundancy in spatial parameters.
As there exists certain perceptual thresholds for the perception of sound intensity, the perception of spatial orientation change by human ear is also limited. And human ear can perceive the changes of sound image orientation only when the difference of binaural cue reaches a certain threshold value, and this threshold value is known as Just Noticeable Difference (JND)[7]. The main influence factors of JND are frequency, intensity and intensity difference and so on. Scholars have made various measurement and analysis in allusion to these factors.
that the change of JND is not obvious with the rising of frequency which is different from miller’s conclusions.
In 1969, Hershkowitz[11] researched the influence of sound direction to JND of ILD and found that the JND increases as binaural signal intensity difference increases. It illustrates that the closer is the sound to ear, the more insensitive is human ear to sound location. But the author only measured the signal of 500Hz. In 1988, Yost [9] measured the JND of 5 frequencies and 3 ILD, the results showed that the law of JND for different ILD was basically the same as frequency.
In 2000, Andrew [12] researched the relationship of JND for ILD to signal duration and intensity. He found that JND of ILD decreased with the increasing of signal duration and intensity under constant intensity, but it is very big under crossover frequency and had very less relationship with signal duration and intensity.
In 2008, Chen [13] researched the relationship between sinusoidal tone signal and the JND of binaural clues. There is some great different between her result and abroad scholars, and the reason may be that sound pressure of each frequency was not kept at a constant value, but the sum of signal at each frequency was constant.
This paper is organized as follows: Section 2 researches the perceptual characteristic of spatial cues in different frequency bands. Section 3 analyses the statistics characteristic of spatial cues in different frequency bands. Section 4 proposes the selection model and quantization algorithm. The results from experiments are presented in Section 5. Finally, Section 6 gives some conclusions.
2. Perceptual Characteristics of Spatial Cues
Early perceptual experiments showed that people's perception of spatial orientation is related to the age of listeners, intensity, frequency, listening environment and other factors. As a result, in order to obtain the JND of spatial cues, we need carry out numerous individual experiments and adapt mathematical and statistical analysis. This article take ILD as an example to introduce specific methods, other cues are the same.
2.1 Subjects
There were 24 listeners which are all graduate students in this experiment including 15 male and 9 female, they are all 21-27 years old. These listeners have made many professional training and subject listening test before. In this experiment, every people need to make 32 times
audiometry, there is 12 frequency points every time, each frequency point need 5 minutes. Because signal frequency may lead to weary easily, so each listeners need to have a rest after several frequency points. It cost about 2 hours to finish the whole process every time.
2.2 Stimuli
The method in this article used a two-alternative-forced-choice paradigm to measure the JND. Both reference and test signals were 250 ms in duration including 10 ms raised-cosine onset and offset ramps. They were randomly combined into stimulus and separated by 500 ms duration. The Stimuli were create by personal computer and presented to the subjects over headphones (Sennheiser HDA 215) at a level of 70 dB SPL. In order to exclude other factors influence on this experiment, the environment of the entire testing process should be consistent and the intensity of test sound must remain around 70 dB SPL. Meanwhile the ITD should be zero in the whole experiment in order to remove the effect on the result caused by other binaural cues and the sum of energy of left and right channels should remain unchanged.
The reference values of ILD in this experiments are 0 dB, which respond to the midline in the horizontal plane.
The experiment divided the whole frequency domain into 20 sub-bands, and each frequency sub-band satisfied the same perceptual characteristics of human ear. The frequency sub-bands closely mimic the critical band concept and are formed in such a way that each band has a bandwidth, BW(in Hz), which is approximately equal to the equivalent rectangular bandwidth(ERB), following
BW = 24.7(0.00437f + 1) (1)
with f the(center) frequency given in Hz[14].
The stimuli are pure tones whose frequencies are 75, 150,225,300,450,600,750,900,1200,1500,1800,2100,2400, 2700,3300,4200,5400,6900,10500,15500Hz.
2.3 Method
An adaptive, 1-up-3-down method was also used in this article. The difference of ILD in decibels was increased in every one wrong or decreased in every three consecutive correct. The difference between reference and test signals in first trials was the initial variable which was much larger than target JND value, it was changed by an given step according to previous test result.
The step was changed adaptively, it was adjusted by 50% for the first two reversals, 30% for the next two reversals, then liner changed in a small step size for the next three reversals, last step size was the step of expected accuracy for the last three reversals. In a transformed-up-down experiment, the stimulus variable and its direction of change depends on the subjects responses. The direction
alternates back and forth between “down” and “up”. Every transform between “down” and “up” was defined as a
reversal [15].
Because of heavy workload of these experiments, an adaptive test software was designed to simplify the experiments and the process of data collection and analysis. The software automatically generated test sequences and
played one after another. According to the listener’s choice,
the software changed ILD values of test stimulus properly, and saved the results to excel sheet until listener hardly distinguished the orientation differences between two sequences. And the value of ILD at this time was the JND value.
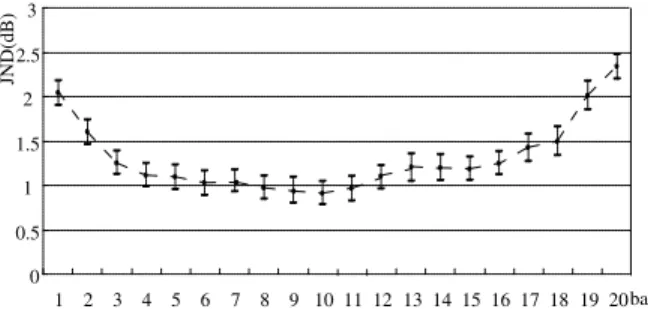
2.4 Results
After a subjective listening test for half a year, we get 120 groups of data, each group containing 24 JNDs corresponding to 24 subjects. For every group, we select the data that has the confidence degree of 75% to be JND in that condition. Table 1 gives the JNDs in all conditions.
0 0.5 1 1.5
2 2.5
3
1 2 3 4 5 6 7 8 9 10 11 12 13 14 15 16 17 18 19 20bark
JND
(d
B)
Fig. 1 JND curve of ILD=0.
3. Statistical Distribution of Spatial Cues
Spatial Audio Coding is expected to use perceptual characteristics of spatial parameters in different frequency bands and accurately extract spatial parameters which represent the orientation information of spatial sound field. The "exact representation" consists of two aspects of meaning: The first is to extract spatial parameters which represent the orientation information of spatial sound field from the audio signal; the second is to remove redundant information of spatial parameters as possible as we can.
We had already given the frequency dependence JND curve of ILD. It is clear that the values of ILD can be perceived by human ear when they are larger than JND in a certain frequency band. However, such information that which frequency bands can be perceived must transfer to
decoder. We can’t achieve the purpose to enhance coding efficiency and reduce the coding bitrate because the extra information need to code. How to remove the redundant information of ILD and improve the coding efficiency is the goal of spatial audio coding.
We researched statistical distribution characteristics of ILD and obtained the probability that the actual values of ILD can be perceived in stereo signal. It can guide the quantization of ILD in spatial audio coding and improve the coding efficiency.
300 sections of typical stereo music were chosen for the statistical experiment in this article, including Chinese folk music, western musical instruments, natural sounds, popular songs and other music accompaniment material. These materials were selected from the program source CD GSBM61001-89 used for the subjective listening evaluation of national standard, commonly used in domestic audio demo track exhibition and so on. These test sequences were divided into 12 categories. For simplicity, the length of test sequences used in this experiment is 20s and the sampling rate is 48 kHz.
(a) time domain (b) frequency domain num
Bark Bark
ILD(dB) ILD(dB)
num
Fig. 2 The statistical distribution of ILD in different domains
parameters extracting has little impact on the distribution characteristics of ILD parameters. The probability of ILD near zero is the highest and it increases with the frequency increases; ILD distribution characteristics under different domains is insignificant, the distribution characteristics of time-domain can be replaced by that of spatial parameters which we expect to get in this experiment.
We had got the ILD statistics distribution of these sequences by Matlab as follows:
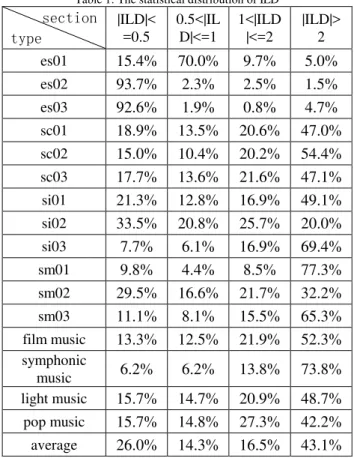
Table 1: The statistical distribution of ILD
section type
|ILD|< =0.5
0.5<|IL D|<=1
1<|ILD |<=2
|ILD|> 2
es01 15.4% 70.0% 9.7% 5.0%
es02 93.7% 2.3% 2.5% 1.5%
es03 92.6% 1.9% 0.8% 4.7%
sc01 18.9% 13.5% 20.6% 47.0%
sc02 15.0% 10.4% 20.2% 54.4%
sc03 17.7% 13.6% 21.6% 47.1%
si01 21.3% 12.8% 16.9% 49.1%
si02 33.5% 20.8% 25.7% 20.0%
si03 7.7% 6.1% 16.9% 69.4%
sm01 9.8% 4.4% 8.5% 77.3%
sm02 29.5% 16.6% 21.7% 32.2%
sm03 11.1% 8.1% 15.5% 65.3%
film music 13.3% 12.5% 21.9% 52.3% symphonic
music 6.2% 6.2% 13.8% 73.8%
light music 15.7% 14.7% 20.9% 48.7% pop music 15.7% 14.8% 27.3% 42.2% average 26.0% 14.3% 16.5% 43.1%
First we get the statistical distribution of ILD in all frequency bands for MPEG sequence and other music.
We can see that more than 40% probability of ILD is less than 1 dB, it was proved by more and more experiments. However, the JNDs of ILD are almost larger than 1 dB, so there is too much redundancy which is hard to be perceived by human ear.
According to the JND value of each band in the perceptual experiments, the statistical distribution characteristics of ILD in each band above the JND in time-domain can be obtained. The distribution figure is as follows:
Fig. 3 The statistical distribution of ILD in different frequency bands.
This paper proposed a method that combined with time-domain distribution characteristics and perceptual characteristics of ILD to guide the selection of ILD and improve the coding efficiency.
4. Selection Model for Spatial Cues
Spatial parameter selection is a process to determine whether the spatial parameters of frequency bands should be encoded. The perceptual and statistical distribution characteristics of ILD that we have studied are the basis of the spatial parameter selection.
From the JND curve of ILD we can find: human ears can't easily be perceived when the values of ILD are smaller than the values of JND at corresponding bands. We need to encode such parameters only when the spatial parameters are greater than the values of JND at the same frequency bands. From the statistical distribution curve of ILD for real stereo signals we can find: we don’t encode the parameters when the values of ILD appear in low probability range in some conditions.
Based on perceptual and statistical characteristics, the selection model of ILD can be got as following steps:
First of all, according to the experiment result of perceptual sensitivity of ILD, we can divide the 20 frequency bands into the following areas: B1-B3 and B18-B20 are very insensitive areas; B4-B12 and B15-B17 are much sensitive areas; B13-B14 is less sensitive areas.
Secondly, according to the statistical distribution of ILD above the JND in each frequency band, 20 frequency bands can be also divided into the following areas: B1-B3 and B18-B20 are very insensitive regions, B4-B12 and B16-B17 are much sensitive areas; B13-B15 is less sensitive areas. We don't considered B9 here alone as a special case.
characteristics are basically the same. In consideration of the two situations, the following ways can be used to extract the parameters:
B2
B1 B18 B20
Normal
Low bitrate
B3 B13
B1 B14 B17 B20
exstraction bands discard bands
B3 B17
B4 B12 B15 B16
Fig. 4 The selection model of ILD.
The method of parameter extracting proposed in this paper can be simply applied in current spatial audio coding. We just need to add an estimate module on the original framework. Only when the frequency band is the one we need to extract according the selection model, the original extraction and quantitative methods will be used to encode. Otherwise, the encoding index will be zero or the index difference between the current band and the previous band will be zero, so we can reduce the coding bitrate while the complexity will not increase. The selection scheme of spatial parameters proposed in this paper is based on the frequency perceptual characteristics of spatial parameters, it can guarantee the loss will not be heard or easily perceived by human ear.
5. Experiment and Result
The selection model of ILD proposed in this article was mainly applied in spatial parameter extraction. This paper adopted the selection strategy in high quality.
5.1. Bitrate
This experiment first calculated the total number of bits used to quantify ILD according to the method that this article proposed, then compared with the PS quantization method and calculated the percentage of bitrate decline. The proposed method was implemented in Enhanced aacPlus[16] standard code, the bitrate is 32 kbps.
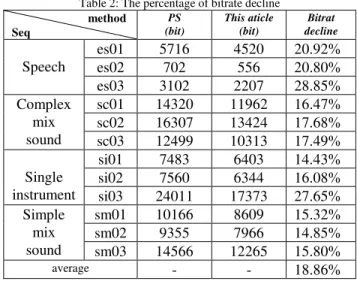
The Table 2 list bitrate decreased for ILD quantization from the MPEG standard test sequences. We can find that the decline percentage of speech is greater than other types. The decline in the percentage of other types is basically the same, which maintain about 15%-18%. The average parameters bit rate has decreased by 18.86%..
Table 2: The percentage of bitrate decline method
Seq
PS (bit)
This aticle (bit)
Bitrat decline
Speech
es01 5716 4520 20.92%
es02 702 556 20.80%
es03 3102 2207 28.85%
Complex mix sound
sc01 14320 11962 16.47%
sc02 16307 13424 17.68%
sc03 12499 10313 17.49%
Single instrument
si01 7483 6403 14.43%
si02 7560 6344 16.08%
si03 24011 17373 27.65% Simple
mix sound
sm01 10166 8609 15.32%
sm02 9355 7966 14.85%
sm03 14566 12265 15.80%
average - - 18.86%
5.2. Quality
The sound quality after decoding was evaluated by subjective test.
Subjective test adopt MUSHRA listening test standards, used the Sennheiser HD215 professional headphone. The subjects were 12 persons aged between 20-30 years in which male to female ratio of 1:1, they all had receive professional training. Figure 5 shows the subjective quality of the quantization methods proposed in this article and PS.
0 20 40 60 80 100
es01
MUS
HRA
Selection scheme PS
es02 es03 si01 si02 si03 sm01 sm02 sm03 sc01 sc02 sc03
Speech Single instrument Simple mix sound Complex mix sound
Fig. 5 Subjective quality of two methods
As is shown above figure, the subjective quality scores of the two methods were maintained in the same interval, rose and declined in the same range and level. Therefore, we can consider that of the two methods were equal.
6. Conclusions
parameters and try to remove it by joint perceptual and statistics characteristic. The new quantization strategy merely quantizes the perceived variable quantity of spatial parameters to reduce the coding bitrate. Experimental results show that this method can bring down the parametric bitrate by about 20% compared with parametric stereo, while maintaining the subjective sound quality.
Acknowledgments
This work was supported by the National Natural Science Foundation of China (Grant No. 61231015,61102127, 61272278, 61201340, 61201169), the major national science and technology special projects (2010ZX03004-003-03), the Doctoral Fund of Ministry of Education of China(Grant No.20090141110054) and the Fundamental Research Funds for the Central Universities.
References
[1] J.W. Strutt. "The theory of sound", Dover Publications, 1877.
[2] F. Baumgarte and C. Faller. "Binaural Cue Coding - Part I: Psychoacoustic fundamentals and design principles", IEEE Trans. on Speech and Audio Proc., 2003,Vol. 11.
[3] J. Herre et al.. "The Reference Model Architecture for MPEG Spatial Audio Coding", in Proc. 118th Audio Eng. Soc. Convention, 2005.
[4] Y.W. Jung, H.O. Oh, H. J. Kim, and S. J. Choi. "New CLD quantization method for spatial audio coding", in Proc. 120th AES Conv., Paris, 2006.
[5] K.Kim, S.Beack, J.Seo, D.Jang, and M.Hahn. "Improved Channel Level Difference Quantization for Spatial Audio Coding", ETRI Journal,2007, Vol.29, pp.99-102.
[6] Cheng, B., C.H. Ritz and I.S. Burnett. "Psychoacoustic-based quantization of spatial audio cues", Electronics Letters, 2008,Vol.44.
[7] Zwislocki, J. and R.S. Feldman. "Just Noticeable Differences in Dichotic Phase", J. Acoust. Soc. Am., 1956,Vol.28(5): p. 860-864.
[8] Mills, A.W., "Lateralization of High-Frequency Tones,"J. Acoust. Soc. Am. ,1960,Vol.32,pp.132-134.
[9] Yost, W. A., and Dye, J. R. H.. "Discrimination of interaural differences of level as a function of frequency", J. Acoust. Soc. Am,1988,Vol.83,pp.1846-1851.
[10] Kaigham J.G, "Frequency dependence of binaural performance in listeners",J. Acoust. Soc. Am.,1992, Vol.91,pp. 336-347.
[11] R.M.Hershkowitz and N.I.Durlach, "Interaural Time and Amplitude jnds for a 500-Hz Tone", J. Acoust. Soc. Am., 1969,Vol.46, pp. 1464-1465.
[12] J Oxenham, A.J. and S. Buus, "Level discrimination of sinusoids as a function of duration and level for fixed-level, roving-level, and across-frequency conditions", J. Acoust. Soc. Am. , 2000,Vol.107, pp. 1605-1614.
[13] Chen Shuixian, Hu Ruimin, "Frequency Dependence of Spatial Cues and Its Implication in Spatial Stereo Coding",in
International Conference on Computer Science and Software Engineering, 2008, pp. 1066-1069.
[14] Glasberg, B.R. and B.C.J. Moore. "Derivation of auditory filter shapes from notched-noise data", Hearing Research, 1990. Vol.47(1-2): p. 103 - 138.
[15] Levitt, H.C.C.H., "Transformed Up-Down Methods in Psychoacoustics.",Acoustical Society of America Journal, 1971. Vol. 49:p p. 467-477.
[16] 3GPP TS 26.405 : Enhanced aacPlus general audio codec; Encoder Specification Parametric Stereo part.
Mr. Heng Wang is a researcher in the field of audio processing and coding, 3D audio Systems. At present he is working in the Department of School of Mathematic & Computer Science, Wuhan Polytechnic University, Wuhan. He has completed a bachelor's degree in Huazhong University of Science and Technology. Now he is pursuing Ph.D in Wuhan university, Wuhan.
Prof. Ruimin Hu is an eminent researcher in the
field of multimedia processing, network communications, security and emergency. At present he is working in the Department of National Engineering Research Center for Multimedia Software, he is the Associate Dean of School of Computer Science, Wuhan University. He has completed Ph.D. in Huazhong University of Science and Technology, Wuhan, China.
Dr. Weiping Tu is a researcher in the field of audio processing and coding and network communications. At present he is working in the Department of National Engineering Research Center for Multimedia Software. He has completed Ph.D. in Wuhan Unversity.