1Institute of Geosciences, Universidade de Brasília – UnB, Brasília (DF), Brazil. E-mails: [email protected], [email protected], [email protected]
2Orinoco do Brasil Mineração Ltda., Goiás (GO), Brazil. E-mails: [email protected], [email protected], [email protected]
*Corresponding author.
Manuscript ID: 20170012. Received in: 01/26/2017. Approved in: 08/29/2017.
ABSTRACT: he Faina Greenstone Belt is located in the southern sector of the Goiás Archean Block and has been investigated since the 18th century because of its gold deposits. Recent studies have
re-vealed the polymetallic potential of the belt, which is indicated by anomalous levels of Ag, Cu, Fe and Co in addition to Mn, Ba, Li, Ni, Cr and Zn. his study was developed based on a detailed analy-sis of two selected target sites, Cascavel and Tinteiro, and multiple data sets, such as airborne geophysics, geochemistry and geological information. hese datasets were used to create a inal prospectivi-ty map using the fuzzy logic technique. he gold mineralization of Cascavel target is inserted in an orogenic system and occurs in two overlapping quartz veins systems, called Mestre-Cascavel and Cuca, embedded in quartzite with an average thickness 50 cm and guidance N45º–60ºW/25ºSW with free coarse gold in grains 2–3 mm to 3 cm. he prospectivity map created for this prospect generated four irst-or-der favorable areas for mineralization and new medium-favorability foci. he Tinteiro area, derived from studies conducted by Orinoco do Brasil Mineração Ltda., shows polymetallic mineralization associated with an iron oxide-copper-gold ore deposit (IOCG) system posterior to Cascavel target mineralization. Its prospectivity map generated 19 new target sites with the potential for Au, Cu and Ag mineralization, suggesting new directions for future prospecting programs.
KEYWORDS: Faina Greenstone Belt; aeromagnetometry;
gam-ma spectrometry; gold mineralization; polymetallic mineralization; fuzzy logic.
RESUMO: O Greenstone Belt Faina está localizado na porção sul do Bloco Arqueano de Goiás e vem sendo pesquisado desde o século XVIII por conta dos seus depósitos auríferos. Estudos recentes revelaram o po-tencial polimetálico do cinturão, em razão dos valores anômalos de Ag, Cu, Fe e Co, além de Mn, Ba, Li, Ni, Cr e Zn. Este estudo foi desen-volvido por meio da caracterização de dois alvos selecionados, Cascavel e Tinteiro, utilizando dados multifonte, tais como aerogeofísica de alta resolução, geoquímica e geologia. Esses dados foram integrados para criar um mapa prospectivo inal utilizando a técnica lógica fuzzy. A mineral-ização aurífera do alvo Cascavel está inserida em um sistema orogênico e ocorre em dois sistemas de veios de quartzo superpostos, denominados de Mestre-Cascavel e Cuca, encaixados em quartzitos e com espessura média de 50 cm e orientação N45º–60ºW/25ºSW com a presença de ouro livre em grãos de 2–3 mm até 3 cm. O mapa prospectivo criado para esse prospecto indicou quatro áreas mineralizadas com favorabilidade de primeira ordem e novos focos com média favorabilidade. O alvo Tinteiro, derivado de estudos realizados pela empresa Orinoco do Brasil Mineração Ltda., mostra uma mineralização polimetálica associada a depósito do tipo óxido de ferro-obre-ouro-(prata), posterior à mineralização do alvo Cascavel. Seu mapa prospectivo apontou 19 novos focos com alta poten-cialidade para mineralização de Au, Cu e Ag, sugerindo novas direções para futuros programas prospectivos.
PALAVRAS-CHAVES: Greenstone Belt Faina; aeromagnetometria; gamaespectometria; mineralização aurífera; mineralização polimetálica; lógica fuzzy.
Prospectivity analysis of gold and
iron oxide copper-gold-(silver)
mineralizations from the Faina Greenstone
Belt, Brazil, using multiple data sets
Análises prospectivas em mineralizações hospedadas em
depósitos orogênico e do tipo óxido de ferro-cobre-ouro-(prata)
no Greenstone Belt Faina, Brasil, utilizando dados multifonte
Daniela Schievano de Campos1*, Adalene Moreira Silva1,
Catarina Laboure Bemica Toledo1, Marcelo Juliano de Carvalho2,
Vinícius Gomes Rodrigues2, Kawinã Araujo2
INTRODUCTION
Globally, mining companies seek to utilize prospective eicient methods that decrease costs during mineral explo-ration stages. To achieve such goals, they must use tech-niques that eiciently aggregate the data generated in the diferent stages of a given study by focusing on models that have a greater likelihood of estimating deposits (Robert
et al. 2007). Magnetic surveys coupled with high-resolution gamma spectrometry data represent available technology in airborne geophysics for the detection of relevant structures for mineral exploration, and they have been shown to be eicient in the selection of follow-up target sites in tropical terranes (Silva et al. 2012, Carrino et al. 2011).
he Faina Greenstone Belt is the target of this study, and, along with the Pilar de Goiás, Guarinos, Crixás and Serra de Santa Rita belts, it is part of the granite-greenstone terranes of the Archean-Paleoproterozoic terrane of Goiás, which is located in the northern sector of the Brasília Belt (Pimentel
et al. 2004, Jost et al. 2005, Jost et al. 2013). his region has been investigated since the time of the Bandeirantes explor-ers (18th and 19th centuries) and shows the potential to host
gold (Au) mineralizations. Several companies have mined in the area, including the well-known Metais de Goiás S.A. (METAGO), Western Mining Co., Amazônia Mineração and Troy Resources Brazil.
he discovery of Sertão, a low-tonnage and high-grade gold mine, had a positive impact on the local economy and on the cities of Faina and Goiás. he mine was explored in the period from 2000 to 2007 by Sertão Mineração Ltda., which ceased its activities after exploiting the oxidized ore to a depth of 40 m. he company reported the extraction more than 250,000 ounces of gold, at an average recovered grade of 24.95 g/t Au. Since 2011, the area has been studied by Yamana Gold Inc. and Orinoco do Brasil Mineração Ltda. Orinoco do Brasil Mineração Ltda. is particularly rel-evant because of its investments in the Faina Greenstone Belt, including an innovative exploration program for known target sites, such as Cascavel, and the discovery of the new target sites of Tinteiro and Eliseu. he new target sites indicate a potential for gold and polymetallic mineral-izations in the region. Additionally, the company resumed and intensiied their studies in the Mina de Sertão site, and they plan to reopen it as an underground mine (http://ori-nocogold.com/).
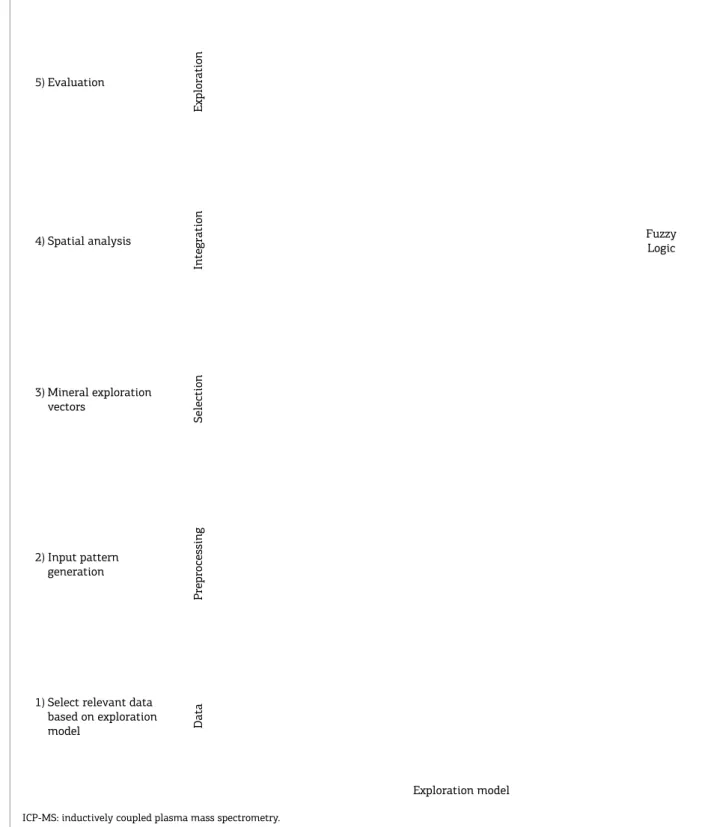
This study focuses on detailing two selected target mineralization sites (Cascavel and Tinteiro) of the Faina Greenstone Belt using a methodology based on the process-ing and interpretation of aeromagnetic, gamma spectrom-etry and geochemical data. he data were then integrated into mineral favorability models using fuzzy logic, and the
methodological steps were derived from the exploration program proposed by Pan and Harris (2000), Harris and Sanborn-Barrie (2006) and modiied from Nykänen (2008) and Silva et al. (2012) (Fig. 1).
GEOLOGIC CONTEXT AND
MINERALIZATION IN THE FAINA
GREENSTONE BELT
Regional Geology
The study area is located within the Archean-Paleoproterozoic Terrane of Goiás in the Brasília fold belt within Tocantins Province (Pimentel et al. 2000, Queiroz et al.
2008, Jost et al. 2013) (Fig. 2). he Archean-Paleoproterozoic
Terrane of Goiás extends over approximately 50,000 km2,
and 30% of it consists of volcano-sedimentary sequences of the greenstone belt type and 70% comprises granite-gneiss rocks, thus forming a typical granite-greenstone terrane (Fig. 2) (Almeida et al. 1977, Danni et al. 1981, Jost & Oliveira 1991, Kuyumjian & Jost 2006). he greenstone belts occur in ive narrow belts, three of which (Crixás, Guarinos and Pilar de Goiás) are located in the northern end, and two of them (Serra de Santa Rita and Faina) are located in the southern end. hese belts host important gold deposits and are preserved in elongated synforms isolated by the Archean granite-gneiss complexes Hidrolina, Moquém,
Caiamar, Anta, Caiçara and Uvá (Pimentel et al. 2000, Jost
& Fortes 2001) (Fig. 2).
he greenstone belts Serra de Santa Rita and Faina are located in the southern part of the granite-greenstone ter-rane, and they are structured in a syncline that is NW-SE aligned, 150-km long and 6 km wide (Kuyumjian & Jost
2006, Baêta et al. 1998). hese belts are separated by the
strike-slip Faina Fault, which strikes to N30E (Resende
et al. 1998), and they are located between two granite-gneiss complexes with distinct geologic evolution. he Caiçara Complex to the north consists of 3.1 Ga old tonalitic gneisses and intrusive granodiorites, monzogranites and charnockite series, with ages between 2838 and 2818 Ma (Beghelli Jr. 2012). he Uvá Complex to the south con-sists of tonalitic gneisses and polydeformed granodiorites and dioritic rocks with crystallization ages from 3040 to 2930 Ma and granitic tabular bodies dating between 2876
and 2846 Ma (Jost et al. 2013). he contacts between the
granite-gneiss complexes and supracrustal rocks are intru-sive or tectonic and marked by inverse shear zones with high angles converging to the northeast that completely obliterate the original architecture of these belts (Resende
Faina and Serra de
Santa Rita Greenstone Belts
he lower stratigraphic sections of the Faina and Serra de Santa Rita greenstone belts are similar, and from the base to the top, they include metakomatiites (Manoel Leocádio
Formation) and metabasalts (Digo-Digo Formation). In the Serra de Santa Rita Belt, the Digo-Digo Formation consists of metabasalts and felsic metapyroclastic rocks, which are absent in the Faina Greenstone Belt. his basal unit is over-lapped in both belts by distinct metasedimentary sequences,
Figure 1. The main steps of the mineral exploration model. This diagram is based in the method suggested by Pan and Harris (2000) and Harris and Sanborn-Barrie (2006) and adapted from Nykänen (2008) and Silva et al. (2012).
ICP-MS: inductively coupled plasma mass spectrometry.
Exploration
Integration
Selection
Preprocessing
Data
5) Evaluation
4) Spatial analysis
3) Mineral exploration vectors
2) Input pattern generation
1) Select relevant data based on exploration model
Exploration model
Figure 2. Simpliied geologic map of the Archean-Paleoproterozoic Terrane in Goiás (Pimentel et al. 2000).
Meso-neoproterozoic terranes
Greenstone Belts 1) Crixás 2) Guarinos 3) Pilar de Goiás 4) Faina
5) Serra de Santa Rita Legend Caiamar Complex
Hidrolina Complex Moquém
Complex
Anta Complex
Caiçara Complex
Goiás
DF
N
0 40 80 km
Scale Uvá
Complex
1
4
5
3
2 Tocantins
Province Brazil
Transbrasilian Lineament
Moiporá-No
vo Brasil Shear Zone
Archean-Paleoproterozoic Terrane
Atlantic Ocean
indicating diferent paleogeographic environments and dep-ositional regimes in the basin (Resente et al. 1998) (Fig. 3). In the Faina Greenstone Belt, the metasedimentary unit is represented by the Furna Rica Group, which is formed from the base to the top by records of two transgressive shelf
sed-imentary cycles (Resende et al. 1998). he irst cycle begins
with metaconglomerate lenses along with orthoquartzites, metapelites, carbonaceous schists and banded iron-forma-tions (BIFs) from the Fazenda Tanque Formation laying on an angular unconformity over the underlying metavolcanic unit. he second cycle is represented by metaconglomerates, orthoquartzites and metapelites of the Serra de São José Formation covered by marbles and the iron formations of the Serra do Tatu Formation. he two sedimentary cycles are separated by an erosional unconformity indicated in Figure 3
as the metasedimentary Units A and B (Toledo et al. 2014).
he metasedimentary record of the Serra de Santa Rita Greenstone Belt is represented by the Fazenda Paraíso Group, which was formed at the base by carbon schists, metachert, iron formations, calc-schists and marbles.
he top of the sequence is covered by metagreywackes from the Fazenda Cruzeiro Formation, and its sedimentation occurred in a deep marine environment and progressed to a shallower environment. In the Faina belt, shelf sedimen-tation occurred in two transgressive cycles of increasing
depth (Resende et al. 1998). Geochemical data from the
detrital rocks along the stratigraphic sections show that the
Sm/ Nd (TDM) model ages of the source area decreased from
3.1 to 2.8 Ga. Additionally, the sediments originated from maic/ultramaic sources in the initial stages of deposition, with an increase of felsic components towards the top of
the sequence (Resende et al. 1999).
Mineralization
Figure 3. Simpliied regional geologic map of the FainaGreenstone Belt produced by Toledo et al. (2014). The black polygon indicates the study area mapped at the 1:10,000 scale.
540,000
8,268,000
8,272,000
8,276,000
8,280,000
8,284,000
8,288,000
8,292,000
8,296,000
8,300,000
8,304,000
8,268,000
8,272,000
8,276,000
8,280,000
8,284,000
8,288,000
8,292,000
8,296,000
8,300,000
8,304,000
544,000 548,000 552,000 556,000 560,000 564,000 568000 572,000 576,000 580,000 584,000 588,000
540,000 544,000 548,000 552,000 556,000 560,000 564,000 568000 572,000 576,000 580,000 584,000 588,000 GEOLOGIC MAP
UnB TF - 2014 FAINA - GOIÁS PROJECT
50 25 0 50 km
ARCHEAN
Metavolcanic sequence Manoel Leocádio Formation NEOPROTEROZOIC
Late-brasilian Magmatism
Serra de São José Formation
Psamopelitic unit: muscovite chlorite quartz schist, muscovite quartz schist, carbonaceous phylite with paraconglomerate (c) and quartzite lens, feldspatic quartzite and muscovite quartzite (q) PALEOPROTEROZOIC
Metasedimentary sequence B – Cycle 2 Serra do Tatu Formation
Granites and tonalite
Pelitic unit: biotite schist
Chemical unit: ferruginous quartzite Chemical unit: banded iron formation (BIF) Chemical unit: dolomitic marble metachert
Chemical unit: banded iron formation (BIF) Chemical unit: metachert
Psamitic unit: quartzite, feldspatic quartzite, chlorite quartzite with chloritoidite lens
Ultramafic stocks: metaultramafic metamorphosed at greenschist and amphibolite Mafic/ultramafic dikes: amphibolites, metaultramafic and metamarfic
Metasedimentary sequence A – Cycle 1 Fazenda Tanque Formation
Psamopelitic unit: muscovite chlorite quartz schist, muscovite quartz schist, carbonaceous phylite with paraconglomerate (c) and quartzite lens, feldspatic quartzite and muscovite quartzite (q)
Dikes and stocks
Ultramafic unit: chlorite talc schist, chlorite talc tremollite schist, talc
schist ± magnetite, dolomite talc schist, serpentinite with carbonates
porphyroblasts, chloritite with metasedimentary rocks lens and metamafic
Uvá Complet: biotite metatonalite, tonalitic gneiss, biotite muscovite granite, metagranodiorite and metamonzogranite
Caiçara Complex: tonalite, biotite tonalitic gneiss, metatonalite ± biotite, monzogranite
Gneissic Granite Complex
Dirt road Track Farm Stream Lake
Syncline fold with dip indication Shear zone
Syncline fold Geological contact
Infered geological contact Anticline fold
thrust faults and embedded in chlorite-quartz-schists of the second sedimentary cycle (Sertão) and feldspathic quartz-ites of the irst sedimentary cycle (Cascavel). According to the data provided by Orinoco do Brasil Mineração Ltda.,
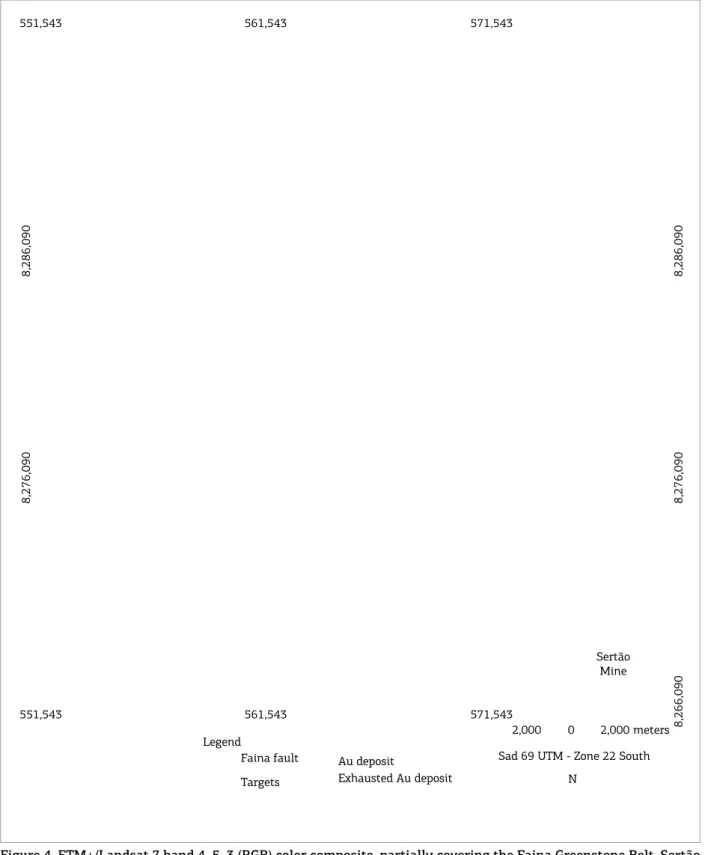
mineralized quartz veins extend along the direction and dip of the shear zone and appear to occur in structures of the second and third order as well. he locations of the Sertão mine and other study sites are indicated in Figure 4.
Figure 4. ETM+/Landsat 7 band 4, 5, 3 (RGB) color composite, partially covering the Faina Greenstone Belt. Sertão Mine and Cascavel, North, Central, South and Southeast Tinteiro prospects are indicated by yellow polygons.
551,543 561,543 571,543
551,543
8,276,090
8,286,090
8,276,090
8,266,090
8,286,090
561,543 571,543
Sertão Mine
Faina fault
Targets
Au deposit
Exhausted Au deposit N
2,000 0 2,000 meters
he gold mineralizations inserted in the Cascavel pros-pect are characterized by the presence of coarse free gold
with grain sizes varying from 2–3 mm to 3 cm (Jost et al.
2014), and they are found in association with quartz veins with thicknesses of 1 cm and a pinkish coloration arranged in continuity with the tectonic foliation of the host rocks. he quartz veins are associated with shear zones that inter-cept the feldspathic quartzites occurring at the base of the first sedimentary cycle (metasedimentary sequence A). Lenses and dolomite layers hosting mineralizations rich in Cu, Ag and W also occur at this site.
he Tinteiro prospect is subdivided into subareas south, central, north and southeast Tinteiro (Fig. 4). It represents a recent discovery by Orinoco do Brasil Mineração Ltda., is located in the metasedimentary sequence of the irst depo-sitional cycle, and it alternates with quartzites, metapelites and metacherts. he analysis of the rock outcrops, hand samples and core samples suggests a diferent context from that of the previous sites. Hydrothermal alteration is rep-resented by sericitic halos with chloritoid, and hematite breccias associated with metacherts. he main control of the hydrothermal alteration comprises faults in NE, NW and E-W directions that intersect the rocks in the Faina Greenstone Belt. he hydrothermal alteration zones are related to the polymetallic mineralization of gold and copper in high concentrations as well as that of cobalt, barium, silver, uranium and iron. According to studies undertaken by Orinoco do Brasil Mineração Ltda., the accumulation of these metals occurred after the orogenic gold mineralization in an iron oxide copper gold ore deposit (IOCG) system.
MULTIPLE DATA SETS
he Faina Greenstone Belt was covered by aeromagnetic and high-resolution gamma spectrometry surveys
cover-ing a total area of 1,562.38 km2 and with a light altitude
50 m above the terrain and light lines spaced 200 m apart in a N-S direction and control lines spaced 1,000 m apart in an E-W direction. A detailed area was covered by light and control lines spaced 100 and 500 m apart, respectively, over the Cascavel and Tinteiro sites. he aeromagnetic and gamma spectrometry data grids were created using the soft-ware Oasis Montaj (Geosoft Inc.). he gamma spectrom-etry data were interpolated using a bi-directional method with the grid cell size set to 25% of the distance between light lines.
Images from the Landsat 7 Enhanced hematic Mapper Plus (ETM+) sensor was used to interpret the main geolog-ical features using the bands 4, 5, 7 RGB color composite,
fused with the band 8 through a principal component algo-rithm. he image from path/row 223/071 was made avail-able by Orinoco do Brasil Mineração Ltda.
In this study, a geologic map that covers the Faina Greenstone Belt and part of the Serra de Santa Rita Greenstone Belt at a 1:25,000 scale was used (Toledo
et al. 2014) along with geologic data obtained from two field trips. The geologic mapping was performed at a 1:10,000 scale for the Cascavel and Tinteiro target sites. For the inal integration of the results, geologic data pro-vided by Orinoco do Brasil Mineração Ltda. were inte-grated. he geologic maps were created using ArcMap software (version 9.3) (ESRI).
To characterize the mineralogical and chemical behavior of the mineralized zones of the region, 7 of the 50 bore holes that intercepted the mineralized bodies of the Cascavel and Tinteiro target sites, which were made available by Orinoco
do Brasil Mineração Ltda., were selected.
Petrographic studies of the transmitted and relected light were undertaken using 70 thin polished sections and an Olympus BX60FS microscope (Olympus Optical Co. Ltd.), which was made available by the Laboratory of Microscopy of the University of Brasília (UnB). hese analyses aimed to identify and characterize the hydrothermal alterations and mineralization zones.
Chemical mineral analyses were conducted in the Electronic Microprobe Laboratory of the Institute of Geosciences (UnB) using the superprobe model JEOL JXA-8230. he voltages used were 15 and 20 kV. Speciic minerals were analyzed when required to assist in the petro-graphic descriptions and in the mineralogical characteriza-tions of the hydrothermal alteration zones.
Geochemical data comprise major, minor and trace elements of the mineralized zones and its surroundings. hese data were collected in samples obtained from boreholes, rocks and soil provided by the companies Troy Exploração Mineral Ltda. and Orinoco do Brasil Mineração Ltda. he analyses included a screen ire assay and inductively coupled plasma mass spectrometry (ICP-MS), which were conducted by the laboratories ALS Minerals, Intertek, SGS Minerals Services and ACME Analytical Laboratories Ltd. he chemical elements included in this study were those that exhibited anomalous concentrations in certain boreholes and ield samples and included Au, Cu, Ag, Ni, Fe, Co and Ba, as well as certain pathinder elements. he anomalous elements were selected for identifying anomalous zones and determine the correlation between these elements and the previously mapped geological-structural features.
DATA PROCESSING AND
INTERPRETATION
Geophysical Data
he high-resolution airborne geophysical data partially covering the Faina Greenstone Belt were processed following pre-processing and processing methods (interpolation and microleveling). After the grid interpolation of the anomalous magnetic ield, the K (%), eh (ppm), eU (ppm) channels, other products were generated and transformed from the data obtained at the 200 m intervals. Similarly, data obtained at the 100 m intervals were used to map hydrothermal halos and structures related to the Cascavel and north, south, cen-tral and southeast Tinteiro target sites (Fig. 4).
Aeromagnetic Data
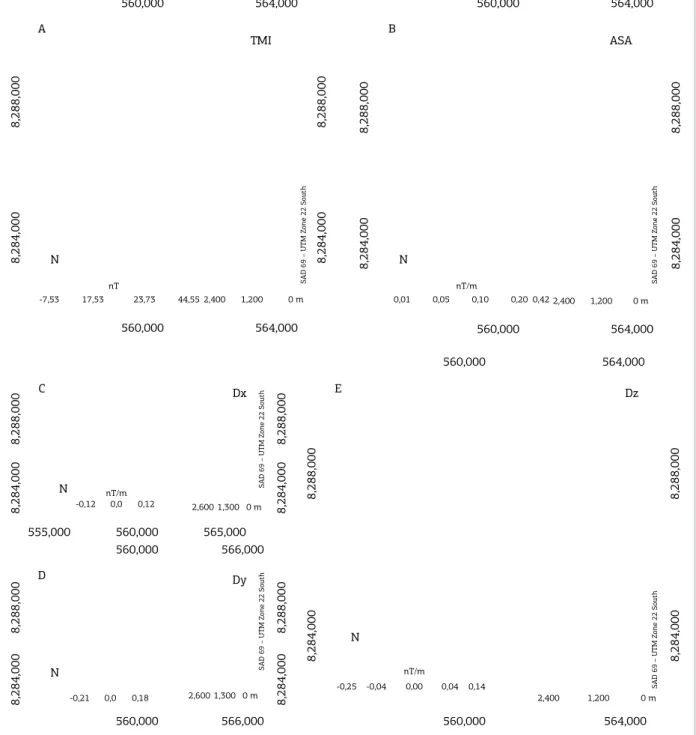
hese data were processed using eicient techniques to determine the geometric parameters and identify the geological and structural limits, geologic feature depths and structural measurements, such as the amplitude and inclination of the analytic signal, vertical and horizontal derivatives (X and Y), and amplitude of the total hori-zontal gradient. hese products were used to map shear zones known to host gold and polymetallic mineraliza-tions as well as their extensions in the sub-surface and across lattened areas that may have the potential to host Au or Cu-Au-(Ag). Figures 5A-5E illustrates the processes involved in the production of the following products for the Faina Greenstone Belt and the target sites: total mag-netic intensity reduced from International Geomagmag-netic Reference Field (IGRF) (TMI), vertical derivative (Dz), horizontal derivative in X (Dx), horizontal derivative in Y (Dy) and analytic signal amplitude (ASA).
Gamma Spectrometry Data
he gamma ray aerial survey shows the geochemical vari-ations of potassium, uranium and thorium up to a depth of 30 cm from the Earth’s surface, and the main variations of these three radioelements translate into signatures that can be used to identify each type of rock (Dickson & Scott 1997). his geophysical method is a useful tool for geolog-ical mapping, and identiication of hydrothermal alteration areas in diferent geological environments.
he processing of gamma spectrometry data was used to produce images of the K (%), eU (ppm) and eh (ppm) channels, and a composite ternary RGB radiometric image (Figs. 6A-6D).
Additionally, image of the Fk factor, known as parameter F, was obtained, and it indicates the enrichment of potas-sium relative to thorium as well as hydrothermal alteration
zones associated with mineralization (Gnojek & Prichystal 1985). Fk is calculated as follows: Fk = K*eU/eh.
Interpretation of Aeromagnetic Data
he analysis of the anomalous magnetic ield was per-formed using linear transformations, such as the horizontal derivatives in x and y (Dx, Dy) and the vertical derivative (Dz), to generate the image of the analytic signal amplitude(ASA) (Roest et al. 1992). he ASA was used to identify a
number of the main magnetic bodies in the area and was of great importance to this study because certain hydrother-mal alterations in the Tinteiro site and along the greenstone are associated with magnetite, which was conirmed in the geologic mapping. hese results indicate that magnetic bodies are identiied as quartzite and metachert layers with hydrothermal alterations that consist of massive iron oxide.
he identiication and characterization of the magnetic structures were obtained by interpreting the vertical deriv-ative Dz (Fig. 5E) (Evjen 1936) and complemented with the analysis of the horizontal derivatives in X and Y. It is noteworthy that the lineament term used here represents a straight or curved surface feature capable of being mapped, and it may be related to faults, fractures of other structures (Sabins 1996). his concept was extrapolated to the analy-sis of magnetic data, in which the lineaments are preferably mapped as magnetic highs. he identiication of structures in magnetic valleys was incorporated in the interpretation to complement the structural framework. he methodology to identify the structural lineaments and the known struc-tural groups are described next.
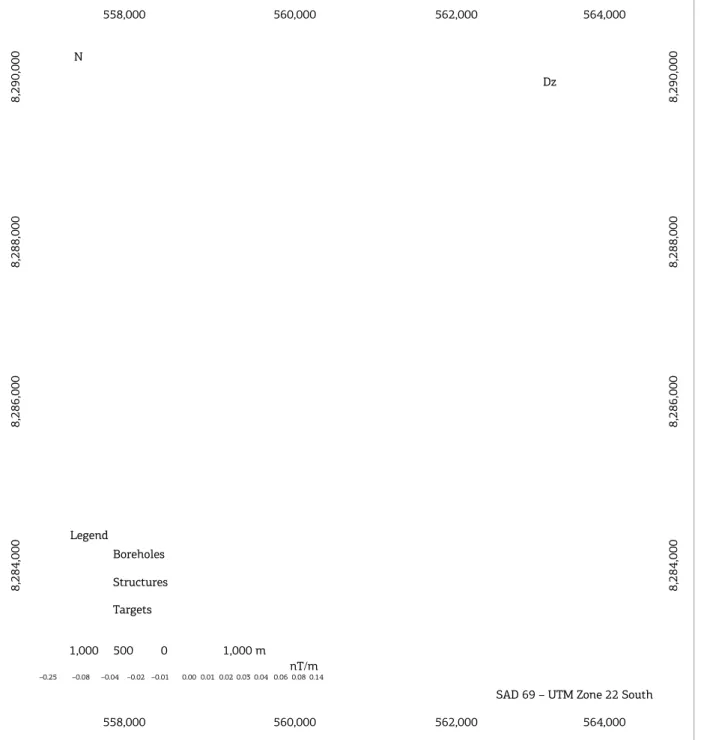
From the vertical derivative (Dz), the main lineaments mapped in the Faina Greenstone Belt were identiied using the horizontal derivatives in x and y and the RGB (453) image of the Landsat 7 ETM+ sensor. hus, the structural measurements obtained in the ield conirmed that the main lineaments are aligned NW-SE, NE-SW and E-W (Fig. 7).
Interpretation of
Gamma Spectrometry Data
he mineralizations hosted in the Faina Belt are associ-ated with hydrothermal processes, such as potassiication, sericitization, chloritization, siliciication, carbonatation and sulphitation. he occurrence of minerals generated by potassic alterations, such as sericite, biotite and potassium feldspar, warrants the use of gamma spectrometry as a key tool in this study.
Figure 5. Main aeromagnetic products: (A) TMI; (B) ASA; (C) Dx; (D) Dy; and (E) Dz. The black outline indicates the main sites analyzed in this study: A – Cascavel, B – North Tinteiro, C – Central Tinteiro, D – Southeast Tinteiro and E – South Tinteiro.
Within the metasedimentary sequence, a domain with low levels of K (%), eh and eU is observed, and it was formed by dolomites and quartzites rich in massive iron oxide.
Certain domains identiied in the map were easily cor-related with the lithology observed in the ield. However, in certain areas, this correlation was not efective and required additional attention and caution in the data interpretation.
Geologic Data
Geologic mapping at the scale 1:10,000 (Fig. 8) was con-ducted for the Cascavel and Tinteiro target sites. he data show that they are hosted in rocks belonging to the irst
dep-ositional cycle proposed by Resende et al. (1998).
he geo-logic units in these areas are ultramaic schists of the volca-nic sequence and rocks of the metasedimentary sequence A
560,000
8,288,000
8,284,000
8,284,000
8,288,000
8,284,000
8,288,000
8,284,000
8,288,000
8,288,000
8,284,000
8,288,000
8,284,000
8,288,000
8,284,000
8,288,000
8,284,000
8,288,000
8,284,000
8,288,000
8,284,000
564,000 560,000 564,000
560,000
560,000
564,000
564,000
560,000 555,000 560,000
560,000 566,000
560,000 566,000 565,000
564,000
560,000 564,000
A
C
N nT/m
N N
N
N D
E
B TMI
Dx Dz
Dy
ASA
-0,12 0,0 0,12
-0,21
-0,25 -0,04 0,00 0,04 0,14
2,400 1,200 0 m 0,0 0,18
2,600 1,300 0 m
2,600 1,300 0 m -7,53 17,53
nT
23,73 44,55 0,01 0,05
nT/m
0,10 0,20 0,42
2,400 1,200 0 m 2,400 1,200 0 m
SAD 69 – UTM Zone 22 South SAD 69 – UTM Zone 22 South
SAD 69 – UTM Zone 22 South
SAD 69 – UTM Zone 22 South
SAD 69 – UTM Zone 22 South
Figure 6. (A) K (%); (B) eU (ppm); (C) eTh (ppm) concentrations used to identify the hydrothermal alteration zones;
and (D) RGB image, which is essential for the geologic mapping and the black outlines indicate the target sites
(A – Cascavel, B – North Tinteiro, C – Central Tinteiro, D – Southeast Tinteiro and E – South Tinteiro).
556,000
8,284,000
8,288,000
8,284,000
8,288,000
8,284,000
8,288,000
8,284,000
8,288,000
8,284,000
8,288,000
8,284,000
8,288,000
8,284,000
8,288,000
8,284,000
8,288,000
560,000 564,000
556,000 560,000 564,000
556,000 560,000 564,000
556,000 560,000 564,000
556,000 560,000 564,000
556,000 560,000 564,000
556,000 560,000 564,000
556,000 560,000 564,000
A B
C D
K (%) U (ppm)
Th (ppm) RGB
N N
2,900 1,450 0 m 3,000 1,500 0 m
3,000 1,500 0 m 2,900 1.450 0 m
K
eTh eU N
N
SAD 69 – UTM Zone 22 South
SAD 69 – UTM Zone 22 South
SAD 69 – UTM Zone 22 South
SAD 69 – UTM Zone 22 South
3.65 1.12
0.86
0.74
0.65
0.59
0.53
0.48
0.43
0.38
0.33
0.27
0.22
0.16 –0.01 min
max
%
12.21 6.61
4.95
4.30
3.85
3.50
3.19
2.92
2.67
2.40
2.10
1.75
1.35
0.76 –1.51 min
max
ppm
4.63 1.73
1.23
1.00
0.85
0.75
0.66
0.58
0.51
0.44
0.37
0.28
0.18
0.02 –0.85 min
max
ppm (Toledo et al. 2014). he volcanic sequence is characterized by
a small talc-schist lens within a package of metacherts in the southeastern sector of the North Tinteiro site. he metased-imentary sequence A is represented in the area by quartz-ites, feldspathic quartzquartz-ites, metapelquartz-ites, metarhythmquartz-ites, metacherts, dolomitic marbles and carbonaceous schists.
Geochemical Data
he geochemical data obtained from the rock samples were used to create geochemical maps for each element that indicated their distribution at the site and their correlation with other elements. Some associations between elements were corrobo-rated during the geochemical analysis of the borehole cores.
Soil samples were analyzed only for gold; therefore, it was diicult to use these data to create element maps. However, the geochemistry of the soil was useful in the validation of zones with high mineral favorability obtained according to the diferent prospecting scenarios.
POLYMETALLIC AND GOLD
MINERALIZATIONS IN THE
FAINA GREENSTONE BELT
Cascavel Target
Lithological and Structural Controls
Figure 7. Map showing the irst vertical derivative (Dz) of the TMI in the study area and identifying the main geologic structures interpreted based on the Dz, Dy, and RGB 453 image of the Landsat 7 ETM+ sensor. The
boreholes conducted by the Orinoco do Brasil Mineração Ltda. are indicated by the green marker.
558,000
8,284,000
8,286,000
8,288,000
8,290,000
8,284,000
8,286,000
8,288,000
8,290,000
562,000
560,000 564,000
558,000 560,000 562,000 564,000
SAD 69 – UTM Zone 22 South Dz
N
Legend
Boreholes
Structures
Targets
1,000
–0.25 –0.08 –0.04 –0.02 –0.01 0.000.01 0.02 0.03 0.04 0.06 0.08 0.14
0
500 1,000 m
nT/m
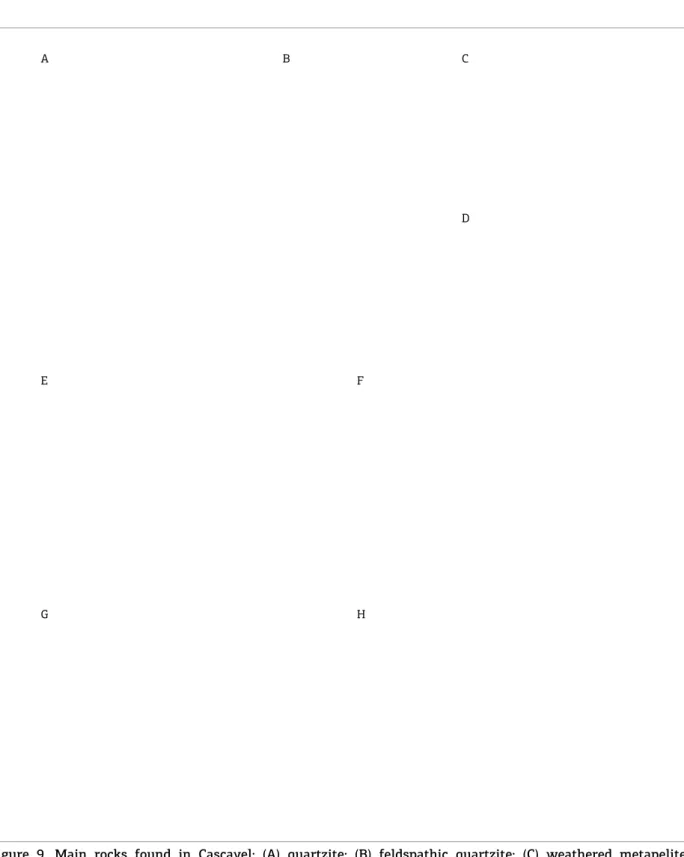
he pure quartzite (Fig. 9A) is yellowish to pink, ine-grained and highly foliated, sometimes weathered, and it presents a granoblastic texture of and a modal composi-tion of quartz (60–80%) and muscovite (20–30%) as the major minerals. Tourmaline and magnetite (locally) appear as accessory minerals. his rock may show crystals or car-bonate pockets consistent with the main foliation, and the quartz is generally recrystallized.
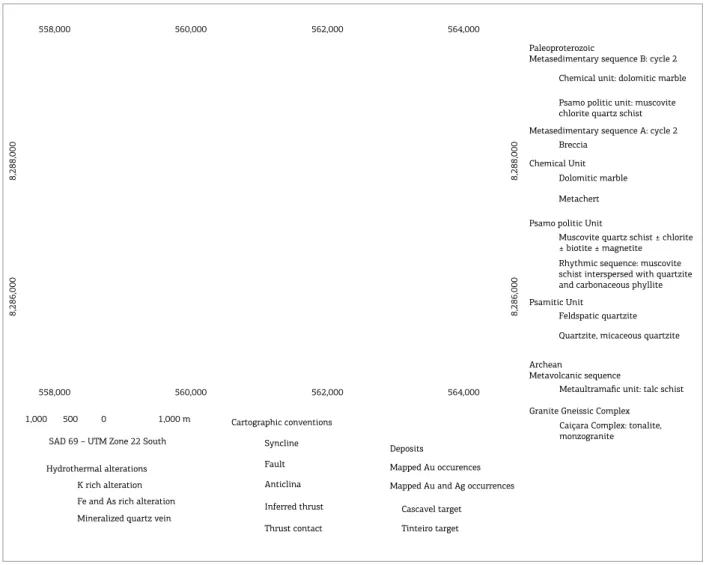
Figure 8. Geologic map of the study area at the 1:10,000 scale covering the Cascavel and Tinteiro target sites; the map was produced by integrating the geologic map created by Toledo et al. (2014) at the 1:25,000 scale, the geologic map from Orinoco do Brasil Mineração Ltda. and data obtained in this study. Boundaries of the hydrothermal alteration halos are also indicated.
558,000
8,288,000
8,286,000
8,288,000
8,286,000
560,000 562,000 564,000
558,000 560,000 562,000 564,000
Hydrothermal alterations K rich alteration Fe and As rich alteration Mineralized quartz vein
Cartographic conventions
Syncline
Fault Anticlina
Inferred thrust
Thrust contact Tinteiro target Deposits
Mapped Au occurences Mapped Au and Ag occurrences
Cascavel target SAD 69 – UTM Zone 22 South
1,000 500 0 1,000 m
Paleoproterozoic
Metasedimentary sequence B: cycle 2 Chemical unit: dolomitic marble
Psamo politic unit: muscovite chlorite quartz schist Metasedimentary sequence A: cycle 2
Breccia
Dolomitic marble
Metachert
Feldspatic quartzite Quartzite, micaceous quartzite Muscovite quartz schist ± chlorite ± biotite ± magnetite
Rhythmic sequence: muscovite schist interspersed with quartzite and carbonaceous phyllite Chemical Unit
Psamo politic Unit
Psamitic Unit
Archean
Metavolcanic sequence
Metaultramafic unit: talc schist
Caiçara Complex: tonalite, monzogranite Granite Gneissic Complex
he quartzite with green muscovite is generally found associated with shear zones and it is considered a hydrother-mal halo external to the mineralization. In this site, the gold mineralization is hosted in milky to pinkish quartz veins, which are consistent with foliation, at a varying thickness from 10 to 30 cm and embedded in the quartzite packages. Green muscovite, siderite and biotite are found bordering these veins.
he metapelites comprise schists of distinct compositions. Generally, they are muscovite schists with varying quantities of quartz, biotite and chlorite (Fig. 9C). In the microscopic anal-ysis, the rock shows a lepidoblastic texture and the following modal composition: muscovite (20–70%), quartz (15–40%), chlorite (5–35%) and biotite (5–40%). he accessory min-erals are tourmaline, magnetite and rutile. he petrographic thin sections show carbonate, epidote and amphibole, which
were used to classify some samples as metamarls. In certain outcrops, these rocks are very rich in quartz, possibly repre-senting sheared and/or hydrothermal quartzites.
hin lenses of carbonaceous schist 10 to 30 cm thick occur interspersed in metarhythmite outcrops characterized by the alternation of metapelite and quartzite packages (Fig. 9D).
A dolomitic marble lens with thicknesses ranging from 10 to 70 m occurs interspersed in the feldspathic quartz-ite packages or at its contact with pure quartzquartz-ite. he lens appears very friable in the cores, which may explain why it was not observed in the outcrops during ieldwork.
he main foliation (Sn) in the study area has an average
Figure 9. Main rocks found in Cascavel: (A) quartzite; (B) feldspathic quartzite; (C) weathered metapelite; (D) intercalated carbonaceous schists in metarhythmite packages. Photos of the Cascavel site gallery: (E) ine pinkish quartz vein (marked in yellow) from 10 to 50 cm thick and hosted in quartzite with green muscovite; (F), (G) and (H) spots of free gold in the quartz vein or at the contact of the vein with the host rock. Photos e, f, g and h:
Orinoco do Brasil Mineração Ltda.
A B C
D
E F
G H
lineations that have an average attitude of S80ºW/20º and
formed by an intersection of two foliations (Sn and Sn+1)
that form the shear zone (S-C foliation). In the Cascavel
Hydrothermal Alteration Zones
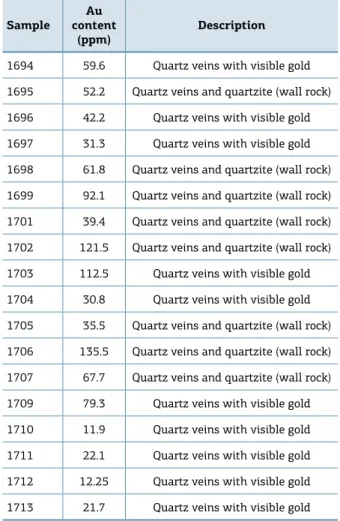
Rock samples randomly collected along this target site were analyzed using ICP-MS. In the gallery of the Cascavel prospect, 18 anomalous samples were obtained, and they had Au concentrations varying from 11.9 to 135.5 ppm (Tab. 1). he Cascavel gallery is located in the northeast sector of the Cascavel site over a high potassium anomaly indicated in the gamma spectrometric maps, and the Cuca gallery is located to the north. he anomalous samples for gold are related to a milky to pinkish quartz vein that sometimes has visible spots of free gold (Fig. 9F-9H). he host rock of the vein is a feld-spathic quartzite with green muscovite and siderite (Fig. 9E).
At this site, 44 borehole cores were obtained, and 31 of them intercepted anomalous gold levels. In addition to gold, several boreholes showed anomalous results for Ag, Pb, W, Zn and Cu in friable dolomitic marble layers that were not associated with the gold-quartz vein.
he CDP-04 and CDP-09 boreholes have been described and sampled. CDP-04 intercepted 193.69 g/t Au across 0.66 m (from 152.10 to 152.76 m depth). Other depths with anomalous gold concentrations were observed along
the borehole (from 113 to 114 m, 158.1 to 160 m, 233 to 233.66 m), and anomalous concentrations of Ag, Zn, Pb and W were also observed, such as at 186.41 to 193.8 m and from 217.47 to 221.79 m (Fig. 10A). he borehole CDP-09 crossed several depths with anomalous gold con-centrations (from 95 to 97 m, and from 221 to 224 m) and also had sequences with anomalous concentrations of Ag, Zn and W (from 135 to 139.13 m, and from 295 to 296 m) (Fig. 10B). In both boreholes, the gold mineralized layers are associated with quartzite packages or near their contact with metapelites. he other anomalous elements (Ag, Zn, Pb and W) are associated with the friable dolomitic marble layers. he hydrothermal alteration halos were classiied into three zones: mineralized zone, proximal zone and distal zone, with the latter subdivided into distal 1 and distal 2.
he mineralized zone contains the inner halo of the hydro-thermal alteration, which has thicknesses varying from a few centimeters to approximately 4 m, which was also observed in borehole CDP-04 (151.00 to 154.41 m). he mineral assemblage is composed of quartz, green muscovite, siderite and free gold, indicating a siliciication and potassic alter-ation. his zone is hosted mainly within feldspathic quartz-ites or in metapelite layers near the contact with quartzite. he muscovite found in this area is formed from biotite.
he proximal zone is characterized by green muscovite and sometimes magnetite/hematite, and it shows potassic alteration. he thickness is highly variable and uncertain. However, ield data suggest that it may be approximately 150 m. his zone is primarily hosted in quartzite packages, but also occurs in metapelites.
he distal zone is hosted mainly within metapelites, form-ing biotite-chlorite schists. he distal zone 1 is formed by altered biotite and calcite and can be considered an alteration step prior to distal zone 2 because it appears incomplete com-pared with the latter. his alteration can be observed in the chemical analysis of the biotites in the thin section 4_236.6 obtained from borehole CDP-04 (Fig. 10A), which belongs to distal zone 1 and appears to be unstable and has lost potas-sium and iron to the point of almost forming chlorite. In dis-tal zone 2, chlorite is already almost completely formed.
Distal zone 2 is characterized by the assemblage chlo-rite, calcite and epidote, indicating a typical calcic alter-ation, which is observed at depths of 84 and 117.5 m in the boreholes CDP-04 and CDP-09, respectively (Fig. 10).
Geochemistry
In the Cascavel prospect, high concentrations of Zn, Cu,
Pb, Ag and W, as well as the pathinder elements (e.g., Ni,
Co, Cr), were found in some borehole layers.
Figure 11 shows the concentrations of Au, Ag, Cu, Zn, Ni, Co, Cr, Pb and W at the diferent borehole depths and
Table 1. Rock samples from the Cascavel site gallery.
Sample
Au content
(ppm)
Description
1694 59.6 Quartz veins with visible gold
1695 52.2 Quartz veins and quartzite (wall rock)
1696 42.2 Quartz veins with visible gold
1697 31.3 Quartz veins with visible gold
1698 61.8 Quartz veins and quartzite (wall rock)
1699 92.1 Quartz veins and quartzite (wall rock)
1701 39.4 Quartz veins and quartzite (wall rock)
1702 121.5 Quartz veins and quartzite (wall rock)
1703 112.5 Quartz veins with visible gold
1704 30.8 Quartz veins with visible gold
1705 35.5 Quartz veins and quartzite (wall rock)
1706 135.5 Quartz veins and quartzite (wall rock)
1707 67.7 Quartz veins and quartzite (wall rock)
1709 79.3 Quartz veins with visible gold
1710 11.9 Quartz veins with visible gold
1711 22.1 Quartz veins with visible gold
1712 12.25 Quartz veins with visible gold
Figure 10. (A) Description of the borehole CDP-04 showing mineralized layers. Photomicrography: a) S-C foliation marked by muscovite in quartz-muscovite schist; and b) deformed potassium feldspar, showing pressure shadows illed with biotite. The muscovite is older than the biotite. (B) Description of the borehole CDP-09 showing mineralized layers. Photomicrography: c) hydrothermal muscovite (1) formed from biotite (2); d) feldspathic quartzite with muscovite; and e) late euhedral pyrite.
0.0 31.4 37.0 43.83 113.8 186.41 193.9 206.0 210.0 233.8 238.44 meters 0.0 33.0 39.7 54.5 59.62 86.5 92.06 129.0 142.4 159.0 166.5 296.0 224.0 304.0 355.0 424.85 407.0 342.5 73.5 103.6 meters Saprolite Saprolite: quartzite
Saprolite: meta-ultramafic (with talc) Saprolite: muscovite quartzite Metavulcanic
Quartz-chlorite-biotite-muscovite schist Carbonaceous schist
Muscovite schist interspersed with carbonaceous schist Carbonaceous schist
Biotite-muscovite schist, with portions rich in biotite Friable impure limestone
Quarzite with hematite Chlorite-quartz-biotite schist
Metarhythmite
Quartzite
Friable dolomitic marble
Quartzite
Biotite-chlorite schist with carbonate
Metapelite
Quartzite with green muscovite
Metapelite Quartzite
Biotite rich metapelite
Quartzite
Biotite-chlorite schist (metapelite)
Feldspathic quartzite with sections rich in green muscovite and sections with hematitic halo
151 to 154.4 m: mineralized interval*
Dolomitic marble (friable material) Dolomitic marble
Quartzite with carbonate 58 m: photo a
Mineralized intervals: 113.00 to 114.00 m: 0.52 g/t Au 151.00 to 154.41 m: 38.28 g/t Au 158.10 to 160.00 m: 0.25 g/t Au 216.00 to 217.47 m: 0.30 g/t Au 219.26 to 219.72 m: 0.21 g/t Au 233.00 to 233.66 m: 0.84 g/t Au 190.00 to 191.00 m: 1.35 g/t Ag 186,41 to 193.80 m: 1.35 g/t Zn 217.47 to 221.79 m: 128.5 g/t Zn 217.47 to 221.79 m: 323.29 g/t Pb 186.41 to 193.8 m: 120.24 g/t W
*152.1 to 152.76 meters: 193.69 g/t Au
Thin section 4_84 Thin section 4_113.1 Thin section 4_149.8 Thin section 4_236.6 Thin section 9_117.5 Thin section 9_221 Thin section 9_266.5 Thin section 9_295.3 Thin section 9_326 Thin section 9_376 0,52 ppm Au
0,88 ppm Au
Photo c
Photo d
Photo e (410 m) Photo b • Biotite • Calcite • Epidote • Titanite • Muscovite • Biotite • Siderite
• Green muscovite • Biotite • Potassium feldspar
• Muscovite • Biotite • Potassium feldspar • Calcite and dolomite
B A C D E A B Mineralized intervals: 95 to 97 m: 1.63 g/t Au 221 to 224 m: 0.69 g/t Au 228.5 to 229.5 m: 0.22 g/t Au 262.5 to 263 m: 0.26 g/t Au 315.2 to 317 m: 0.23 g/t Au 321 to 325 m: 0.29 g/t Au 295 to 296 m: 1.36 g/t Ag 129 to 133 m: 109 g/t Zn 295 to 296 m: 254 g/t Zn 135 to 139.13 m: 93.9 g/t W
CDP_04 CDP_09 • Biotite • Chlorite • Calcite • Epidote • Titanite • Muscovite • Biotite • Siderite
• Pyrite with Ag in the composition • Alloclasite (Co and Ni sulfoarsenide –
low temperature hydrothermal deposits
• Muscovite
• Muscovite • Biotite • Turmaline (~dravite)
• Muscovite • Magnetite • Potassium feldspar
• Green muscovite • Potassium feldspar
FROM FROM
FROM FROM FROM FROM FROM
FROM
3 2 1
0 0 50 100 150 0 100 200 300 0 200 400 600 0 50 100 0 1000 2000 0 100 200 0 50 100 150
Au (ppm) Cu (ppm) Zn (ppm) Ni (ppm) Co (ppm) Cr (ppm) Pb (ppm) W (ppm)
31.37 42 52.72 63 74 85 96 107 117.73 124 129.5 135.5 141.5 147.43 154 160.5 168 179 193 204 214 221.24 230 Depth (m) 16 33.04 49 66 83 99 114 131.6 148 165 182 199 216 229 238.5 248 257 266.09 283 300 312.44 322 331.5 340.5 356 373 382.5 392 401 410 418.65 Depth (m) 16 33.04 49 66 83 99 114 131.6 148 165 182 199 216 229 238.5 248 257 266.09 283 300 312.44 322 331.5 340.5 356 373 382.5 392 401 410 418.65 Depth (m) 16 33.04 49 66 83 99 114 131.6 148 165 182 199 216 229 238.5 248 257 266.09 283 300 312.44 322 331.5 340.5 356 373 382.5 392 401 410 418.65 Depth (m) 16 33.04 49 66 83 99 114 131.6 148 165 182 199 216 229 238.5 248 257 266.09 283 300 312.44 322 331.5 340.5 356 373 382.5 392 401 410 418.65 Depth (m) 16 33.04 49 66 83 99 114 131.6 148 165 182 199 216 229 238.5 248 257 266.09 283 300 312.44 322 331.5 340.5 356 373 382.5 392 401 410 418.65 Depth (m) 16 33.04 49 66 83 99 114 131.6 148 165 182 199 216 229 238.5 248 257 266.09 283 300 312.44 322 331.5 340.5 356 373 382.5 392 401 410 418.65 Depth (m) 16 33.04 49 66 83 99 114 131.6 148 165 182 199 216 229 238.5 248 257 266.09 283 300 312.44 322 331.5 340.5 356 373 382.5 392 401 410 418.65 Depth (m) 16 33.04 49 66 83 99 114 131.6 148 165 182 199 216 229 238.5 248 257 266.09 283 300 312.44 322 331.5 340.5 356 373 382.5 392 401 410 418.65 31.37 42 52.72 63 74 85 96 107 117.73 124 129.5 135.5 141.5 147.43 154 160.5 168 179 193 204 214 221.24 230 31.37 42 52.72 63 74 85 96 107 117.73 124 129.5 135.5 141.5 147.43 154 160.5 168 179 193 204 214 221.24 230 31.37 42 52.72 63 74 85 96 107 117.73 124 129.5 135.5 141.5 147.43 154 160.5 168 179 193 204 214 221.24 230 31.37 42 52.72 63 74 85 96 107 117.73 124 129.5 135.5 141.5 147.43 154 160.5 168 179 193 204 214 221.24 230 31.37 42 52.72 63 74 85 96 107 117.73 124 129.5 135.5 141.5 147.43 154 160.5 168 179 193 204 214 221.24 230 31.37 42 52.72 63 74 85 96 107 117.73 124 129.5 135.5 141.5 147.43 154 160.5 168 179 193 204 214 221.24 230 31.37 42 52.72 63 74 85 96 107 117.73 124 129.5 135.5 141.5 147.43 154 160.5 168 179 193 204 214 221.24 230 CDP 04
576
Brazilian Journal of Geology
, 47(4): 561-590, December 2017
Mineralization from the F
indicates that a correlation occurred among Cu-Zn-Ni-Co-Cr-W, which are primarily associated with the friable dolomitic marble layer. For borehole CDP-04, there were correlations among Cu-Co-Cr, and in CDP-09, the cor-relations include Cu-Zn-Ni-Co, Cu-Zn and Ni-Co-Cr. Gold in both boreholes did not show a correlation with other elements.
Mineral Exploration Vectors
By processing and interpreting the geophysical, geo-chemical and geological data available, the main explo-ration vectors were identified and subsequently used in the production of the final prospectivity map. These vec-tors are summarized in Table 2 and discussed later in the article.
Tinteiro Target
Lithological and Structural Controls
he Tinteiro target site is located west of Cascavel in the central greenstone region. he site is divided into four sub-sites: north, central, southeast and south Tinteiro (Fig. 8). he main lithotypes of Tinteiro are quartzite, feldspathic quartzite, metapelite, metachert and talc schist, which belong to the metasedimentary sequence A (Fig. 8). Gold, copper, silver and iron mineralizations often occur associated with the metachert and take the form of hematite breccias, man-ganiferous breccias or gossan.
he quartzite (Fig. 12A) is ine to medium grained and occurs as massive outcrops that are usually found at the bot-tom of streams in a wide range of colors, including white, yellowish, pinkish and grayish, and it has a granoblastic tex-ture. he modal composition comprises quartz (60–85%) and muscovite (5–30%) as the major minerals, and mag-netite, tourmaline and sulphides the accessory minerals. Alterations rich in iron oxides are common. A feldspathic quartzite lens intruded in the quartzite occurs in the south section of Central Tinteiro, and it is similar to the felds-pathic quartzite lens found in Cascavel.
he metapelites have a lepidoblastic texture, and they form schists with variable compositions and concentra-tions of muscovite (20–60%), chlorite (5–20%) and quartz (10–30%) (Figs. 12B and 12C). he metapelites are usually thinly layered and of greenish color or reddish when weath-ered. Pyrite and magnetite crystals occur locally. In South Tinteiro, ine-grained greenish chloritoid lenses occur within the metapelite.
he metacherts are rocks formed primarily by quartz (60–90%) and muscovite (5–20%), and they have a gray color and ine banding (Figs. 12D and 12E). hese rocks generally form lenses with thicknesses varying from a few centimeters to approximately 500 m, and they are hosted at the contact between the quartzite and the metapelite or within the quartzite packages.
In the north Tinteiro, talc schist lenses characterized by a silky appearance and the presence of cubic pyrite crystals occur embedded in the metachert.
Lineaments extracted from the irst vertical derivative (Dz) (Fig. 7) occur at the target site and are aligned E-W and NW-SE. he main foliation at this site has an average attitude of N28ºW/27ºSW, and the average attitude of the stretching lineation is N79ºW/18º, characterized by min-erals stretched and axis of boudins. he northeast sector of north Tinteiro is intersected by a sinistral fault aligned N50ºE and parallel to the Faina Fault.
he structural controls of mineralization are not fully clear in Tinteiro because, in certain locations, mineralization is intersected by ductile and brittle structural features, such as shear zones, fractures and faults aligned NE-SW, NW-SE and E-W, whereas in other locations mineralization occurs at the intersection of these structures (NE-SW with E-W and NE-SW with NW-SE).
Hydrothermal Alteration Zones
he hydrothermal alteration zones found in all Tinteiro sub-sites are similar. Metapelite, quartzite and metach-ert outcrops (especially) usually show ferric alterations formed by massive goethite and/or hematite associated
Exploration Vectors: Cascavel Target
Geophysical Vectors Geochemical Vectors Geological Vectors
Low amplitude Au anomalous
Intersection of NW-SE, E-W and NE-SW structures Low magnetic gradient Some anomalies Cu
High K values K rich alteration Mineralization next to lithological contacts
Mineralization in quartz veins
Figure 12. Photos of the rocks found in Tinteiro prospect: (A) massive and gray quartzite with muscovite; (B) weathered and folded quartz-muscovite schist; (C) greenish quartz-chlorite-muscovite schist; (D) massive metachert is composed mainly by quartz; (E) inely laminated metachert showing bands rich in quartz alternated
with bands rich in muscovite and biotite.
A C
B
D E
with intense siliciication. he ferric alteration produces a banded appearance of the mineralization host rocks and often leads to the incorrect classiication of a num-ber of units in the Tinteiro site as banded iron formations (Fig. 13A). Hydrothermal green muscovite is commonly found associated with or close to these alterations hosted
in quartzites, metacherts and metapelites, especially in the borehole cores.
Musc: muscovite; Ox: oxides, such as goethite and hematite.
Figure 13. (A) Hydrothermal alteration of the Tinteiro site, which shows solid portions of goethite/hematite in metachert, consisting of hematite breccia; (B) hematite breccia is highly weathered and contains green muscovite; (C) photomicrography of the metallic gray cement of the hematite breccia; (D) detail of the breccia formed by irregular fragments of metachert cemented by metallic bluish gray material; (E) and (F) backscatter images of the manganiferous breccia cement showing that (E) 1, 2 and 3 are hollandite (lighter) and 4, 5 and 6 are lithiophorite (darker); (F) 1 is hollandite, 2, 3 and 4 are lithiophorite, and 5 and 6 are muscovite.
A B
C D
coloration if it is rich in hematite or bluish when rich in manganese. he gossan occurs as brown weathered layers embedded in quartzite or metachert.
he hydrothermal alteration zones were classiied into two zones: a mineralized zone and the proximal alteration zone. he proximal alteration zone is composed of ankerite, magnesium siderite, chlorite and muscovite. he musco-vite is richer in magnesium in the proximal zone than in the mineralized zone.
he mineralized zone is characterized by the presence of arsenopyrite, hematite, muscovite and free gold when asso-ciated with hematite breccias or gossan. he arsenopyrite occurs completely altered and forms goethite. he goethite chemical analyses show high concentrations of arsenic, revealing the origin of this mineral. A number of arsenopy-rite crystals contain gold and/or silver in the inner structure.
Ilmenite and rutile crystals are common in this zone and interpreted as resulting from biotite alterations. A number of samples present monazite crystals.
When associated with manganiferous breccias, the mineral-ized zone is charactermineral-ized by the presence of manganese oxides and muscovite. Backscatter images of an oxide sample extracted from the metallic blue cement are shown in Figures 13E and 13F. he image shows mineral zonation formed from lighter and darker zones as well as muscovite crystals. he chemical composition of these oxides indicate that they can be clas-siied as hollandite (Ba(Mn+4,Mn+3)
8O16), which forms the
lighter zone, and lithiophorite ((Al,Li)Mn+4O
2(OH)2), which
forms the darker zone (Figs. 13E and 13F).
Hollandite is a manganese oxide rich in barium and found as a secondary mineral in oxidized zones of manga-nese deposits, as a primary mineral in contact metamor-phism, in deposits showing hydrothermal veins (Post 1999).
Lithiophorite is a manganese oxide with lithium that is often found in weathered zones of manganese deposits or in low-temperature hydrothermal veins (Post 1999). he eletron microprobe analysis does not measure concentrations of lith-ium; however, the ICP-MS analyses of the breccia samples show anomalous concentrations of lithium at 178.2, 230 and 560 ppm, which veriied its identiication.
Chemical analyses of the breccia show anomalous concen-trations of silver at 245 and 4,234 ppm, although they did not show positive results for gold. he electron microprobe analysis reveals the presence of Ag and Au as minor compo-nents of the hollandite and the lithiophorite. he concen-tration of silver varies from 0 to 450 ppm in some of these minerals and did not appear to be correlated with any of the other elements. he concentration of gold varies from 0 to 1,510 ppm, which was higher than the silver concentrations. he samples showing higher concentrations of gold are cor-related with higher concentrations of Ba, i.e., with hollandite.
Although high concentrations of Au appeared to be asso-ciated with hollandite, not every hollandite included Au.
he electron microprobe analyses reported consider-able amounts of Ni, Cu, Co and Zn in the lithiophorite structure. his result corroborates the chemical analyses conducted by Post (1999), who indicated that Li, which is usually found at concentrations of approximately 0.2 to 3% in lithiophorites, is commonly substituted by the transition metals Ni, Cu, Co and Zn.
his breccia was intercepted by the borehole TIN-1A at depths of 1.0 and 5.74 m. he chemical analyses at this depth range revealed a strong correlation between Li, Cu, Co, Ni, Mn and Zn found in lithiophorite minerals (Fig. 14). he electron microprobe analyses of the samples extracted from this layer show high concentrations of Ag, Ba, Pb and V associated with hollandite and lithiophorite.
Geochemistry
he geochemical studies of the Tinteiro site reveal high polymetallic potential, which indicates an IOCG deposit (Swanepoel 2014). Many of the chemical elements, includ-ing Ag, Cu, Fe, Co, Ni, Zn, Mn, Li, Ba and V, show posi-tive responses at all four sub-sites. hese results have been obtained from the geochemical maps generated according to the rock and soil samples.
he North Tinteiro site is rich in iron at concentra-tions reaching up to 50%, mainly in the western sector. Iron shows a weak correlation with zinc and copper and is inversely correlated with silver and tungsten, which in turn are mutually correlated. Gold occurs in concentrations of up to 10.25 ppm and is always associated with samples rich in iron and, in certain samples, copper. he strongest correlations found at the site are with barium, nickel and chromium, with the latter occurring in concentrations of up to 2,045 ppm, the highest across all Tinteiro sub-sites.
Central Tinteiro shows the highest concentrations of all Tinteiro sub-sites for elements, such as Au (23.9 ppm), Co (10,000 ppm), Cu (3,995 ppm), Mn (168,200 ppm), Ni (5,600 ppm), Pb (216 ppm) and Zn (2,580 ppm). hese elements are not spatially correlated because they occur dispersed across the site.
Southeast Tinteiro is characterized by the presence of manganiferous breccia in the southeastern sector and shows strong Ag, Ba, Co, Cu, Li, Mn, Ni, V and Zn anomalies. Most noticeable are the high concentrations of silver and lithium at up to 4,234 ppm and 560 ppm, respectively.
1 2.16 3.38 5 6.38 7.63 9 11 12.44 14.15 16.41 18 19.36 20.89 22.06
Interval composed by breccia Correlated elements and components of litiophorite
) m( ht p e D 1 2.16 3.38 5 6.38 7.63 9 11 12.44 14.15 16.41 18 19.36 20.89 22.06 ) m( ht p e D 1 2.16 3.38 5 6.38 7.63 9 11 12.44 14.15 16.41 18 19.36 20.89 22.06 ) m( ht p e D 1 2.16 3.38 5 6.38 7.63 9 11 12.44 14.15 16.41 18 19.36 20.89 22.06 ) m( ht p e D 1 2.16 3.38 5 6.38 7.63 9 11 12.44 14.15 16.41 18 19.36 20.89 22.06 ) m( ht p e D 1 2.16 3.38 5 6.38 7.63 9 11 12.44 14.15 16.41 18 19.36 20.89 22.06 ) m( ht p e D 1 2.16 3.38 5 6.38 7.63 9 11 12.44 14.15 16.41 18 19.36 20.89 22.06 ) m( ht p e D 1 2.16 3.38 5 6.38 7.63 9 11 12.44 14.15 16.41 18 19.36 20.89 22.06 ) m( ht p e D 1 2.16 3.38 5 6.38 7.63 9 11 12.44 14.15 16.41 18 19.36 20.89 22.06 ) m( ht p e D 1 2.16 3.38 5 6.38 7.63 9 11 12.44 14.15 16.41 18 19.36 20.89 22.06 ) m( ht p e D 1 2.16 3.38 5 6.38 7.63 9 11 12.44 14.15 16.41 18 19.36 20.89 22.06 ) m( ht p e D 1 2.16 3.38 5 6.38 7.63 9 11 12.44 14.15 16.41 18 19.36 20.89 22.06 ) m( ht p e D 1 2.16 3.38 5 6.38 7.63 9 11 12.44 14.15 16.41 18 19.36 20.89 22.06 ) m( ht p e D
581
, 47(4): 561-590, December 2017
Daniela Schievano de Campos
Mineral Exploration Vectors
he main exploration vectors covering the Tinteiro site are described in Table 3.
Data Integration in Prospectivity
Maps: Selecting New Target Sites
Fuzzy logic has been shown to be an eicient tool in the search for new prospecting targets; therefore, it has been widely used in mineral study projects of various types and
scales (Nykänen et al. 2008). his technique is an approach
based on expert knowledge and converts semantic descrip-tions into numerical spatial models that predict the location of the object of interest (Raines et al. 2010). he application of this method in the study area aims to show zones with similar geophysical, geochemical and geological signatures, thus indicating potential gold or polymetallic mineraliza-tion hosts. In recent decades, the applicamineraliza-tion of this meth-odology has provided excellent results in areas where lim-ited information is available, and it has provided high-level prospecting scenarios in established mining areas (Nykänen 2008, Silva et al. 2012).
he fuzzy methodology was applied to create the pro-spectivity maps for Cascavel and Tinteiro sites. he models used in this study have been suggested by Nykänen (2008) for applications in orogenic gold and IOCG deposits. he geologic input data included lithology and structures controlling gold mineralization at each target site. he geo-physical images used included ASA, Dz, F factor and eU (ppm) because they represent important prospecting vec-tors in the region. he geochemistry model included con-centrations of gold and silver in addition to Fe, Cu, Co and As, which is related to sulphidation and oxidation, and K in potassic alteration zones.
Fuzzy logic can use values between 0 and 1 (Raines
et al. 2010), in which 0 represents “no membership” and
1 represents “full membership” data (i.e., 100% chance of
occurring). herefore, all of the data used in the models were reclassiied according to this scale using fuzzy membership functions, including fuzzy categorical, fuzzy large and fuzzy small. he next step consists of selecting the fuzzy opera-tor that best represents the data interactions. he follow-ing operators were used: fuzzy AND, fuzzy OR and fuzzy gamma, which is a combination of fuzzy sum and fuzzy
product (An et al. 1991, Bonham-Carter 1994). In
condi-tions in which γ = 1, the combination will be equal to the
fuzzy sum, and in conditions where γ = 0, the combination
will be equal to the fuzzy product (Nykänen et al. 2008).
he fuzzy categorical function was applied for the lith-ological and structural data. In the lithologies with greater potential for mineralization, the fuzzy values were higher (equal or close to 1), whereas the less mineralized rocks
received values equal or close to 0 (Tab. 4). herefore, the mineralized manganiferous breccia found in the southeast Tinteiro site received a value equal to 1 and, the Cascavel dolomitic marble received a value equal to 0 because this lithology is not associated with orogenic gold.
he mineralizations occurring in the target sites appear to be related to more than one type of structures, a subject requiring further investigation. Considering this, the three main structures (NE-SW, NW-SE and E-W) identiied in the geophysical maps and the Landsat 7 ETM+ image were used in the fuzzyication process. A value equal to 0.9 was assigned to sites at which one of the three structure types was present and a value equal to 0.5 was assigned to sites at which the three types of structures were not observed. he inluence area measured in the ield difers for the three
Table 4. Fuzzy membership values assigned to each
lithology.
Cascavel Target Tinteiro Target
Lithology Fuzzy
membership Lithology
Fuzzy
membership
Feldspathic
quartzite 0.8 Breccia 1.0
Metapelitic 0.4 Metachert 0.9
Quartzite 0.3 Feldspathic
quartzite 0.8
Metarritmite 0.2 Metapelitic 0.4
Dolomitic
marble 0.0 Quartzite 0.3
Metarritmite 0.2
Talc schist 0.0
Exploration Vector: Tinteiro Target
Geophysical Vectors
Geochemical
Vectors Geological vectors
High
amplitude Au, Ag, Cu, Fe, Co, Mn,
Li, Ba, Ni anomalous
Intersection of NW-SE, E-W and NE-SW
structures High
magnetic gradient
High eU values
Fe and As rich alteration
Mineralization in metachert and
metapelitic
Gossan and breccias occurrences
Table 3. Main mineral exploration vectors identiied in
types of structures (100 m for structures aligned NE-SW, 80 m for structures aligned NW-SE and 50 m for structures aligned E-W). he fuzzy operator AND was applied to inte-grate the three structures and identify their intersection.
he other geophysical and geochemical data were inter-preted, reclassiied (fuzzy membership) and integrated (fuzzy operators) separately for each site. Although the Cascavel and Tinteiro sites are spatially close, they have diferent char-acteristics, with the gold mineralization in Cascavel hosted in an orogenic deposit and the polymetallic mineralization in Tinteiro of the IOCG type.
he Tinteiro site was subdivided into the sub-sites north, central, southeast and south, with each covered in speciic models. Geochemical diferences are the main diferences between each sub-site, with silver anomalies only found in the southeast and south sub-sites and cobalt found in the central and southeast sub-sites. Iron, Au, Cu and As were used in all models.
Cascavel Target
he gold mineralization of the Cascavel deposit is found in an area of low magnetic amplitude with high concentra-tions of radioelement K (Tab. 2). he aeromagnetic data are corroborated by the measurements indicating low magnetic susceptibility. Based on these results, ASA and Dz were used in the fuzzy small function and the F factor was used in the fuzzy large function. Subsequently, the fuzzy operator AND was used to identify the intersection between Dz and the F factor, which produced conservative results (Fig. 15A).
In the geochemical model, fuzzy large was used for Au, K (because of the potassic alteration characteristic of the mineralized zone), Fe, As and Cu. Fuzzy OR was used for Fe and As to assess each element individually, and then fuzzy AND was used for Cu and the results from the
pre-vious operation. Fuzzy gamma at γ = 0.9 was applied to
integrate the geophysical, geochemical, lithological and structural data, thus generating the prospectivity map shown in Figure 16.
he high-favorability regions are associated with felds-pathic quartzite. he model shows that the Cascavel deposit is located on top of the favorable region.
Tinteiro Target
his site is characterized by the presence of gold min-eralization and Ag, Fe, Co, Cu anomalies, amongst others.
he geophysical characteristics shown in Table 3 were used to apply fuzzy large to ASA and eU, and the fuzzy operator AND was applied to both, thus identifying the intersections. Fuzzy small was applied to Dz.
For all of the sub-sites, fuzzy large was applied for Fe, Cu and As (associated with sulphitation) and followed by fuzzy
AND, and these functions were integrated in the models (Figs. 15B-15E). Fuzzy large for Co was incorporated in the central Tinteiro and southeast Tinteiro models because this element shows concentrations above 10,000 ppm in these areas (Figs. 15C and 15D). Fuzzy large for Au was applied across all Tinteiro sub-sites and integrated with fuzzy large for Ag through the fuzzy operator OR in the southeast and south Tinteiro sub-sites. Figure 17 and 18 show the pro-spectivity maps produced for Tinteiro using fuzzy gamma with γ = 0.7.
All of the prospectivity maps show high-favorability regions for mineralization. he main lithology associated with high favorability is metachert, which is apparent in the four Tinteiro sub-sites. North Tinteiro shows two main high-favorability regions: one in the southeast sector and the other one in the southwest sector. In the latter, a reined soil grid was used, which presented positive results for gold. In this sub-site, medium-favorability regions (0.71–0.80) occur in association with metapelites. In central Tinteiro, there are seven main high-favorability regions associated with metachert and metapelite. Boreholes TIN-04 and TIN-05 were obtained from one of these regions in the southwest region of the site, with TIN-04 showing posi-tive results for gold and silver and TIN-05 only showing positive results for silver. In southeast Tinteiro, ive high favorability regions were identiied, with four associated with metachert and the ifth associated with manganifer-ous breccia. Boreholes TIN-1, TIN-1A, TIN-2 and TIN-3 cross this breccia layer and show anomalous concentrations for many elements, including silver, copper, cobalt, manga-nese, barium and lithium. In south Tinteiro, ive favorable regions were identiied in association with metachert and with quartzite (in the northern sector). he soil samples do not present good correlations with these areas because the positive results for gold are found across the entire sub-site.
VALIDATION AND
EVALUATION OF
THE BEST PREDICTORS
All of the prospectivity maps generated in this study show high-favorability areas, suggesting a new direction for exploration studies at the target sites. However, the ques-tion of whether the resulting model is reliable remains to be answered.
Figure 15. Flowchart representing the steps of the fuzzy logic method for: (A) Cascavel; (B) North Tinteiro; (C)
Central Tinteiro; (D) Southeast Tinteiro, and (E) South Tinteiro.
A) Cascaval
Geology Geochemistry
Geophysics
Operator Fuzzy gamma 0.9
Operator
Fuzzy AND Fuzzy ANDOperator Fuzzy ANDOperator
Operator Fuzzy OR Fuzzy Large Fuzzy Large Fuzzy Large Fuzzy Large Fuzzy Categoric Fuzzy Categoric Fuzzy Large Fuzzy Small ASA Au Fe As
Cu Lithology Structures
NW-SE E-W NE-SW K Fuzzy Large Fuzzy Small
F factor Dz
B) North Tinteiro Operator Fuzzy gamma 0.7
Geochemistry Operator Fuzzy AND Fuzzy Large Au Fuzzy Large Fe Fuzzy Large As Fuzzy Large Cu Geophysics Operator Fuzzy AND Fuzzy Small eU Dz ASA Fuzzy Large Fuzzy Large Geology Operator Fuzzy AND Fuzzy Categoric Fuzzy Categoric Lithology Structures NW-SE E-W NE-SW
D) Southeast Tinteiro Operator Fuzzy gamma 0.7
Geochemistry Fuzzy Large Au Operator Fuzzy AND Operator Fuzzy OR Fuzzy Large Fe Fuzzy Large Ag Fuzzy Large As Fuzzy Large Cu Fuzzy Large Co Geophysics Operator Fuzzy AND Fuzzy Small eU Dz ASA Fuzzy Large Fuzzy Large Geology Operator Fuzzy AND Fuzzy Categoric Fuzzy Categoric Lithology Structures NW-SE NE-SW E-W
E) South Tinteiro Operator Fuzzy gamma 0.7
Geochemistry Fuzzy Large Au Operator Fuzzy AND Operator Fuzzy OR Fuzzy Large Fe Fuzzy Large Ag Fuzzy Large As Fuzzy Large Cu Geophysics Operator Fuzzy AND Fuzzy Small eU Dz ASA Fuzzy Large Fuzzy Large Geology Operator Fuzzy AND Fuzzy Categoric Fuzzy Categoric Lithology Structures NW-SE NE-SW E-W
C) Central Tinteiro Operator Fuzzy gamma 0.7