Ravilson Antônio Chemin Filho
[email protected]Paulo Victor P. Marcondes
[email protected] Federal University of Paraná – UFPR 81531-990 Curitiba, PR, BrazilTrue Strain Distribution Profile on
Sheet Metal Using Different Punch
Geometries
Changes are often necessary during the tryout of stamping tools. These changes may range from adjustments on die and punch designs to the selection of a new material with better formability characteristics. All these actions, however, require time and money creating the need for better initial sheet metal evaluation. Hence, increasing attention has focused on the development of laboratory tests that enable stamping companies to know more about the sheet metal stampability or that can, at least in part, ensure that their stamped products are produced without major problems. Identification of high stress region on stamping may allow for better tool stamping adjustment during tests, rendering a more uniform material’s deformation and leading to the production of higher quality parts. Increasing attention has focused on the material evaluation based on the tool geometries in order to calculate the strain distribution. This study deals with an evaluation of four punch models with varied geometries in addition to the traditional Nakazima test tool. An evaluation was also made of the major true strain distribution profile at points distributed linearly from the region close to the die shoulder to the punch center.
Keywords: stamping, tool geometry, true strain profile
Introduction
1
A perfect sheet metal formability understanding is essential in the production of quality stamped products (Keeler 1968; Haberfield 1975). Process planners and tool designers must determine the level of formability required for each workpiece to be stamped (Woodthorpe 1969; Kumar 2002). Also the sheet formability of each lot to be used in production must be evaluated in order to check the material’s conformity degree. Manufacturers and suppliers of raw material must, in turn, measure and control their products’ formability to ensure their clients receive sheets that will be formed within their real stampability conditions.
Formability is a difficult property to determine, since there is no single parameter that allows for the global evaluation of all stamping processes (Boyles 1982). Under certain working condition a material may be easily formable with a given tool but tear when worked with another tool with a different configuration.
Changes are often necessary when trying out stamping tools (Makinouchi 1996), and such changes may range from the choice of a new material with better formability to adjustments in the dies and punches design in order to achieve the degree of satisfaction expected for the product (Fallbohmer 1996; Hongzhi 2002).
The identification of regions of stretching, deep drawing and/or plane strain during forming can contribute to improve the stamping process through tool geometry optimization (Buchar 1996; Koop 1996). Therefore, the material’s Forming Limit Curve (FLC) corresponds to the geometrical location of the maximum true strain points of a sheet subjected to stretching, deep drawing and/or plane strain condition (Nakazima 1969). The knowledge of the FLC is essential in order to ensure that the true strain distribution produced during industrial scale does not exceed the safe strain, thus ensuring the quality of the final product. Current researches are aimed to improve Nakazima’s test tools to produce more realistic results, characterizing as best as possible the phenomenon acting during large plastic deformation (Sampaio 1998; Yao 2002).
The tool designers should be capable to predict during the process design the main factors that can limit the sheet forming as necking. However, sheet metal forming is an industrial process strongly dependent on innumerous interactive variables: material
Paper accepted August, 2008. Technical Editor: Marcelo A. Savi.
behavior, forming equipment, strain rate, etc. The correct choice of these parameters has appeared as one of the main aims of the automobile industry (Gronostajski et al., 1998).
Regardless of the forming production the core objective of stamping die-makers is to design and manufacture a set of forming tool that can be used reliably for a defect-free sheet metal product within the desired dimensional tolerances and the required surface quality. Since there exists rarely an analytical expression describing the relationships between these designs parameters, the dimensioning and integration of the tooling elements constituting the forming interface follow a series of costly try-and-error procedures on the workshop floor (Firat, 2007).
The material formability analysis is usually evaluated through the concept of Forming Limit Diagrams (FLD). Some analytical models are being developed but the Forming Limit Curve (FLC) construction is still basically experimental.
In this work, the results expectation is to help the material evaluation, based on the tool geometries, in order to determine the best process condition. This paper analyzes the major true strain distribution profile (ε1) produced in a stamped specimen using various punch geometries proposed by Borsoi et al. (2000). As we analyzed a simple shape part the Forming Limit Strain Diagram was chosen instead the Forming Limit Stress Diagram - independently on strain path - (Gronostajski et al., 2004).
Nomenclature
FLC = forming limit curve FLC = forming limit diagram P1 = cylindrical punch P2 = shallow-ellipse punch P3 = hemispherical punch P4 = deep-ellipse punch P5 = extra deep-ellipse punch R1 = punch head radius R2 = external congruence radius TS = test specimens
Greek Symbols ε
1 = major true strain
Subscripts
Experimental Procedure
The material used was a cold-rolled mild steel alloy produced by Thyssen Krupp to the DC06 specification (0.7mm thickness). This material was selected because it has a high value of stampability.
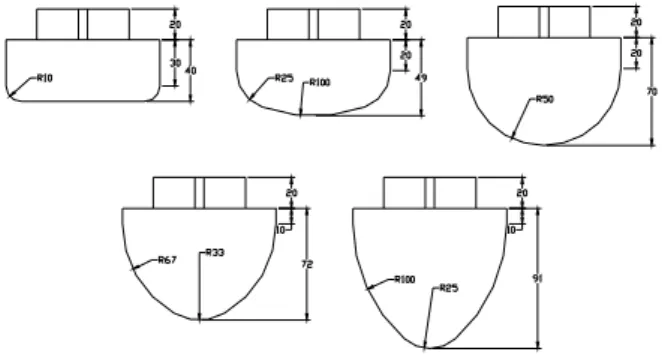
The tests involved four punch models incorporated into Nakazima’s stamping test tooling, as well as the original hemispherical punch. The first punch model – cylinder shaped, was dubbed P1 and the second model – shallow ellipse shaped, was dubbed P2. The traditional hemispherical punch was identified as P3, and punch P4 was designed in the shape of a deep ellipse. The last punch model designed for the tests had an extra-deep ellipse shape and was identified as P5 (Fig. 1). The four proposed punch models had a 100mm diameter, following the dimensions proposed by Nakazima (1969).
An important factor in the development of the geometry of each punch used in this study was the specification of the R1 and R2 radii, the former corresponding to the size of the punch head and the latter responsible for the congruence of R1 with the rectilinear portion of the tool. The congruence between these radii was the determining factor in assigning the aforementioned shapes to each punch (Fig. 1).
Figure 1. Punch geometry and congruence radii of each tool.
Nakazima’s test originally foresees a total of eighteen test specimens, all with a length of 200mm and widths varying from 40 to 200mm. This variation in the test specimens’ widths is what enables one to simulate the prevailing deformation modes during the test. The basic modes are: stretching, which occurs when the sample’s width suffices for the full action of the drawbed around the entire contour of the stamped body and deep drawing, when the test specimen is narrower, so that a lateral portion of the test specimen is not held by the drawbed.
Two sheet metal test specimens (TS) were evaluated in this study, one being 200 x 200mm (for the stretching condition) and the other 125 x 200mm (for the deep drawing condition). Both were tested with the five punch models adopted for the tests. The tests were carried out without lubrication, a condition considered more critical in terms of friction. An average of three test specimens was evaluated for each punch geometry.
A 4.2mm diameter grid (circles) was imprinted on the surface of the test specimens. This grid served to measure the true strain after stamping. The grid was imprinted using a new process developed during this research, which differs from the processes usually used previously (electrolytic, photosensitive resin or laser marking). This new marking process uses a screen (mask) similar to the kind used in the silkscreen technique and a grid fixer developed for the coated metallic sheet employed. The process proved simpler, easier to apply and cheaper, since no special equipment is required to the grid imprint.
In the stamping process, the test specimens, with circular grids uniformly imprinted upon them, were deformed up to the point of
rupture. The shape of the initial circles changed to larger circles or ellipses after deformation, with greater elongation of the ellipse at the points of major true strain. After the tests, the ε1 axes measurements were taken of the circles arranged along a straight line from the edge of the stamped cup (where the material lies against the die shoulder) to its center (where the punch head was pressed against the material), as illustrated in Fig. 2. The measurements were taken on the side of the test specimen opposite the fracture in order to avoid measurements in cracked circles.
Figure 2. TS showing the measured points for the true strain distribution profile.
The results were plotted on a graph showing the major true strain variation at each measured point, i.e. from point 1 (which corresponds to the die shoulder) to the point 12 corresponding to the punch top (punch pole). The configuration of this diagram clearly shows the major true strain distribution profile along the test specimen, indicating especially the maximum ε1 degree achieved with each punch (for the 125mm and 200mm wide test specimens), as well as the position of this maximum ε1 point along the tested specimen. The position of the ε1 peak point allows one to identify which part of the punch acted in this region, i.e. whether the material’s maximum ε1 was caused by the punch head radius (R1) or by the external congruence radius (R2).
Results and Discussion
The Figure 3 illustrates the major true strain distribution profile (ε
1) of the 200 x 200mm test specimen stamped with the cylindrical
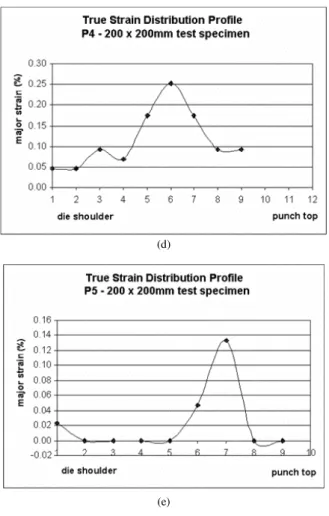
punch (P1) – a; the ε1 distribution profile of the 200 x 200mm test specimen (shallow-ellipse punch - P2) – b; the ε1 distribution profile of the 200 x 200mm test specimen using the hemispherical punch (P3) – c; the ε1 distribution profile of the 200 x 200mm test specimen using the deep-ellipse punch (P4) – d; the ε1 distribution profile of the 200 x 200mm test specimen using the extra deep-ellipse punch (P5) - e.
The Figure 3 - a shows a maximum ε1 peak between points 3 and 4 in the exact position of the tool’s external radius. This punch geometry does not present any curvature at the punch head, which is flat, so that the highest stress level and hence the ε
1 peak (in the
range of 0.14) are limited to this tool region.
A comparison of the curve obtained in the test with the cylindrical punch (P1), shown in Fig. 3 - a, with the curve obtained with the shallow-ellipse shaped punch (P2), shown in Fig. 3 - b, indicates that the ε1 peak shifted to a higher strain degree (0.15), while its position was concentrated at points 4 and 5 (shifting visibly away from the die shoulder toward the punch top).
external radius (R2) because this congruence radius is much smaller than the punch head radius (R1). The slight increase in the ε1 from 0.14 for punch P1 to 0.15 for punch P2 occurred because the external radius R2 (punch P2) was larger than the external radius of punch P1, which generated a lower stress concentration in this critical material region (allowing the sheet to reach a slightly higher stampability).
The Figure 3 - c depicts the major true strain distribution profile for the hemispherical punch (P3), which corresponds to the model originally used in the Nakazima tests.
(a)
(b)
(c)
Figure 3. Major true strain distribution profile of the 200 x 200mm test specimen: a - cylindrical punch ( P1); b - shallow-ellipse punch (P2); c - hemispherical punch (P3); d - ellipse punch (P4) and e - extra deep-ellipse punch (P5).
(d)
(e)
Figure 3. (continued).
The ε1 distribution profile obtained with punch P3 showed the same tendency as the curve resulting from the strain measurements of punch P2 with the major true strain peak displaced to the punch top direction (right-hand side of the graph). Punch P3 caused this variation in the curve to increase further, with the ε
1 peak in the
range of 0.29 (the maximum ε1 was positioned between points 6 and 7).
Both the increase in strain and the shift of the curve’s peak toward the punch top were greater than the variation presented by punch P2 (when compared with punch P1). The hemispherical punch (P1) has presented a single radius that encompassed the entire punch profile. In other words, there was no congruence between an external radius (R2) and an internal radius (R1) that could concentrate stresses in a specific position of the material under the tool influence. Therefore, the uniform geometry of punch P3 generated a better stress distribution on the material surface, allowing the sheet to reach a higher formability at an intermediary point between the die shoulder and the punch top (corresponding to the tool’s curvature radius, i.e. being the main point of action of the punch on the sheet).
which explains the displacement of the ε1 peak to the punch top position.
From the curves obtained for punches P4 and P5, it is clear that the ε1 peak was positioned at point 8 for P4 and at point 9 for P5 (which had an even smaller R1 radius than P4) while, for the hemispherical punch (P3), this extreme point of the curve was situated between points 6 and 7. These data indicate that the reduction of the radius at the punch top caused the tool to act preferentially in the central portion of the tested sample, making this the sheet major true strain region. The surrounding material region was not in direct contact with the stamping punch, so it did not undergo strain as severe as that in the sheet metal central area.
The smaller the punch head radius the greater the material stress concentration leading to a lower stampability degree. This statement is reinforced by the results obtained for the ε1 degrees illustrated in the curves shown in Figs. 3 - d and 3 - e. Since P4 showed a smaller R1 radius than P3, it is clear that the curve resulting from the tests with this punch had its point of maximum ε1 reduced to 0.24, while punch P5 (whose radius is even smaller than P4) promoted an even smaller ε1 peak of around 0.13.
In a sequence from punches P1 to P5, the characteristics of the aforementioned curves clearly indicate that the more uniform the tool geometry the more homogeneous the stress distribution in the stamped material, enabling the material to reach higher strain degrees.
The same kind of graphs (major true strain distribution profiles) were also drawn for the 125 x 200mm test specimens in order to evaluate the ε1 degree and the position of the peak between the die shoulder and the punch top for this different test specimen model.
The Figure 4 illustrates the major true strain distribution profile (ε1) of the 125 x 200mm sample tested with the cylindrical punch (P1) – a; the ε1 distribution profile in the 125 x 200mm test specimen using the shallow-ellipse punch (P2) – b; the ε1 distribution profile in the 125 x 200mm test specimen using the hemispherical punch (P3) – c; the ε1 distribution profile in the 125 x 200mm test specimen using the deep-ellipse punch (P4) – d; the ε
1
distribution profile in the 125 x 200mm test specimen using the extra deep-ellipse punch (P5) - e.
(a)
Major true strain distribution profile in the 125 x 200mm test specimen: a - cylindrical punch (P1); b - shallow-ellipse punch (P2); c - hemispherical punch (P3); d - ellipse punch (P4) and e - extra deep-ellipse punch (P5).
(b)
(c)
(d)
(e)
The curve shown in Fig. 4 - a clearly indicates that the ε1 peak remained at point 3, i.e. in a position close to the die shoulder at the height of the punch’s external radius (R2). As in the case of the 200 x 200mm test specimen, the ε1 position was concentrated at the tool’s smaller radius region. However, the degree of strain varied, passing from 0.14 to approximately 0.18. This variation on the ε1 degree was due to the variation in the geometry of the test specimen, since the 125mm wide specimen did not suffer the action of the drawbed around the entire contour of the punch, allowing the sheet to deform laterally with greater freedom. This material freedom to deform in the direction of the test specimen’s width is what causes the greater elongation of the printed circles, i.e. becoming ellipses toward to the test specimen length. Thus, the narrower sheet provides greater major true strain (ε
1) and smaller minor true strain
(ε2) points, evidencing forming by deep drawing.
The curves drawn for the 125mm-wide test specimen tested with punches P2, P3, P4 and P5 (shown in Figs. 4 - b, 4 - c, 4 - d and 4 - e, respectively) reveal the same tendency as the curves obtained in the tests with the 200 x 200mm sheets, when the ε1 peak increased from punch P1 and P2 up to the hemispherical punch (P3) and thereafter declining as punch P4 and P5 were used. As for the ε1 degree, the peaks position also shifted along the sheet similarly to the displacement observed for the 200 x 200mm test specimens, i.e. from a position close to the die shoulder (for P1) to a position almost at the punch top (for P5). This ε1 peak displacement toward the punch top region (following a testing sequence starting from punch P1 and ending with P5) was also due to the effect caused by the R1 and R2 radii of the punches, i.e. the ε1 peak concentrated consistently at the tool’s smallest radius (a position that acted as a material stress concentrator).
The curve obtained with the shallow-ellipse punch (P2), Fig. 4 - b, displayed the ε1 peak at approximately 0.30 for the 125mm-wide sheet, while the tests on 200 x 200mm sheets showed ε1 of 0.15. This ε1 variation was of 100% and the position of this peak, which had previously been located on point 4, was now situated between points 3 and 4.
The tests with the hemispherical punch (P3) resulted in ε1 peak of approximately 0.40 with the 125 x 200mm sheet and 0.30 with the 200 x 200mm sheet. The curve’s peak position was also slightly displaced toward the die shoulder since ε1 occurred at point 7 (in the previous tests with 200 x 200mm test specimens) passing to point 6 with the 125 x 200mm test specimens.
For the curve generated with the deep-ellipse punch (P4) the displacement of the ε1 peak toward the die shoulder was even greater, starting from point 9 with 200 x 200mm test specimens to a position between points 6 and 7 with the 125 x 200mm sheets.
For the hemispherical punch (P3) the ε
1 peak point was almost
in the same position for the both samples and the degree of strain attained was also practically identical, showing a value around 0.40. Based on these results, it can be stated that in the case of the 125 x 200mm sheet metal, which simulated a condition closer to that of forming by deep drawing, both the ε1 degree and peak position varied very little between punches P3 and P5. Therefore, with regard to these parameters, one can state that the geometry of P4 did not exert any significant influence when compared with P3, which cannot be said for the 200 x 200mm sheet (where a significant parameters variation was observed).
As in the previous cases, the extra deep-ellipse punch (P5) also produced a ε
1 peak displaced towards the left (from point 10 to point
8), with a higher value than that attained with the 200 x 200mm sheet (from 0.14 to approximately 0.22). In this case, however, the results with P5 and P4 punch type showed a greater variation than those of P3 and P4 and the tendency for shifting the ε1 peak towards the punch top was maintained reaching a lower strain degree due to
the smaller radius of P5 with greater stress concentration during forming.
From these graphs it can be concluded that, in the case of both the 125 x 200mm and the 200 x 200mm sheets, the major true strain distribution profile tended to attain a low value of strain with punch P1 (small R2 radius), which increased with punch P2 and reached its highest level with punch P3 (as the R1 and R2 radii increased), declining thereafter with punch P4 and P5, whose R1 radius was smaller. The only exception occurred in tests with the 125 x 200mm sheet using punch P3 and P4. For these punch models it were produced only very slight variations in strain degree and in the peak position. In resume, it was concluded that the ε
1 peak shifted from
the die shoulder (starting from punch P1) to close to the punch top (with P5) due punch P1 and P2 had a smaller external congruence radius (R2). In these cases the stresses were concentrated close to the die shoulder, while for P4 and P5 that possessed a smaller punch head radius (R1) showed the stresses at the punch top.
Conclusion
The results described herein confirm that the material tended to suffer a greater stress concentration at the tool’s smallest radius, as indicated by the major true strain distribution profile measured from the die shoulder to the punch top (punch pole). The maximum major true strain peaks were found to occur close to the die shoulder when using the cylindrical and shallow-ellipse punches (whose external congruence radius was smaller than the punch head radius) and close to the punch top when using more pointed tools (deep and extra deep-ellipse shaped punches). We can therefore conclude that the point measurement technique along the test specimen, creating a profile, represents a useful tool for evaluating the critical punch action region upon the sheet and these points should be well adjusted preferentially during the tools tryout.
Acknowledgments
We are indebted to Volkswagen do Paraná/Brazil for supplying the samples of DC06 sheet metal and to CAPES Brazil) for granting a Master’s scholarship.
References
Borsoi, C. A., Hennig, R. and Schaeffer, L., 2000, “Novo teste tecnológico no LdTM para a melhor determinação da conformabilidade de chapas metálicas”, III Conferência Nacional de Conformação de Chapas, IV Conferência Internacional de Forjamento, Porto Alegre, Brasil, pp. 50-59.
Boyles, M. W. and Chilcott, H. S., 1982, “Recent developments in the use of the stretch-draw test”, Sheet Metal Industries, pp. 149-156.
Buchar, Z., 1996, “Circle grid analysis applied to the production problems of the car body panel”, Journal of Materials Processing Technology, vol. 60, pp. 205-208.
Fallbohmer, P., Altan, T., Tonshoff, H.-K. and Nakagawa, T., 1996, “Survey of the die and mold manufacturing industry”, Journal of Materials Processing Technology, vol. 59, pp. 158-168.
Firat, M., 2007, “Computer aided analisys and design of the sheet metal forming processes – part I: the finite element modeling concepts; part II: deformation response modeling; part III: stamping die face design”,
Materials & Design, vol. 28, no. 4, pp. 1298 – 1320.
Gronostajski, J., Gronostajski, Z., Matuszak, A., Niechajowicz, A. and Zimniak, Z., 1998, “The system for the sheet metal forming design”,
Inzynieria Materialowa, vol. 19, 268.
Gronostajski, J., Matuszak, A., Niechajowicz, A. and Zimniak, Z., 2004, “The system for sheet metal forming design of complex parts”, Journal of Materials Processing Technology, vol. 157-158, pp. 502-507.
Haberfield, B. and Boyles, M. W., 1975, “Modern concepts of sheet metal formability”, Metallurgist and Materials Technologist, pp. 453 - 456.
Keeler, S. P., 1968, “Understanding Sheet Metal Formability”, Machinery.
Koop, R., 1996, “Some current development trends in metal forming technologies”, Journal of Materials Processing Technology, vol. 60, pp. 1-9. Kumar, D. R., 2002, “Formability analysis of extra-deep drawing steel”,
Journal of Materials Processing Technology, vol. 130-131, pp. 31-41. Makinouchi, A., 1996, “Sheet metal forming simulation in industry”,
Journal of Materials Processing Technology, vol. 60, pp. 19-26.
Nakazima, K., Kikuma, T. and Hasuka, K., 1969, “Study on the Formability of Steel Sheets”, Yamata Review.
Sampaio, A. P., Martins, C. A. and Souza, P. C., 1998, “Caracterização da conformabilidade de aço livre de intersticiais – IF – produzido via recozimento em caixa na companhia siderúrgica nacional”, I Conferência Nacional de Conformação de Chapas, Porto Alegre, Brasil, pp. 89-100.
Woodthorpe, J. and Pearce, R., 1969, “The effect of r and n upon the forming limit diagrams of sheet steel”, Sheet Metal Industries; pp. 1061-1067.