UNIVERSIDADE TÉCNICA DE LISBOA
F
ACULDADE DE
M
OTRICIDADE
H
UMANA
Predictors and Methological Issues in Tracking Total Body
Fat Mass, Trunk Fat, Mass and Abdominal Fat Mass
Changes in a Weight Loss Intervention with Overweight and
Obese Women
Dissertação apresentada com vista à obtenção do grau de Doutor no
Ramo de Motricidade Humana, Especialidade de Saúde e Condição Física
Orientador:
Doutor Luís Fernando Cordeiro Bettencourt Sardinha, Professor Catedrático da Faculdade de Motricidade Humana
Júri:
Presidente
Reitor da Universidade Técnica de Lisboa
Vogais
Doutor José Alberto Ramos Duarte, Professor Catedrático da Faculdade de Desporto da Universidade do Porto
Doutor Davide Maurício Costa Carvalho, Professor Associado da Faculdade de Medicina da Universidade do Porto
Doutor José Henriques Fuentes Gomes Pereira, Professor Catedrático da Faculdade de Motricidade Humana da Universidade Técnica de Lisboa
Doutor Luís Fernando Cordeiro Bettencourt Sardinha, Professor Catedrático da Faculdade de Motricidade Humana
Doutora Maria Isabel Caldas Januário Fragoso, Professora Associada da Faculdade de Motricidade Humana da Universidade Técnica de Lisboa
Teresa Cristina Lourenço Branco
Março 2012
CONTENTS
__________________________________________________
Abbreviations...3
Chapter 1 – General Introduction...5
Introduction...6
Human Adiposity
Anatomy and typology of body fat...8
Human Body Fat and Health
Total body fat and health...15
Abdominal body fat and health...21
Physical Activity and Human Body
Physical activity and total body fat...31
Physical activity and abdominal body fat...40
Human Body Composition Methodology...44
Dual energy X-Ray absorptiometry...45
Accuracy of dual energy X-Ray absorptiometry...47
Reliability of dual energy X-Ray absorptiometry...51
Regional estimations by dual energy X-Ray absorptiometry...52
Anthropometry...55
Accuracy of anthropometry...64
Reliability of anthropometry...65
Human Body Composition Methodology – Conclusion...67
References...69
Chapter 2 – Methods...91
Sample...92
Intervention...93
Body Composition Measurements...94
Statistical Analysis...97
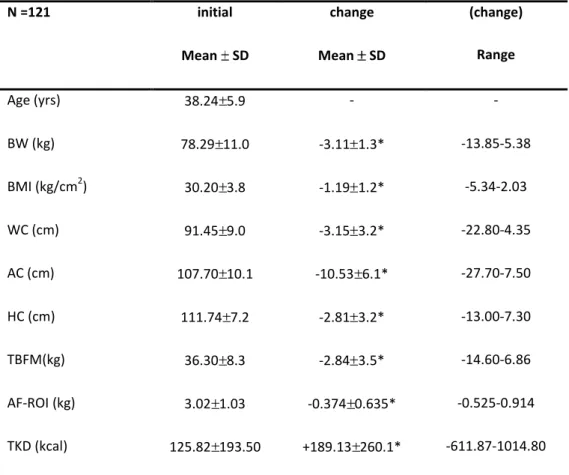
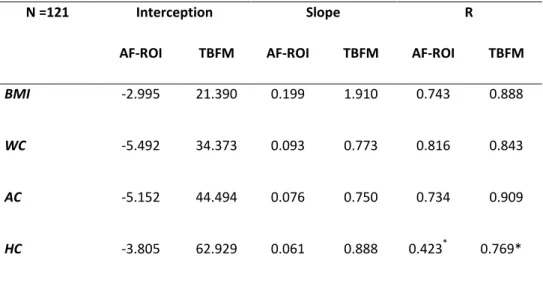
Chapter 3 – What baseline anthropometric measurements predict changes in total body,
trunk, and abdominal fat mass with DXA and morphologic markers?
...100
Abstract ...101
Introduction... 102
Methods………...103
Results...107
Discussion...111
Conclusion...115
References...116
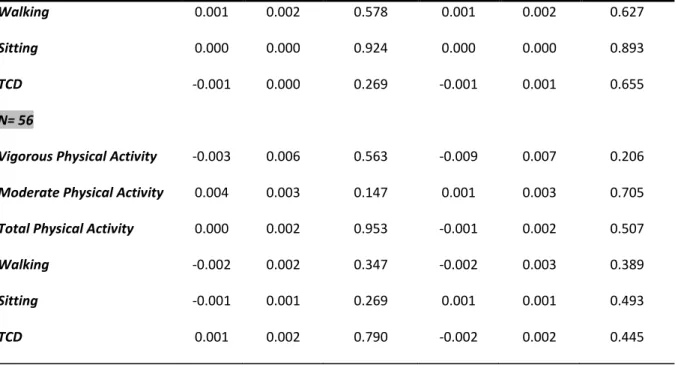
Chapter 4 – The association between type and intensity of physical activity and
changes in total and abdominal fat mass during weight reduction in overweight
and obese women………..………...119
Abstract…...120
Introduction………...121
Methods………...122
Results………...128
Discussion………...131
Conclusion……...135
References………...137
Chapter 5 – Usefulness of anthropometric measurements in predicting
DXA-based measures of adiposity in a weight loss intervention...140
Abstract…...141
Introduction………...142
Methods………...143
Results………...148
Discussion………...151
Conclusion……...154
References………...155
Chapter 6 – General Discussion ...157
References…...167
Chapter 7 – Summary ...170
ABBREVIATIONS
______________________________________________________
AC - Abdominal circumference
ACC - Abdominal circumference change
AF-ROI - Abdominal fat region of interest (region of interest between L2-L4,
excluding lateral subcutaneous fat)
AF-ROIC - Abdominal fat region of interest change
AT - Adipose tissue
BMC – Bone mineral content
BMD – Bone mineral density
BMI - Body mass index
BW - Body weight
BWC - Body weight change
CHD – Cardiac heart disease
CKD - Chronic kidney disease
CT - Computed tomography
CV - Coefficients of variation
%CV - Coefficients of variations
DLW - Doubly labeled water
DXA - Dual energy x-ray absorptiometry
EI - Energy intake
FFAs – Free fatty acids
FFM - Fat-free mass
FM - Fat mass
%FM – Percent fat mass
HC - Hip circumference
HCC - Hip circumference change
ICC - Intraclass coefficient of correlation
IDF - International Diabetes Federation
IPAQ - International physical activity questionnaire
LPL - Lipoprotein lipase
LPTA - Leisure-time physical activity
MPA - Moderate physical activity
MPAC - Moderate physical activity change
MRI - Magnetic resonance imaging
PCOS - Polycystic ovary syndrome
REE - Resting energy expenditure
R - Reliability coefficients
SEE – Standard error of measurement
SD – Standard deviation
SD - Sagital diameter
SDC - Sagital diameter change
SIT - Total minutes sit
SITC - Total minutes sit change
TBFM - Total body fat mass
TF-ROI - Trunk fat region of interest
TEM - Technical error of measurement
TBFMC - Total body fat mass change
TF-ROIC - Trunk fat region of interest change
TPA - Total physical activity
TKD -Total calories spent per day
TKDC -Total calories spent per day change
TPAC - Total physical activity change
VPA - Vigorous physical activity
VPAC - Vigorous physical activity change
WAT - White adipose tissue
WC - Waist circumference
WCC - Waist circumference change
WHR – Waist to hip ratio
WK - Total minutes walking
CHAPTER 1
______________________________________________________
General Introduction
______________________________________________________
Obesity is a major public health problem among developed and less developed countries. Obesity has been shown to be associated with chronic diseases and health conditions such as heart disease, diabetes, cancer, hypertension, and hiperlipidemia (1-3). The risk associated with obesity is becoming a global health hazard. Until 1999 it was estimated that approximately 64.5% of USA adults over the age of 18y have a body mass index (BMI) ≥ 25kg.m-2, with approximately 34.5% having a BMI ≥ 30 kg.m-2 (4). Between 1999-2000 and
2007-2008,there was an increase of 4.7 percentage points (95% CI, 0.5 to 9.0) for men and a nonsignificant increase of 2.1 percentage points (95% CI, –2.1 to 6.3) for women (5). Abdominal obesity increased in women (6). The increasing prevalence of overweight and obesity has resulted in an estimated expenditure of billions of dollars per year, to treat obesity-related conditions, being this a great part of the healthcare charges (7).
The prevalence of obesity in Europe has significantly increased over the past several decades, a phenomenon that is corroborated by data from several other industrialize countries outside Europe. In the mid-1980s, 15% of the male and 17% of the female population in Europe had a BMI ≥ 30 kg/m2 (8), meaning that the rate of obesity has increased by approximately 30% over the past 10 to15 years (9).
In Portugal, the overall overweight/obesity prevalence increased from 49.6% (in 1995–1998) to 53.6% (in 2003–2005) (10). These data suggest that, although obesity was identified as a public health problem a decade ago, actions that may have been taken to reduce it do not seem to have been very effective. Well-defined public health intervention must target specific population groups where higher levels of obesity prevalence were found: low socioeconomic
level groups and low-education level groups (10). Recently the Portuguese Physical Activity Registry concluded that physical activity must be considered a health promotion issue. The same registry also concluded, based on the data colleted, that physical activity may increase as a result of different levels of decision and cooperation of several society departments (11), promoving the reduction of obesity prevalence.
The general purpose of this thesis was to analyse the usefulness of simple anthropometric measurements in predicting weight loss and their sensibility to fat mass changes, particularly abdominal and trunk fat mass changes, and the effects of physical activity on fat mass loss. The thesis begins with a general introduction (Chapter 1) in which we review human body composition’s literature related with weight loss and health conditions, as well as exercise recommendations for obesity treatment. Then will be described the usefulness of body composition analysis in issues related with weight loss and the effect of exercise on obesity treatment.
Chapter 2 includes a detailed description of the methodology used in the present thesis. Chapters 3, 4, and 5 present the original research contributions. In Chapter 3 was addressed
the utility of simple pre-treatment anthropometric measurements to predict body composition changes that occur after body weight change. In Chapter 4 was analyzed the effect of different types and intensities of physical activity in body composition, preferentially in abdominal fat region of interest after a weight loss intervention program. The ability of simple anthropometric measurements to detect changes in abdominal fat region of interest and total body fat mass during weight loss in overweight and obese women was analyzed in Chapter 5. Based on this original scientific research, Chapter 6 discusses these findings within the scope of the areas of anthropometric measurements and their ability to predict total body fat mass and central fat mass loss, and the association of physical activity with body composition changes. Finally, in Chapter 7 is presented a summary of the main findings of this thesis.
Human Adiposity
Anatomy and typology of body fat
Adipose tissue is not a single homogeneous compartment, but rather a tissue with specific regional depots with varying biological functions (12, 13). Moreover, individual adipose tissue compartments have stronger associations with physiological and pathological processes than does total adipose tissue mass (14-17). According to the five-level body composition model, adipose tissue and fat are different components, and their taxonomic separation is important when measuring their mass and metabolic characteristics (18). In the past, adipose tissue has been considered a passive storage energy depot that serves as a long-term reservoir for fuel stored as triglyceride. However, laboratory, clinical, and epidemiological studies over the past decade have redefined and greatly expanded our understanding of the physiological role of adipose tissue (19). We now appreciate that adipose tissue is an endocrine organ with important roles in maintaining whole-body energy homeostasis. For example, when body fat is in excess, especially as visceral adipose tissue, it “leaks” fatty acids into the blood. Those fatty acids may accumulate in the liver and muscle promoting insulin resistance (20).
Adipose tissue contains ~80% fat; the remaining ~20% is water, protein, and minerals (21). Typically, adipose tissue is a specialized loose connective tissue that is extensively laden with adipocytes. The cellular content of adipose tissue is approximately 50% adipocytes, with the remaining 50% being the stromal vasculature fraction of fibroblasts, endothelial cells, macrophages and preadipocytes. In the past, it has been
suggested that the number of human adipocytes were fixed early in life and that a “fixed adipocyte-number “predestined individuals to be lean or obese. However, this is no longer thought to be true (22). Not only does adipocyte hypertrophy occur in humans (23-25), but the
recruitment and the proliferation of preadipocytes is also thought to occur in adult humans (23, 24, 26-28). Adipogenesis is, therefore, an important physiologic process whose function or dysfunction may prevent or promote metabolic disease (29-31). During positive caloric balance, increases storage of energy optimally occurs through the generation of added, functional cells, achieved through adipogenesis from preadipocytes (32). If adipogenesis is impaired after initial adipocyte hypertrophy, then further adipocyte hypertrophy may result in adipocyte dysfunction (31, 33). Some have even suggested (24, 34-36) that an increase in fat cell size might be viewed as failure of adipocytes to adequately proliferate. This may have pathological consequences. It has been known at least since 1970s that during times of positive caloric balance, excessive fat cell enlargement results in adipocyte metabolic and immune abnormalities (37, 38). During times of positive caloric balance, if energy is stored predominantly through lipogenesis and fat cell hypertrophy of existing adipocytes, as opposed to adipogenesis with recruitment and differentiation of new fat cells and fat cells hyperplasia, then this may lead to pathologic adipose tissue responses that contribute to metabolic disease (24, 26, 27, 36, 39-44). However, it is not hypertrophy of individual fat cells alone that has potential adverse clinical consequences. Excessive extension of the adipose tissue organ itself may also contribute to pathogenic processes.
White adipose tissue (WAT) is the common fat found in the enlargement of buttocks and protruding bellies (45). Brown adipose tissue is not nearly as fat as white adipose tissue as its main function is to burn fatty acids for nonshivering heat generation (46). Human babies have this type adipose tissue and it may help to keep them warm. It disappears, however, with age and it is mostly gone by adulthood (47).
As proposed by Shen (48), total body adipose tissue is defined as the sum of adipose tissue, usually excluding bone marrow and adipose tissue in the head, hands, and feet, can be first divided into two main measurable components, subcutaneous and internal adipose tissue.
Subcutaneous adipose tissue is well defined and has clear anatomic demarcations - the layer found between the dermis and the aponeuroses and fasciae of muscles, includes mammary adipose tissue (48). Subcutaneous adipose tissue is divided into two components, the superficial subcutaneous adipose tissue (the layer found between the skin and a fascial plane in the lower trunk and gluteal-thigh area) and the deep subcutaneous adipose tissue, defined as the layer found between the muscle fascia and a fascial plane in the lower trunk and gluteal-thigh areas (48).
Internal adipose tissue is divided into visceral and nonvisceral components. Internal adipose tissue is the total adipose tissue minus subcutaneous ectopic adipose tissue (48). Visceral adipose tissue (adipose tissue within the chest, abdomen, and pelvis) is divided into intrathoracic adipose tissue (intrapericardial and extrapericardial) and intraabdominopelvic adipose tissue. Intraabdominopelvic adipose tissue is divided into intraperitoneal ( e.g. omental and mesenteric) and extraperitonial adipose tissue, which is divided into intraabdominal and intrapelvic adipose tissue. Intraabdominal adipose tissue is divided into preperitoneal and retroperitoneal (e.g., perirenal, pararenal, periaortic, and peripancreatic) adipose tissue. Intrapelvic adipose tissue is divided into parametrial, retropubic, paravesical, retrouterine, pararectal and retrorectal adipose tissue (48).
Nonvisceral internal adipose tissue (internal adipose tissue minus visceral adipose tissue) is divided into intramuscular adipose tissue (adipose tissue within a muscle) and perimuscular adipose tissue (adipose tissue inside the muscle fascia, excluding intramuscular adipose tissue). Perimuscular adipose tissue is divided into intermuscular adipose tissue (adipose tissue between muscles) and paraosseal adipose tissue (adipose tissue in the interface between muscle and bone). There are other nonvisceral adipose tissue as, orbital adipose tissue and aberrant adipose tissue associated with pathological conditions (e.g., lipoma).
Dual-energy absorptiometry (DXA) has the potential to provide overall and regional assessment of body composition in terms of fat, lean mass and bone. DXA quantifies fat, rather than adipose tissue. According to the 5-level body-compositionclassification system (18), fat is
a molecular-level componentand adipose tissue is a tissue-level component. Eighty percentof
adipose tissue is composed of fat (48). As it measures two-dimensionally, DXA cannot differentiate between visceral and subcutaneous fat directly. In spite of this limitation, DXA has been used to estimate abdominal fat mass by using the standard trunk region or by manually defining a subregion at the abdomen. These subregions correlate strongly with visceral fat and it is assumed that the between-and within-examiner variation is smaller (49, 50).
Simple anthropometric measurements are often used as indirect measurements of abdominal fat. The most widely used is waist circumference (WC), but this indirect measurement cannot differentiate between visceral fat and subcutaneous fat, but it is more strongly correlated with visceral fat than subcutaneous fat and can therefore be used as a marker for visceral fat (51). However, several studies found that these correlations are weaker in obese or older subjects (52-54). In addition, anthropometric measurements cannot differentiate between bone, fat, and lean mass. In our study abdominal fat mass assessed by DXA (determined by a region of interest) will be predicted by anthropometric measurements.
Absolute and relative visceral adipose tissues have been associated with the greatest health risk (55, 56). It is more sensitive to catecholamines (epinephrine, norepinehrine), thus is more stimulated for lipolysis (57). At the same time, visceral adipose tissue is also less responsive to insulin, making it easier to turn on lipolysis and harder to shut it off (58). Subcutaneous adipose tissue seems to be used more for long-term storage of fatty acids incorporated into triglycerides (59). It is less sensitive to the signals that promote lipolysis and more sensitive to signals, such as insulin, that opposes lipolysis (60). This type of adipose tissue tends to be found in the buttocks and extremities as well as around the belly (59).
The 70-kg Reference Man has 15 kg of adipose tissue, representing 21% of body fat mass (21). The percentage is higher in women, the elderly, and overweight subjects. Adipose tissue is anatomically distributed throughout the human body, and the pattern of adipose tissue distribution is influenced by many factors, including sex, age, genotype, diet, physical activity level, hormones, and drugs (61-65). In contrast to adipose tissue, the molecular level or chemical component of fat is usually lipid in the form of triglycerides (18). Although fat is found primarily in adipose tissue, fat also exists in other tissues, especially in pathological conditions such as hepatic steatosis and various forms of lipidosis. The total mass of the two compartments in adults is similar, but not identical (49, 66-69).
Catecholamines promote proliferation and impair differentiation (70). Glucocorticoids impair proliferation and promote differentiation (71, 72). Finally, epidermal growth factor impairs proliferation and promote differentiation (73). This has practical, clinical implications in that glucocorticoids increase the differentiation of existing adipocytes (especially visceral adipocytes) relative to subcutaneous, peripheral adipocytes, while decreasing adipocyte proliferation. The resulting hypertrophy of visceral adipocytes, coupled with a decrease in the recruitment of functional subcutaneous, peripheral adipocytes, is a contributing cause of the T2DM, hypertension and dyslipidemia often found with hypercortisolemia (70, 72) .
Apart from species differences, the development of adipose tissue varies according to sex and age. Moreover, it has been known that the ability of humans to increase the number of adipocytes depends on the nature of the diet and the localization of the adipose, depots (74). Beside environmental considerations, adipose tissue is also dependent upon genetic predisposition. In Pima Indians there a high predisposition to have hypertrophic, bloated, pathogenic adipocytes, as opposed to smaller, leaner and more functional fat cells (75), a high concentration of fasting plasma non-esterified fatty acids is a risk factor for development of NIDDM.
Lipid mobilization and the release of free fatty acids (FFA) and glycerol are modulated by the sympathetic nervous system. Catecholamines are the most potent regulators of lypolysis in human adipocytes through stimulatory β1 and β2 adrenoreceptors or inhibitory α2 adrenoreceptors (76). A gene that codes for a third stimulatory β adrenoreceptor, β3 adrenoreceptor, is functionally active principally in omental adipocytes (77) but also present in mammary fat and subcutaneous fat in vivo (78). The main systems involved in the inhibitory control of lipolysis are insulin/insulin receptor and adenosine/adenosine receptor (79). Regional differences in catecholamine-induced lipolysis and sensitivity to insulin`s antilipolytic effects have been extensively described in vitro studies. In both genders and independently of the degree of obesity, femoral and gluteal fat cells exhibit a lower lipolytic response to catecholamines than subcutaneous abdominal adipocytes, the latter showing both increased β1 and β2 adrenoreceptor density and sensitivity and reduced α2 adrenoreceptor affinity and number (79, 80). Abdominal visceral adipocytes, compared with subcutaneous abdominal or femoral adipose cells, are more sensitive to catecholamine-induced lipolysis, equally (or slightly less) sensitive to both α2 and adenosine receptor-dependent inhibition of lipolysis, and less sensitive to insulin`s antilipolytic effects (79).
Exercise is an excellent physiological challenge to promote sympathetic nervous system (SNS) activation; there is no doubt that it contributes to the control of lipid mobilization during exercise. Increased catecholamine levels, promoted by exercise, stimulate both fat cell β1-2-
and α2-adrenergic receptors (ARs) which stimulate and inhibit lipolysis, respectively (81, 82).
Recently, Glisezinski and co-authors (83) revealed that it is plasma adrenaline rather than noradrenaline that is the main adrenergic factor that contributes to the control of exercise-induced lipid mobilization in subcutaneous adipose tissue.
Apart from receptor distribution, it is also likely that regional differences in adipose tissue growth may result from differences in the cells’ local environment. A better blood supply may
provide higher levels of humoral factors that are involved in the regulation of adipose tissue growth, and also more substrates for lipid accumulation.
Many studies have been dealing with changes of adipose tissue cellularity throughout life (84-86). Based on such observations, it was early established that there are sensitive periods in adipose tissue development during childhood. Two peaks for accelerated adipose tissue growth were reported: one after birth and the other between 9 and 13 years (87).
Only sparse data are available on site-specific differences in adipose tissue cellularity and growth, in humans. They indicate that intraabdominal fat cells are smaller than subcutaneous cells, while published results on fat cell’s size variations among subcutaneous depots are inconclusive or found to be influenced by many factors, such as age, hormonal status, diet, and others (88). It seems that the age- related increases in fat cell size was particularly obvious in the abdominal depot.
Visceral adipose tissue is more harmful to health (89, 90), since it is more sensitive to catecholamines (epinephrine, norepinephrine) it is more easily stimulated for lipolysis (20). Visceral adipose tissue, found more frequently in post-menopausal women, subcutaneous (or peripheral body fat) is common problem for pre-menopausal women (91). After menopause, women may become more expose to visceral adiposity than before (91, 92).
Human Body Fat and Health Total body fat and health
Beyond the conspicuous presence of excess body fat, many of these disease processes are relatively silent, that is, many individuals with this body type feel fine, with no symptoms of any disease. Most experts agree that overweight people are approaching a state of serious disease, where those in the obese range have arrived (93).
BMI is a widely used, inexpensive method for assessingbody fatness, but it can be inaccurate. However, BMI is positively associated with morbidity (94, 95) and has a U- or J-shaped relationship with mortality (96-98). It is commonly held that a high BMI is associated with increased health risk or mortality because of its association with adiposity. Indeed, within a given population, BMI is positively associated with adiposity (99-101). It is noteworthy, however, that this relationship is altered by numerous factors such as age (102), gender (102), race (103), and physical activity patterns (104). For example, smokers frequently weigh less than non-smokers (105) and this can contribute to distortions in studies (106, 107). Whether it is smoking alone or the associated lower weight that contributes to the increased risk, remains open (107).
Obesity triggers a plethora of metabolic disturbances, including insulin resistance, hyperglycemia, hypertriglyceridemia, and reduced levels of high-density lipoprotein (HDL) cholesterol, together referred to as the metabolic syndrome (108). In addition, increasing evidence suggested ethnic differences with respect to the effects of obesity on risk of metabolic diseases, especially type 2 diabetes. Another area of growing interest is the impact of obesity on complications of the metabolic syndrome, including gallstones, gout, polycystic ovary syndrome (PCOS), chronic kidney disease (CKD), and sleep apenea.
Gerald Reaven used the term “Syndrome X” to describe the close interrelationships
among obesity, hyperinsulinemia, glucose intolerance, and dyslipidemia (109). In 1989,
Kaplan (110) used the term “deadly quartet” to describe the clustering of upper body
obesity, hypertriglyceridemia, glucose intolerance, and hypertension. In 1998, the
World Health Organization (WHO) coined the phrase “metabolic syndrome” and
defined it as insulin resistance and/or impaired glucose regulation with at least two of
the following conditions: dyslipidemia (elevated triglycerides or low HDL); high blood
pressure; obesity (high waist-to-hip ratio - WHR- or body mass index - BMI ); or
microalbuminuria (111). In 2001, the Third Report of the Expert Panel on Detection,
Evaluation, and Treatment of High Blood Cholesterol in Adults (Adult Treatment Panel
III – ATP ) (112) defined the metabolic syndrome as three or more of the following:
abdominal obesity (waist circumference > 102 cm in men and > 88 cm in women);
hypertriglyceridemia ( 150≥ mg/dL or 1.69 mmol/L); low HDL cholesterol (<40 mg/dL
or 1.04 mmol/L in men and <50 mg/dL or 1.29 mmol/L in women); high blood
pressure (≥130/85 mm Hg); and high fasting glucose (≥110 mg/dL or 6.1 mmol/L). In
2002, using data from NHANES III, Ford et al. (113) estimated that approximately one
quarter of U.S. adults (or 47 million people) have the metabolic syndrome. In 2009,
based on the NCEP/ATP III guidelines, Bethene (114) estimated that a little more than
one-third of the adults in the United States could be characterized as having metabolic
syndrome. The author concluded that metabolic syndrome increased with age but
increased even more dramatically as BMI increased. The prevalence of metabolic
syndrome varied by race and ethnicity but the pattern was different for males and
females. Non-Hispanic black males were less likely than non-Hispanic white males to
have metabolic syndrome but non-Hispanic black and Mexican-American females were
more likely than non-Hispanic white females to have it. Among the five diagnostic
criteria for metabolic syndrome abdominal obesity, hypertension, and hyperglycemia
were the most prevalent (114).
In 2005, the International Diabetes Federation (IDF) proposed another definition of metabolic syndrome – central obesity plus any two of the following conditions: hypertension, hypertriglyceridemia, reduced HDL cholesterol, or impaired fasting glucose (115). The IDF definition included gender – and ethnic-specific cut-points for central obesity measured by WC, but justifications for these cut-points remain controversial.
Although the various descriptions of metabolic syndrome differ somewhat, they all include a similar cluster of metabolic disorders and central obesity. Most notably, they all include that the co-occurrence of obesity, hypertension, high cholesterol, and insulin resistance is not due to chance alone, but rather, to a common underlying process (116).
The metabolic syndrome has provided a useful theoretical framework for studying the biological basis for the clustering of obesity and multiple metabolic disorders. Insulin resistance is often considered the common link between obesity and metabolic risk factors (117). However, there is a recent recognition that chronic inflammation by adipocyte-secreted cytokines may be the underlying pathophysiology in the development of insulin resistance and the metabolic syndrome. For this reason, the metabolic syndrome has also been called “the inflammatory syndrome” (118).
Although mechanisms linking obesity to elevated risk of individual components of the syndrome are not yet fully understood, evidence suggests that specific hormones, cytokines, and FFAs secreted by adipose tissue play crucial roles. Demonstration of crosstalk between adipose tissue and other insulin target tissues (e.g. skeletal muscle and liver), has greatly advance our understanding of the link between obesity and insulin resistance (119, 120). The problem in insulin-resistant states is that gluconeogenesis is not shut down and lipolysis, especially of visceral adipose tissue, is not suppressed. That is, the liver is making too much glucose and the visceral adipose tissue is releasing too many fatty acids flowing directly to the liver. Increasing glucose stimulates the pancreas to produce more and more insulin, and the vicious cycle known as insulin resistance begins. Normal mechanisms of regulation of insulin secretion are lost, and tissue response even to excess insulin is abnormal. The result is an ever increasing blood glucose concentration that stimulates more insulin secretion.
FFAs, the primary oxidative fuel for several tissues including liver and resting skeletal muscle, also play an important role in insulin resistance (121, 122). Excess body fat can lead to fatty
acid spillover from adipose to nondipose tissue, causing peripheral insulin resistance and abnormal glucose metabolism (119, 120, 122).
The relationship between obesity and hypertension is well established. Even within lean populations in developing countries, individuals with greater body mass have substantially elevated blood pressure and higher rates of hypertension (123, 124). Overweight and obesity are the most important modifiable risk factor for hypertension, accounting for more than 66% of the risk in some populations (125). In the Nurses`s Health Study (NHS), multivariate analysis showed that BMI values at 18 years of age and midlife were both significantly associated with hypertension (126). There was a significant association between long-term weight loss after 18 years of age and a decreased risk of hypertension, while weight gain after 18 years dramatically increased the risk.
Dyslipidemia is one of the most common metabolic disorders associated with obesity. In many studies, indices of body size and adiposity – including BMI, WHR, subscapular skinfolds, and percent body fat – are strongly correlated with hypertriglyceridemia, hypercholesterolemia, and low HDL cholesterol. Low HDL cholesterol, high triglycerides, and small dense LDL are among the most common features of dyslipidemia related to the metabolic syndrome (127, 128).
Among all lifestyle risk factors for type 2 diabetes overweight and obesity are the most important. Weight gain during adulthood, even at modest levels (e.g., 10 kg), has been associated with increased risk of diabetes. In the NHS (129), compared with those whose weight remained stable (a gain or loss of ≤5 kg between the age of 18 and the baseline in 1976), the RRs for diabetes were: 1.9 (95% CI: 1.5 to 2.3) for women with a weight gain of 5.0 to 7.9 kg; 2.7 (95% CI: 2.1 to 3.3 ) for a weight gain of 8.0 to 10.9 kg; and 12.3 (95% CI: 10.9 to 13.8) for an increase of 20.0 kg or more. In contrast, women who lost more than 5.0 kg reduced their risk for diabetes by 50% or more. Some findings suggest that a reduced insulin
sensitivity, which may be caused by both genetic and environmental factors, underlies the increased risk of type 2 diabestes in U.S. minorities, particularly Asians (130).
The association of overweight and obesity with noncancer outcomes is generally stronger than the association with all cancer or specific cancer sites. However, the International Agency for Research on Cancer (IARC) Working Group on the Evaluation of Cancer-Preventive Strategies published a comprehensive evaluation of the available literature on weight and cancer that considered epidemiologic, clinical, and experimental data (131). Their 2002 report concluded that there is “sufficient evidence” in humans for a cancer-preventive effect of avoidance of weight gain for cancers of the endometrium, female breast (postmenopausal), colon, kidney (renal cell), and esophagus (adenocercinoma) (131). Recent studies of the impact of weight loss on breast cancer (132, 133), endometrial cancer (134, 135) and prostate cancer (136) suggest that weight loss over the course of adult life may substantially reduce the risk for several cancers (137).
In summary, although the clustering of obesity-related abnormalities has long been recognized, clinical definitions of the metabolic syndrome have only recently been formalized. Despite controversies regarding the precise definition of the syndrome, there is a consensus that excess adiposity, especially central obesity is the driving force behind the metabolic syndrome. Insulin resistance is widely considered the unifying mechanism for obesity-related disorders, but proinflammatory cytokines secreted by adipose tissue also appear to play an important role in causing insulin resistance and inducing a cascade of metabolic disturbances. Excess adiposity is the single most important factor in the development of various metabolic disorders, in particular, hypertension and type 2 diabetes. Numerous epidemiologic studies have shown that BMI and fat distribution independently predict various metabolic disorders. Weight gain has also been identified as powerful predictor of virtually all metabolic conditions,
and there solid evidence that some ethnic groups, especially Asians, are more susceptible to the adverse effects of excess adiposity.
Some evidence also suggest that increasing waist circumference during adulthood is a risk factor for incidence diabetes independent of weight gain {Willett, 1999 #87} as developed in the next sub-chapter. Therefore, it is important to monitor measures of both overall and regional adiposity, such as body weight and waist circumference, in assessing metabolic risk associated with obesity.
Abdominal body fat and health
Currently, the location of the excess adipose tissue in the patient’s body is one of the main topics of investigation. Thus, different neuroendrocrine responses to stress (139-141), different effects of gonadal and adrenal steroids on metabolism in various adipose tissue depots (140, 142-145) as well as genetic variations in tissue sensitivity (139, 146) have been suggested. All these mechanisms may contribute to the variation in regional fat distribution. Clinically, it is important to understand if patients have a “pear” shape or an “apple” shape (147-149). In moderate obesity, regional distribution appears to be an important indicator for metabolic and cardiovascular alterations since an inconstant correlation between BMI and these disturbances has been found (150, 151). Over the last two decades, studies have reemphasized the notion put forward in 1947 by Vague (152) that obesity is not a homogeneous condition and that the regional distribution of adipose tissue is important to understanding the relation of obesity to disturbances in glucose and lipid metabolism (80). Many prospective studies have shown that excess fat in the upper part of the body (i.e., central or abdominal), considered by Vague (152) as android or “male-type”, more often correlates with increases mortality and risk for disorders such as diabetes, hyperlipidemia,
hypertension, and atherosclerosis of coronary, cerebral, and peripheral vessels more often than “gynoid” (lower body or gluteo-femoral or peripheral depot) female-type of fat distribution (151, 153-156). However, in these studies, the body fat distribution was assessed using anthropometric measurements such as skinfolds and WHR, particularly the latter. Although WHR is simple and convenient for epidemiological studies, and provide a useful estimation of the proportion of abdominal or upper-body fat (157, 158), it does not distinguish between accumulations of deep abdominal (visceral) fat and subcutaneous abdominal fat. The correlations of abdominal visceral fat mass by CT or MRI scans with total body fat range from 0.4 to 0.8, with higher values obtained when a large range of fatness, from lean to obese, is present in the population (159-162). They tend to be lower in the lean and normal weight subjects than in obese (161). As indicated by Bouchard et al. (80) it is important to recognize that individual differences in abdominal visceral fat remains considerable even when subjects with relatively similar BMI and percent body fat are investigated. We may conclude that the assessment of cardiovascular risk in obese patients solely from the measurement of body weight or total body fatness may be completely misleading (163-165). Most “metabolic obese” normal-weight subjects have some increase in adipose tissue mass and insulin resistance probably due to an increase in visceral fat (166). Thus, subjects with a relatively low BMI, such as “metabolic obese” normal-weight individuals, can have gross increases in abdominal visceral fat (167, 168), and others with a high BMI may have very little intraabdominal fat (163).
For Neil Ruderman (166), it has become apparent that a number of interrelated factors are often associated with and may contribute to the pathogenesis of hyperinsulinemia and insulin resistance in both normal-weight and obese individuals. They include central obesity, low birth weight, inactivity, and family history. Apart from their pathophysiological role, the presence of these factors may also be of value in identifying metabolically obese, normal- weight
individuals. The correlation between BMI and central obesity can vary considerably from one individual to another.
A striking example of how insulin resistance correlates with the amount of visceral fat in these circumstances are the sumo wrestlers of Japan. As demonstrated by Matsuzawa (169), sumo wrestlers, though generally quite obese, have small amounts of visceral fat (but a very large abdominal subcutaneous fat layer) and are quite insulin sensitive. In contrast, retired sumo wrestlers have large amounts of visceral fat, and they are insulin resistant and have a very high prevalence of type 2 diabetes and cardiovascular disease. Different levels of physical activity in the active and retired groups could have contributed to these findings; however, similar correlations have been described in other studies in which exercise was probably not a confounding factor (165).
Intraabdominal fat is associated with an increase in energy intake but is not an absolute requirement. Positive energy balance is a strong determinant of truncal-abdominal fat as shown by Bouchard and colleagues (170) overfeeding experiments in identical twins. The correlations between gains in body weight or total fat mass with those in subcutaneous fat on the trunk reached about 0.7 in their 100-day overfeeding study in 12 pairs of male identical twins. In contrast, these correlations attained only 0.3 with the gains in abdominal visceral fat, corresponding to a common variance of less 10% (80, 170). Thus, positive energy balance does not appear to be a strong determinant of abdominal visceral fat as is the case with other body fat phenotypes (80).
The increase of visceral fat masses with increasing total body may be explained by an increase of fat cell size only up to a certain adipocyte weight (171). However, with further enlargement of intraabdominal fat masses with severe obesity, the number of adipocytes seems to be elevated (172, 173).
The amount of visceral fat increases with age in both genders, and this increase is present in normal weight (BMI, 18.5 to 24.9 kg/m2) as well as in overweight (BMI, 25 to 29.9 kg/m2) and obese subjects (BMI > 30 kg/m2) but more so in men than in women (80, 174, 175). In a study of 130 subjects (62 males and 68 females with a wide range of age and weight), Enzi et al. (175) found that in young females, either lean or obese, the subcutaneous abdominal fat area was predominant over abdominal visceral fat, both measured by CT at the upper renal pole. This fat topography was retained in young and middle-aged females up to about 60 yr of age, at which point there was a change to an android type of fat distribution. This age-related redistribution of fat is due to an absolute as well as relative increment in visceral fat depots, particularly in obese women, which could be related to an increase in androgenic activity in postmenopausal subjects.
From the published data (174, 175), it can be concluded that both subcutaneous and visceral abdominal fat increase with increasing weight in both sexes but while abdominal subcutaneous adipose tissue decreases after the age of 50 yr in obese men, it increases in women up to the age of 60-70 yr, at which point it starts to decline (71).
Several studies have shown that the detrimental influence of abdominal obesity on metabolic processes is mediated by intraabdominal fat depot. For example, the visceral fat area correlated with glucose intolerance on the presence of hyperinsulinemia during an oral glucose tolerance test, suggesting an insulin-resistant state (12, 165, 176). In addition, correlation analyses have shown that the effect of accumulation of deep abdominal fat on glucose tolerance was independent from total adiposity and subcutaneous abdominal adipose tissue and that association was observed between total adiposity and glucose tolerance after control for visceral fat area (12, 165). In their study of a wide range of total body fat in both healthy young (168) and middle-aged (177) men, Park and col. found that the intraabdominal fat area evaluated by CT was associated with a decreased in insulin sensitivity measured by an
euglycemic hyperinsulinemic glucose camp. In addition to being associated with disturbances in insulin-glucose homeostasis, abdominal obesity has been related to alterations in plasma lipoprotein-lipid levels (164, 178), particularly increased plasma trygliceride and low HDL cholesterol concentrations, as expected from the association of insulin resistance with disturbances in plasma lipid transport and lipoprotein levels (179, 180). Lemieux et al. (181) have indicated that the gender difference in visceral adipose tissue accumulation was an important factor in explaining the gender differences in cardiovascular risk profile. In addition, the adjustment for differences in visceral fat between men and women eliminated most of the sex differences in cardiovascular risk factors. There is evidence supporting the notion that abdominal visceral fat accumulation is an important correlate of the features of the insulin-resistant syndrome (178, 182) but this should not be interpreted as supporting the notion of a cause and effect relationship between these variables (79).
Although the cause-and-effect association has not been definitively established, the available evidence indicates that visceral fat is an important link between the many facets of the metabolic syndrome. However, because of the considerable metabolic heterogeneity still remaining among obese patients with similar levels of visceral adipose tissue, it was proposed that genetic susceptibility plays a major role in modulating the risk associated with a given excess of visceral adipose tissue (183). In this regard, visceral obesity should be considered a factor that exacerbates an individual genetic susceptibility to the components of the metabolic syndrome (184). While there is a consensus that visceral fat has a strong association with cardiovascular risk factors, particularly dyslipidemia and hyperinsulinemia (182), the primary importance of visceral adipose tissue vis-à-vis subcutaneous abdominal obesity with regard to insulin sensitivity of glucose metabolism has been challenged by Abate et al. (185) and Goodpaster et al. (1). These researchers found that abdominal subcutaneous fat, as determined by magnetic resonance imaging and CT, was at least as strong a correlate of insulin sensitivity (evaluated by euglycemic clamp) as visceral fat and retained independent
significance after adjusting for visceral fat (1). In addition, it has been emphasized that the endocrine abnormalities described in obesity, which involve steroid hormones, grow hormone, and insulin, may actually result in abdominal depot accumulation. This might cause the metabolic syndrome in the susceptible individual (60, 186).
Recently, a study with free of cardiovascular disease participants from the Framingham Heart Study (n=1155, mean age 63 years, 54.8% women) who were part of a multidetector computed tomography study underwent quantification of intrathoracic fat, pericardial fat, visceral abdominal fat, coronary artery calcification, and aortic artery calcification, showed that pericardial fat is correlated with multiple measures of adiposity and cardiovascular disease risk factors, but visceral fat mass is a stronger correlate of most metabolic risk factors (90).
Several epidemiologic studies have examined the relationship between overall adiposity, fat distribution, and endothelial function. In a cohort oh healthy women, Wexler et al. (187), found similar correlations between plasma concentrations of e-selectin with both BMI and WC. Adhesion molecules were significantly elevated in women with central obesity but low BMI, and markers of endothelial dysfunction appeared to largely mediate the relationship between central body fat, insulin resistance, and incident diabetes.
Studies have suggested that WC or WHR significantly predicts risk of hypertension independent of BMI (188, 189). In a cohort of Japanese Americans, visceral obesity measured by CT was a better predictor of incident hypertension than BMI or WC (190). There was no significant association between subcutaneous fat and hypertension.
In a review of 23 published studies of intervention strategies to promote loss of visceral adipose tissue, measured by magnetic resonance imaging or CT, Smith and Zachwieja (191) concluded that individuals with greater visceral fat mass, either through an increase in body weight or the propensity to store fat in the visceral depot, lose more visceral fat when adjusted
to the loss of body fat, regardless of the intervention applied (caloric restriction, pharmacological therapy, or exercise) because the visceral adipocyte has a higher lipolytic rate also in the steady state.
As previously indicated, visceral fat is more sensitive to weight reduction than subcutaneous adipose tissue because omental and mesenteric adipocytes, the major components of visceral abdominal fat, have been shown to be more metabolically active and sensitive to lipolysis (20). The adipose tissue build-up in the butt area is considered subcutaneous fat and it is harder to get free fatty acids released from this fat during fasting, whereas beer-belly fat is visceral fat, and it is readily available for easy build-up, breakdown, and release of FFA into the blood. Excess visceral fat, which is more sensitive to hormonal signals for fat breakdown, seems to be a constant source of fatty acids that build up in the blood (20). The vascular anatomy and the metabolic activity of visceral fat may be the key factors predisposing to complications of obesity (20).
Only visceral adipose tissue is drained by the portal venous system and has a direct connection with the liver. Mobilization of FFAs is more rapid from visceral than from subcutaneous fat cells because of the higher lipolytic activity in visceral adipocytes, in both nonobese and obese individuals, particularly in the latter, which probably contributes significantly to the FFAs levels in the systemic circulation (60). The visceral fat catecholamine-induced lipolysis is greater in obese men than in women; this is partially due to a large fat cell volume and also to a greater β3-and lower α2-adrenoreceptor sensitivity (192), which results in higher FFAs mobilization from visceral fat to the portal system in men than in women. On the other hand, the antilipolytic effect of insulin is reduced in omental adipocytes regardless of the presence of obesity. Thus, the enhanced total lipolytic activity probably contributes significantly to the FFAs levels in circulation (191).
Moreover, Goodpaster et al. (1) found that FFAs released by visceral adipose tissue were correlated with visceral fat mass, but relative amounts of FFAs derived from visceral adipose tissue lipolysis were much lower than those derived from subcutaneous adipose tissue. Visceral lipolysis accounts for only 5% to 10% of the portal vein FFAs in lean individuals and 20% to 25% of portal vein FFAs in obese individuals.
Together, current evidence suggested that both visceral fat and subcutaneous fat contributes to insulin resistance (193). Theoretically, visceral fat is more relevant to the development of insulin resistance, but the data on the relative importance of subcutaneous fat and visceral fat are conflicting (193). In epidemiologic studies, WC as a measure of abdominal or upper body obesity reflects the effects of both subcutaneous fat and visceral fat (194). Thus, in practice, distinction between these two fat locations may not be easy or essential.
The decrease in basal plasma FFAs an average of approximately 60% was associated with a reduction of approximately 50% of basal insulin levels and a decrease in basal glucose lower in the nondiabetics (~7%) but higher in the diabetics (~15%). This suggest that basal plasma FFAs exert a physiological important effect supporting up to one half of basal insulin levels in nondiabetic and diabetic subjects and that basal plasma FFAs are responsible for some of the hyperinsulinemia in normoglycemic obese subjects (195).
The problem in insulin-resistant states is that gluconeogenesis is not shut down and lipolysis, especially of visceral adipose tissue, is not suppressed. That is, the liver is making too much glucose and the visceral adipose tissue is releasing too many fatty acids flowing directly to the liver. Increasing glucose stimulates the pancreas to produce more and more insulin, and the vicious cycle known as insulin resistance begins. Normal mechanisms of regulation of insulin secretion are lost, and tissue response even to excess insulin is abnormal. The result is an ever increasing blood glucose concentration that stimulates more insulin secretion.
Lebovitz and Banerji (196) cited several lines of evidence supporting a causal relationship between the amount of visceral fat and insulin resistance. The first line of evidence, albeit inconsistent, suggests that in diverse populations, visceral fat is more strongly associated with insulin resistance than total or subcutaneous fat mass (197, 198). Second, Lemieux et al. (199) found that increases in visceral fat, but not total fat mass, predicted changes in glucose tolerance and insulin secretion in a cohort of women followed for 7 years. Third, Klein and colleagues reported that liposuction of abdominal subcutaneous adipose tissue did not appear to improve insulin action and cardiovascular risk factor in obese subjects (200). Lastly, treatment with peroxisome proliferator-activated receptor (PPAR) agonist (e.g., pioglitazone and rosiglitazone) led to a shift of fat distribution from visceral to subcutaneous adipose depots, and that shift was associated with improvements in hepatic and peripheral tissue sensitivity to insulin (201).
Conversely, several lines of evidence argue against the causal relationship between visceral fat and insulin resistance. Miles and Jensen (202) noted that differences in the amount of subcutaneous account for the most of the between-person variability in abdominal fat mass, while the relative content of visceral fat is similar between lean and obese individuals. In addition, some studies have shown similar correlations between subcutaneous fat and visceral fat and insulin resistance (1).
In women, but not in men, omental adipose tissue has smaller adipocytes and lower lipoprotein lipase (LPL) activity than subcutaneous fat depots since variations in LPL activity parallel differences in fat cell size (80). With progressive obesity, adipose tissue LPL is increased in the depots of fat in parallel with serum insulin. However, when obese subjects lost weight and became less hyperinsulinemic, adipose LPL increased further and the patients who were most obese showed the largest increase in LPL, suggesting that very obese patients are most likely to have abnormal LPL regulation, independent of the influence of insulin. This
probably indicates that adipose tissue LPL activity may represent an adipocyte “set point” that is intented to limit adipocyte shringkage induced by hypocaloric diet (79), suggesting a genetic regulation of LPL.
The hypothalamic-pituitary axis, particularly in visceral obesity, has been extensively evaluated, and the studies have shown that an increase in cortisol clearance (both absolute and body-weight corrected) results in a significant correlation with intraabdominal fat area, either expressed by WHR or obtained by CT. Thus, obese subjects with intraabdominal fat areas equal or greater than 107 cm2 with an increased cardiovascular risk profile presented as
expected, a significant higher cortisol clearance than the ones with areas lower than 107 cm2
(203). The ratio of visceral/subcutaneous fat areas presented a significant correlation with the volume of distribution of cortisol at steady state (203), probably related to the larger number of glucocorticoid receptors in adipocytes of the intraabdominal fat (145). There is the possibility that the increased number of glucocorticoid receptors could be responsible for a hypersensitivity of the intraabdominal fat adipocytes to cortisol, leading to accumulation of visceral adiposity.
Excess visceral fat mass seems to be so harmful that there are already some studies showing the relation between increased visceral adipose tissue and some types of cancer (204-206). It seems that visceral adipose tissue is an independent risk factor for colorectal neoplasm. However, further large scale studies are needed to clarify the causal relationship between these cancer type and abdominal accumulation of fat (207).
A recent systematic review suggests that central adiposity, rather than general adiposity, may be a predictor for premenopausal breast cancer (208). The same review suggests that central adiposity is not an independent predictor of postmenopausal breast cancer risk beyond the risk attributed to overweight alone (208).
In summary, recent studies have demonstrated that regional distribution of adipose tissue is critical in the clinical assessment of patients, particularly if they are obese. In effect, excess fat in the central (visceral abdominal) vs. peripheral part of the body (gluteofemoral) independent of overall obesity is associated with higher plasma glucose and insulin, hyperlipidemia, and decreased HDL cholesterol concentrations, components of the metabolic syndrome and constituting a cluster of risk factors for artherosclerotic cardiovascular disease, as shown in prospective studies.
Physical Activity and Human Body
Physical activity and total body fat
The role of physical activity in body weight regulation has long been recognized. It has been demonstrated that a reduction in body weight and an increase in physical activity may facilitate the management of body weight and reduce the risk and onset of obesity-related diseases (209).
Because primary prevention of weight gain is more effective than weight loss in reducing obesity rates (210), it is critical to understand the role of physical activity in reducing age-related weight gain. Most evidence on weight gain prevention is derived from epidemiologic studies (211). Cumulative evidence from prospective cohort studies and randomized clinical trials indicates that physical activity and active lifestyle play an important role in weight control, probably mediated through multiple pathways including increasing total energy expenditure (211), reducing fat mass (211), maintaining lean body mass (211) and basal metabolic rate (211), and increasing psychosocial well-being and thus compliance to physical activity regimens (211).
The secular decline in physical activity that coincides with increasing obesity rates has been observed in many societies. Ewing et al. (212) conducted an ecological analysis of the relationship between urban sprawl and physical activity and obesity using data from Behavioral Risk Factor Surveillance System - BRFSS (including 448 counties and 83 metropolitan areas). Residents of sprawling counties were likely to walk less during leisure time, weigth more, and have greater prevalence of hypertension than residents of compact counties. At the metropolitan level, sprawl was similarly associated with minutes walked (p = .04) but not with the other variables. This ecologic study reveals that urban form could be significantly associated with some forms of physical activity and some health outcomes.
In many studies, the cross-sectional associations between physical activity and obesity are substantially stronger than those in prospective studies. In a prospective study, Hill et al. (213) estimated that U.S. adults have been gaining an average of 0.45 to 0.90 kg/year over the past decades since the star of the obesity epidemic. In the past three decades, many prospective cohort studies have examined the relationship between physical activity and weight gain. For example, Lee and Phaffenbarger (214) concluded that participants in the Harvard Alumni Study who reported levels of physical activity consistent with approx 30 min of moderate-intensity physical activity had a lower body weight when compared with individuals reposting lower levels of physical activity.
At the individual level, numerous cross-sectional studies have examined the relationship between physical activity and obesity. Most have shown an association between higher levels of physical activity and lower body weight. In general, higher-intensity activity was more strongly associated with body weight than moderate-or low-intensity activity. For example, Bernstein et al. (215) demonstrated a clear dose-response relationship between high-intensity activities and lower odds of being obese, but the relationship for moderate-intensity activities was not clear. Other data, however, have shown an inverse association between walking
distance or steps and body weight (216). Chan et al. (217) concluded that accelerometer-measured physical activity has also been associated with lower BMI (218, 219) and body fatness (220). Several cross-sectional analyses found a strong positive association between time spent watching TV and prevalence of obesity (221, 222). A strong positive association between time spent watching TV and BMI was found among middle-aged and older women in the Nurses`Health Study ((NHS) (223). When change in cardiorespiratory fitness is used as a surrogate for change in leisure-time physical activity (LPTA), the data reported by DiPietro et al. (224) demonstrate the inverse association between change in fitness and change in body weight, which also supports the importance of physical activity in the prevention of weight gain in adults. In longitudinal studies the results seems to be conclusive. For example, in a twin study (30-years follow-up) (225) that aimed to determine the association between long-term LPTA, weight gain and WC, 146 twin pairs were comprehensively identified from the large Finnish Cohort. The findings give further evidence that persistent long-term participation in LTPA is associated with a decrease rate of weight gain and smaller WC in adults. The same study reported that a 10cm reduction in WC across the population would produce significant benefits for public health. A longitudinal relationship between changes in physical activity and weight gain during 10 years of follow-up among 5 115 black men and women aged 18-30 years at baseline in the Coronary Artery Risk Development in Young Adults (CARDIA) Study, was seen by Schmitz et al. (226). The author concluded that, after adjustment for secular trends, age, and other covariates, increasing physical activity was significantly associated with less weight gain in the entire group. The benefits of exercise in preventing weight gain were much greater for obese subjects than for those of normal weight at baseline.
Dale schoeller et al. (227), using relatively precise objective measures of energy expenditure based on the doubly labeled water (DLW) method in a prospective study, found that active postobese women maintained their reduced weight better than those who were inactive. The author also concluded that the relation between physical activity and weight gain was not
linear but showed a threshold-like relation for weight control. This threshold corresponded to 80 min/d of moderate-intensity physical activity or 35 min/d of vigorous physical. Recently, the same author concluded from the accumulating data, from the application of the DLW method, a need to place greater emphasis on mechanisms that lead to a mismatch between energy intake and expenditure rather than a continuing emphasis on energy intake or energy expenditure alone (228). Thus, it appears that adequate levels of physical activity do not act alone to control body weight long-term, but rather work in synergy with appropriate levels of energy intake. For example, Jakicic et al. (229) reported that the combination of increased levels of physical activity combined with reduced levels of energy intake were predictive of long-term weight-loss outcomes following an 18-months intervention. Similar findings were reported by McGuire et al. (230) based on data from the National Weight Control Registry. Thus, these data appear to support the importance of maintaining adequate levels of energy balance (energy intake and energy expenditure) to enhance long-term weight loss and prevent weight regain following weight loss.
Several short term weight loss programs (6 months or less), document the effects of exercise and caloric intake in human body composition, and some studies report a high contribution of exercise on weight loss (100, 231, 232). It has been clearly established that effective behavioral weight-loss interventions result in approximately a 10% weight loss compared to initial body weight within 6 months of initiating an intervention (233). These results appear to be achievable with the combination of a reduction in energy intake and an increase in energy expenditure (209). It seems that, the contribution of each of these components (reduction in energy intake and increase in energy expenditure) are not equal, with the majority of weight loss resulting from a reduction in energy intake. However, Ross et al. (100) reported similar weight losses (7.6 kg) between two groups who participated in a 3 months weight loss program based on energy restriction (700 kcal/d) caused by reduction in energy intake, compared with an increase in energy expenditure promoted by physical activity. In response to
a 12-wk intervention, Hagen et al. (234) reported a reduction in body weight in the exercise-plus-diet group (-10.4 and -24%) significantly greater than diet group (-7.8 and -20%), with both groups significantly greater than exercise group and controls. The energy intake ranged from 1000 to 1500 kcal/d. Wing et al. (235) reported a weight loss of 10.4kg (after 6 months) in the exercise-plus-diet group compared with 9.1kg in the diet group. Similar results are documented in a literature review by the National Heart Lung and Blood Institute, confirming the influence of exercise in clinic intervention programs (209). Thus, the National Heart Lung and Blood Institute recommend the combination of a reduction in energy intake and an increase in energy expenditure to maximize weight loss in response to behavioural intervention (209).
Some studies reported that subjects who participated in exercise programs had modest decreases in body weight and body fatness, and this appears to occur in a dose-response manner (236). For Mougios et al. an increase in the total energy expenditure and a high intensity exercise appears to be the most important determinants of successful exercise-induced weight loss (232). For same, the total volume of physical activity, expressed as energy expenditure, may be more important for weight control than the intensity of the physical that is performed. For example, Duncan et al. (237) have demonstrated that when total volume of physical activity is held constant, there is no difference in the effect on body weight across different intensities of physical activity. Similar results have been reported by Jakicic et al. (238), who demonstrated that the magnitude of weight loss was affected by volume of physical activity rather than the intensity of physical activity within a 12 months clinical trial.
Despite the minimal effect of exercise on short-term weight loss, exercise appears to be an important component of long-term interventions. This is supported by the 2005 US Dietary Guidelines (239), the Institute of Medicine (240), and extensive reviews of the literature (241, 242). However, a common conclusion that appears to be supported by cross-sectional data,