Vol.48, n. 5 : pp. 787-800, September 2005
ISSN 1516-8913 Printed in Brazil BRAZILIAN ARCHIVES OF
BIOLOGY AND TECHNOLOGY
A N I N T E R N A T I O N A L J O U R N A L
Bathymetric Trends of Northeastern Brazilian Snappers
(Pisces, Lutjanidae): Implications for the Reef Fishery
Dynamic
Thierry Frédou
1,2,3*and Beatrice Padovani Ferreira
1 1Departamento de Oceanografia; Universidade Federal de Pernambuco; 50739-540; Recife – PE - Brasil. 2
Université de la Méditerranée; Centre d’Océanologie de Marseille; UMR CNRS 6540; 13288 Marseille cedex 9; France. 3Present address: Centro de Geociências; Universidade Federal do Pará; Campus Universitário do Guamá; 66075-110; Belém - PA - Brasil
ABSTRACT
The investigation of bathymetric distribution of five snappers caught along the Brazilian Northeastern coast by artisanal fleets through the analysis of the catch composition and relative abundance (CPUE) showed that, on the overall, fished mean size increased along depth and that particular species dominated the catch according to the depth strata. Mutton snapper, L. analis, yellowtail snapper, L. chrysurus, and dog snapper, L. jocu were mainly caught at intermediate depth (20-80m) whereas lane snapper, L. synagris, and silk snapper, L. vivanus, inhabit respectively shallow (<20m) and deep (>80 m) waters. Each fleet category exploited preferentially a particular combination of species and their size range. The fleet dynamic of the Northeast Brazil is technologically heterogeneous and determines the catch composition. Geographical distribution of the fishery and technical interaction between fleets and gears should be considered by the management of these species in order to maintain the sustainability of the stock and to guarantee the continuance of the resource.
Key words: Fish distribution, technological interaction, artisanal fishery, Lutjanids, reefs
*
Author for correspondence
INTRODUCTION
The abundance of marine species fluctuates in space and time. Such fluctuations may be due to physical (currents, temperature, etc.), or biological processes (as growth and mortality) as well as behavioural processes (migration, habitat use) (Jenningset al., 2001). Various studies have been conducted on spatial and/or temporal distribution of reef fish communities, as size dependent processes have long been recognised as important for the community structure and resources (Sale, 1980; Gobert, 1994).
in this area and their effects on reef fish communities.
It is rather common to observe size distribution according to depth for reef fishes (MacPherson and Duarte, 1991; Hilborn and Walters, 1992). Considering the fishery activity, a common pattern observed for target species is the increase of the number of large specimens in the catches with increasing depth (Roberts, 1996). This pattern has been attributed to two main natural processes: ontogenetic migrations from coastal reefs to the external part of the shelf or depth related growth and mortality rates. While migration may be related to availability of suitable prey for juvenile fish or predation avoidance (Roberts, 1996), differential growth and mortality may be related to environmental factors. Temperature variation according to the depth gradient leads to variation in basal metabolism rates and therefore may alter the growth rate (Longhurst and Pauly, 1987). Determining the natural pattern of distribution is specially important for species that are targeted by fisheries, as the effects of fishing in a population may also be extended to population parameters. Coral reef formations in Brazil extend for approximately 3000 km along the Northeastern coast (Maida and Ferreira, 1997). They are constituted by organic substrates built with coral, algae and mollusc skeletons. The continental shelf varies from 45 to 60 km wide in Ceará and Rio Grande do Norte, then becomes relatively narrow in Pernambuco coasts, to wide again in the south of Bahia, reaching 200 km (Maida and Ferreira, 1997). Brazilian reef fishes are intensively exploited by artisanal fisheries that concentrate on the reef formations distributed along the continental shelf up to the continental slope and over oceanic banks (Ferreira et al., 1998; Ferreira and Maida, 2001).
In the Northeast Brazil, reef fishes represent 46 % (of which lutjanids represent 20%) of the total catch of the main target species in weight (total catch: 26171 tonnes). The 54% remaining is constituted by the pelagic and the deep-sea demersal fauna (Estatpesca, 2000). During the end of the 60’s, the 70’s, 80’s, 90’s and the beginning of 2000’s, lutjanids’ catches in the Northeast Brazil ranged between 34%, 11341 tonnes during the 60’s, and 43%, 77422 tonnes during the 80’s. During the 60´s and 70´s, the most valuable and most frequently caught species in Northeast Brazil were the red snapper, Lutjanus purpureus (Poey 1866), and in minor proportions, L. analis (Cuvier,
1828). From 1978 with the collapse of the red snapper fishery, others species as L. jocu (Bloch and Schneider, 1801), L. chrysurus (Bloch, 1791), and more recently, L. synagris (Linnaeus, 1758), constitute the major part of the lutjanids catch in Northeast Brazil (65%) (SUDEPE, 1967-1979; IBGE, 1980-1989; IBAMA, 190-2001)1.
According to Ferreira et al. (2001), fisheries in Brazilian reefs may be divided into two types. First, the activity of recreational and artisanal scale fishermen occurs nearby the coast in shallow waters and reefs formations. Fishing point may be reached by swimming or using rowing or sailing canoes. Secondly, the medium scale commercial fisheries that operates by the coastal part of the shelf, using sailing or motorised boats that reach deeper waters as far as the shelf break. Only motorised boats, that may operate also on the banks far from the coast, have storing capacity (Ferreira and Maida, 2001). Along the Northeastern coast, snappers represent one of the main resources in terms of abundance and fishermen´s income (Santos, 2001). Generally demersal, the snappers are tropical and sub tropical fishes that are distributed on reefs down to depths about 450 m (Allen, 1985; Polovina and Ralston, 1987). Top predators, they consume a broad range of prey generally dominated by fish. They show low growth and natural mortality rates (Manooch, 1987). Snappers produce eggs with pelagic dispersion (Grimes, 1987).
Our study focused on five species of Lutjanus, which inhabited coastal to deep demersal waters. The main species caught by the artisanal fishery in Northeast of Brazil were considered: the mutton snapper L. analis, the yellowtail snapper L. chrysurus, the dog snapper L. jocu, the lane snapper L. synagris andthe silk snapper L. vivanus
(Cuvier, 1828). The distribution and relative abundance of these species along a depth gradient, across the Northeast Brazil continental shelf and upper slope was described. The effects of the reef fishery on distribution, size of fish and CPUE of snappers considering the relationship between the species distribution and the dynamics of the fleets (gear used, fleet category and operating area) were also discussed.
1 Brazilian fisheries statistic: Superintendência do Desenvolvimento
MATERIALS AND METHODS
Study site and data collection
Most of the data for this study were collected as part of a national programme called REVIZEE (Evaluation of the Potential of the Live Resources from Brazilian Exclusive Economic Zone), which was established in 1996 in order to provide information on the biology and fishery of its main resources. Another programme “Projeto Recifes Costeiros” complemented the dataset available on the artisanal fishery in Pernambuco. A comparative analysis was applied to the reef fisheries distributed over 2000 km of coast encompassing five Brazilian states (Ceará, Rio Grande do Norte, Pernambuco, Alagoas and Bahia) through a five-year sampling programme. It was gathered information regarding the fishing tactics (fishing area, gear used, target groups, etc)
and catch composition of fleet operating in the region.
Data were collected from August 1996 to March 2000. Species were identified and measured in situ (fork length FL). The landings sites were chosen in order to get a representative picture of the catch composition in the region. Sites were localised over the five states cited above. In addition, some data were collected from research vessels that operated on the banks and oceanic islands (Atol das Rocas and Arquipélago de São Pedro e São Paulo) off the Rio Grande do Norte coast.
Fishermen were interviewed and information regarding the operation within the fishery and catch were collected. Within the REVIZEE framework, more than 69 000 records of fishes supplied by 2400 trips were gathered. For this study, nearly 22 000 fishes, which had information on depth, were considered amongst the 5 species of Lutjanus (Table 1).
Table 1 - Number of four lutjanid species sampled from August 1996 to March 2000 with information on depth by states.
S p e c i e s C e a r á R i o G r a n d e
d o N o r t e P e r n a m b u c o A l a g o a s B a h i a T o t a l L . a n a l i s 3 9 2 1 7 8 9 7 7 1 0 3 1 3 2 0 2 9 7 0
L . c h r y s u r u s 2 5 7 8 4 0 0 1 0 9 2 9 3 5 6 1 8 9 7 8 1
L . j o c u 7 5 0 7 9 3 9 4 1 4 2 9 8 9 2 3 5 4
L . s y n a g r i s 2 2 7 1 5 3 4 1 7 7 0 1 3 4 8 9 5 0 7 7
L . v i v a n u s 1 3 0 2 5 2 1 8 3 4 2 1 0 9 0 1 6 9 7
T o t a l 6 1 2 1 1 4 4 3 4 4 1 6 3 9 3 9 5 0 6 2 1 8 7 9
Information on specific landings and effort (number of boats) by fleet category were collected for the studied period by the program ‘ESTATPESCA’ held by the Brazilian Environmental Agency for official statistics (IBAMA, Instituto Brasileiro do Meio Ambiente e dos Recursos Naturais Renovaveis). The reef fishery can be distributed into five categories of fleets classified as following, from the most rudimental to the most technically advanced fleet: “Paquete” (PQT), “Jangada” (JAN), “Bote a vela” (BOV), “Bote” (BOT), “Bote motorizado” (BOM) (see Table 2 for details). In addition, historical landings were compiled for the period from 1967 to 2001 by various governmental organisations: the Brazilian Institute for Geography and Statistics
(IBGE, Instituto Brasileiro de Geografia e
Estatística), the Research Centre for Northeastern
Fisheries (CEPENE, Centro de Pesquisa e
Extensão Pesqueira do Nordeste), and the
Superintendence for the Fishing Development
(SUDEPE, Superintendência para o
Desenvolvimento da Pesca).
Data analysis
The relationship between depth and fish size was assessed by correlation and regression analyses. The correlation analysis was used to test the statistical significance of the relationship for each species. The correlation between depth and size was determined for all species using non-parametric Spearman’s rank correlation coefficient. The regression analysis was performed using the Kendall's robust line-fit method (Sokal and Rohlf, 1995). Kendall's rank correlation was used in order to test whether the
✁✂ ✄☎✆ ✝
✞✟ ✂✠ ☎✡☛
☞
✄☎☛ ✌ ☎ ✍ ✡ ✎✌ ✟✟
☎ ✠
☎✏ ✑
✟✠✂✒✓ ☎
✠ ✂✔
values of fish size were analysed by gear in order to describe the gear effects on the life history of the species. For each species, catches were also analysed by sampled year and fleet category. Catch-per-unit-effort (CPUE) was used as an index of relative abundance. The catch was defined in two different ways: (1) by using total weight (kg) caught by species and (2) by using number of individuals caught. Furthermore, in order to standardise the effort between gears, the time (days) spent at sea for each trip was chosen as the best estimate. In spite of the roughness of the unit of effort, catch and effort for each species
were positively correlated (Spearman’s correlation r = 0.5, p < 0.001). The CPUE analysis was carried out by species considering the following depth strata: < 20m (inner shelf), 20 to 80m (outer shelf), and >80m (slope) (Mabesoone and Coutinho, 1970). The Kruskal and Wallis non-parametric test was used to test the differences of the CPUE index between depth strata as well as differences between fleet categories. We also looked at CPUE versus depth strata relationship using Spearman’s rank correlation analysis.
Table 2 - Fleet category description.
Fleet type Code Depth range (m)
25% - median - 75% Description
Paquete PQT 8 - 12 - 24 Sail, wood-made, flat shell without keel nor cabinSize<6m, no storing capacity
Jangada JAN 14 - 30 - 42 Sail, wood-made, flat shell without keel nor cabin storing capacity (isotherm box)
Bote à vela BOV 43 - 73.5 - 96 Sail, cabin, storing capacity size<15m storing capacity, ice
Bote motorizado BOM 41 - 52.5 - 93 Motorised, cabin, storing capacity size<15m storing capacity, ice
Bote BOT 82 - 93 - 115 Sail and motor facilities, cabin, storing capacity size<15mstoring capacity, ice
All five species showed a positive and significant correlation between the fork length and the depth (Table 3). Considering all gears pooled together, the fish size caught ranged for snappers from 7.5 to 103.0 cm FL. Although the mean fork length represented in the Figure 1 did not highlight a clear pattern, regression analysis performed on fork length along the studied period determined that three species presented a decreseasing trend,
L. synagris (β=-0.1, p<0.001), L. analis (β=-0.11, p<0.001), L. vivanus (β=-0.17, p<0.001) whereas
L. chrysurus showed a significant increasing trend (β=0.25, p<0.01). L. jocu did not present a significant pattern.
Line fishery caught snappers from 7.5 to 99 cm FL, while nets caught individuals from 13 to 85 cm FL and traps caught individuals from 16 to 103
cm FL. Analysing the catch composition by
species, every gear affected almost the entire size range of the snapper populations; however, traps were found the most selective for L. chrysurus and
L. vivanus (Fig 2). The fork length of snappers caught by all the three gears increased according
to depth until a maximum at 60 m (Table 4). The operating depth range was deeper for line and shallower for net and traps (Table 5a). Paired gear groups were tested using the Mann-Whitney U procedure.
Fork length (cm)
Lut analis 4 0
4 8 5 6 6 4
1 9 9 7 1 9 9 8 1 9 9 9
L. chrysurus 3 0
3 6 4 2
1 9 9 7 1 9 9 8 1 9 9 9
L. jocu 4 0
5 0 6 0 7 0
1 9 9 7 1 9 9 8 1 9 9 9
L. synagris 1 8
2 4 3 0 3 6
1 9 9 7 1 9 9 8 1 9 9 9
L. vivanus 2 4
3 0 3 6
1 9 9 7 1 9 9 8 1 9 9 9
Figure 1 - Mean size (cm) of each species exploited along the Northeastern coast during the studied period. Bars indicate standard errors of means.
Furcal Length (cm)
L. analis 0
30 60 90 120
Line Net Trap
L. chrysurus 0
20 40 60 80 100
Line Net Trap
L. jocu 0
30 60 90 120
Line Net Trap
L. synagris 0
10 20 30 40 50 60 70
Line Net Trap
L. vivanus 10
20 30 40 50 60 70 80
Line Net Trap
Table 3 - ✁ ✂✄☎✆✄✝✞✟☎✄✝ ✠✡☛
☎☎✂☞✄ ✌✍
☛ ✝
✡☛ ✂✎ ✎
✍ ✡
✍ ✂✝
✌
✟✏☎✑✄✝✒✝ ☛
✝✁ ✄☎✄✆✂ ✌
☎ ✍
✡ ☎✂✓☎✂ ✟✟
✍ ☛
✝ ✟☞ ☛
✁ ✂ ✏✔✑✕✂ ✌✖
✂✂✝✒✂✁ ✌✗
✄✝✒
fish size, n is the number of specimen measured for each species.
S p e c i e s r p - l e v e l n ✘ p - l e v e l
L . a n a l i s 0 , 4 0 p < 0 . 0 0 1 3 5 2 6 0 , 2 1 7 p < 0 . 0 0 1 L . c h r y s u r u s 0 , 2 9 p < 0 . 0 0 1 9 9 5 7 0 , 0 7 1 p < 0 . 0 0 1
L . j o c u 0 , 1 8 p < 0 . 0 0 1 2 5 2 1 0 , 0 8 9 p < 0 . 0 0 1
L . s y n a g r i s 0 , 3 5 p < 0 . 0 0 1 5 1 3 6 0 , 1 3 8 p < 0 . 0 0 1 L . v i v a n u s 0 , 1 3 p < 0 . 0 0 1 1 7 1 9 0 , 0 2 3 p < 0 . 0 0 1
Table 4 - Mean fork length of the five snappers (L. analis, L. chrysurus, L. jocu, L. synagris, L. vivanus) by gear and depth layer.
D e p t h ( m ) L i n e N e t T r a p A l l
0 - 2 0 2 3 . 4 2 2 . 1 2 7 . 3 2 3 . 1
2 0 - 4 0 3 2 . 2 3 0 . 7 3 0 . 9 3 1 . 9
4 0 - 6 0 4 0 . 2 3 7 . 6 4 5 . 4 3 9 . 8
6 0 - 8 0 3 9 . 2 4 2 . 0 4 0 . 7 3 9 . 5
> 8 0 3 9 . 8 3 7 . 8 3 8 . 2 3 9 . 3
Table 5 - (5a) Median and quartile of depth of operation for each gear. (5b) Proportion (%) of gear used by depth layers.
(5a)
G e a r Q u a r t i l e
2 5 % M e d i a n
Q u a r t i l e 7 5 %
L i n e 2 7 4 3 . 5 6 3
N e t 1 2 . 6 3 4 5 2 . 5
T r a p 2 7 3 6 4 4 . 3
(5b)
D e p t h ( m ) L i n e N e t T r a p A l l
0 - 2 0 2 5 . 1 4 0 . 3 2 4 . 6 2 8 . 1
2 0 - 4 0 2 1 . 1 2 0 . 7 3 5 . 4 2 1 . 7
4 0 - 6 0 2 5 . 3 2 1 . 0 2 3 . 1 2 4 . 4
6 0 - 8 0 6 . 7 3 . 9 1 . 5 5 . 9
> 8 0 2 1 . 8 1 4 . 1 1 5 . 4 1 9 . 9
T o t a l 1 0 0 1 0 0 1 0 0 1 0 0
Catch per unit of effort (CPUE) versus depth relationship
Although snappers have a wide range of distribution, differences between species were detected. The maximum relative abundance
(numerical and biomass CPUE) of the Lutjanus
species varied according to depth. L. synagris and
L. vivanus were more abundant at the extremes of the snappers distribution range: shallower and deeper waters respectively. The three other species (L. analis, L. chrysurus, and L. jocu) showed a smoother distribution with a maximum
abundance reported in the 20 – 80 m depth strata -outer shelf part (Table 6a and 6b). The relationship between the numerical CPUE (individuals caught per day at sea) and the depth was negatively correlated for L. synagris, L. jocu, L. chrysurus, and L. analis. L. vivanus presented a non-significant positive relationship (Table 7a), while the relationship between the depth and the
CPUE in kg per day at sea was negative for L.
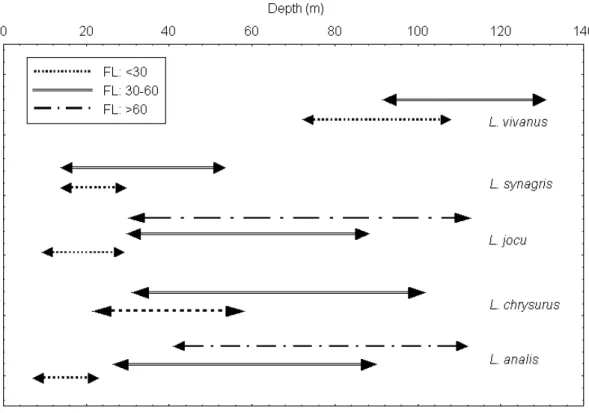
Figure 3 - Size distribution (cm) of the five Lutjanus species (FL= fork length) according to the depth in the studied area.
Fleets mostly operated between 40 and 60 m (25% of the total number of trips)(Table 8), where the major part of Lutjanids stocks are located, affecting mainly the adults of L. analis and L. jocu
(> 30 cm FL) and, both juveniles (< 23 cm FL)
and adults of L. chrysurus (Fig 3). The depth stratum 20-40 m concentrated 20% of trips, which influenced young adults (> 30 cm) of L. jocu, and both juveniles and young adults of L. synagris and
L. chrysurus.
Table 6 - (6a) Mean biomass CPUE (kg/time at sea) by species and depth strata. (6b) Mean numerical CPUE (Number of individuals/time at sea) by species and depth strata.
(6a)
D e p t h L . a n a l i s L . c h r y s u r u s L . j o c u L . s y n a g r i s L . v i v a n u s A l l
< 2 0 1 . 6 3 . 5 1 . 2 6 . 5 - - 6 . 0
2 0 - 8 0 2 . 1 8 . 5 2 . 1 5 . 3 2 . 8 1 0 . 8
> 8 0 1 . 2 8 . 0 1 . 1 1 . 7 3 . 9 6 . 9
(6b)
D e p t h L . a n a l i s L . c h r y s u r u s L . j o c u L . s y n a g r i s L . v i v a n u s A l l
< 2 0 1 . 0 0 . 5 0 . 3 1 . 8 - - 1 . 7
2 0 - 8 0 9 . 6 4 . 8 5 . 2 1 . 4 1 . 4 1 2 . 6
Table 7 - Spearman’s rank correlation coefficients, probability and sample size (n) of the relationship between depth and CPUE (bold and underlined coefficients are significant at 5%). (7a) numerical CPUE, (7b) biomass CPUE. (7a)
S p e c i e s r p - l e v e l n
A l l - 0 . 0 6 0 . 0 2 9 1 2 2 7
L . a n a l i s - 0 . 1 9 < 0 . 0 0 1 5 9 7
L . c h r y s u r u s - 0 . 1 6 < 0 . 0 0 1 5 6 7
L . j o c u - 0 . 2 7 < 0 . 0 0 1 5 1 8
L . s y n a g r i s - 0 . 2 7 < 0 . 0 0 1 6 1 4
L . v i v a n u s 0 . 1 3 0 . 1 5 3 1 3 2
(7b)
S p e c i e s r p - l e v e l n
A l l 0 . 4 5 < 0 . 0 0 1 1 2 2 4
L . a n a l i s 0 . 0 9 0 . 0 2 5 5 9 4
L . c h r y s u r u s 0 . 0 3 0 . 4 6 7 5 6 7
L . j o c u - 0 . 0 5 0 . 2 8 4 5 1 8
L . s y n a g r i s - 0 . 1 2 0 . 0 0 3 6 1 4
L . v i v a n u s 0 . 2 1 0 . 0 1 8 1 3 2
Table 8 - Effort allocation. Proportion (%) of trips by depth layer by fleet category. PQT: ‘paquete’, JAN: ‘jangada’, BOV: ‘sailing boat’, BOT: ‘mixed propulsion’, BOM: ‘motorised boat’ Total n=1767 trips.
D e p t h P Q T J A N B O V B O T B O M T o t a l
0 - 2 0 1 3 . 5 1 1 . 7 0 . 1 0 . 1 1 . 8 2 7 . 2
2 0 - 4 0 1 . 8 8 . 1 0 . 6 - - 9 . 8 2 0 . 4
4 0 - 6 0 0 . 3 5 . 8 0 . 5 0 . 1 1 8 . 4 2 5 . 1
6 0 - 8 0 0 . 2 1 . 7 0 . 7 0 . 2 3 . 1 5 . 8
> 8 0 - - 0 . 7 1 . 5 1 . 4 1 7 . 9 2 1 . 6
T o t a l 1 5 . 8 2 8 . 1 3 . 4 1 . 8 5 1 . 0 1 0 0
Fleet interactions and catch composition of Lutjanus species by fleet
Motorised boats “Botes Motorizados” (BOM) and wind motioned “jangadas” (JAN) were the most important fleet categories with respectively 28% and 51% of the total number of trips during the studied period along the northeastern coast (Table 8). Motorised boats operated mostly from 20 m towards offshore (over 80 m deep) whilst “jangadas” fished from the coast up to 60 m deep. Sailing boats (BOV) and mixed boats (BOT) represented 5% of the total number of trips with an operation range mostly above 80 m. “Paquetes” represented 15% of the total number of trips and operated mainly from the coast up to 20 m deep. The snappers’ catch composition (Table 9) showed that motorised boats (BOM) fished on the five
studied species. However, L. synagris that
inhabited shallower waters, was less affected by motorised boats but it was the main target of the
wind propelled “paquetes” and “jangadas”. Conversely, L. vivanus, which inhabited deeper waters, was targeted almost exclusively by motorised boats. The remaining species were caught by all categories. As fishing activity was greater at shallow (<20 m) and intermediate depth (40 to 60 m), where rudimental fleet and more advanced technologically fleets overlapped, fishery in Northeast of Brazil affected mainly species that inhabited preferably this depth layer (L. analis, L. jocu and L. chrysurus).
motorised boats category (BOM) with 22.4% of the total fleet. However, although motorised boats were less numerous, their fishing power was greater than “jangada’s” ones and, landings of motorised boats (BOM) and “jangadas” equally represented 27% of the Lutjanus catches recorded by the Brazilian official statistics during the period from 1997 to 2001 (estatpesca). Motorised boats (BOM) and sailing boats (BOV) showed the greater yield considering the biomass, CPUE and the numerical CPUE. BOM yielded 13.7 and BOV 9.6 kg / days spent at sea whilst “jangadas” yielded 6.1 kg/ days (Table 12a and 12b).
Trip duration, days spent at sea, was different amongst fleet categories and states (Table 13). While small fleets, “paquetes” and “jangadas”, spent at sea no more than two days, more sophisticated fleets trip duration (BOM, BOV) could spend 12 days at sea. However there were differences between the states. “Jangadas” from Ceará and Rio Grande do Norte spent, on average, two days at sea while, in Pernambuco, trip was restricted to one day. Motorised boats (BOM) time at sea ranged from 1 - 2 days in Bahia to 4 - 5 days in Pernambuco, Alagoas and Rio Grande do Norte. In Ceará trips of Motorised boats (BOM) lasted up to 13 days.
Table 9 - Proportion of the main fleet categories that exploit the five lutjanids species studied.
S p e c i e s B O M B O T B O V J A N P Q T
L . a n a l i s 8 8 . 5 3 . 8 2 . 2 4 . 1 1 . 4
L . c h r y s u r u s 9 1 . 4 0 . 3 1 . 1 6 . 7 0 . 5
L . j o c u 8 1 . 7 1 . 9 0 . 6 1 5 . 5 0 . 3
L . s y n a g r i s 4 9 . 0 0 . 2 8 . 2 2 7 . 8 1 4 . 8
L . v i v a n u s 8 9 . 5 1 . 4 6 . 5 0 . 8 1 . 9
T o t a l 8 4 . 2 1 . 1 2 . 5 9 . 6 2 . 6
Table 10 - Kruskal-Wallis ANOVA by ranks between relative abundances by fleet category. (ns):non significant
C P U E
( n b / t i m e a t s e a )
S p e c i e s n p p
L . a n a l i s 5 9 4 < 0 . 0 0 1 < 0 . 0 0 1
L . c h r y s u r u s 5 6 7 < 0 . 0 0 1 0 . 3 8 4 ( n s )
L . j o c u 5 1 8 < 0 . 0 0 1 0 . 0 0 5
L . s y n a g r i s 6 1 5 0 . 0 1 < 0 . 0 0 1
L . v i v a n u s 1 3 2 0 . 0 2 0 . 2 7 9 ( n s )
A l l 1 2 2 4 < 0 . 0 0 1 < 0 . 0 0 1
B i o m a s s
C P U E
Table 11 - Proportion (%) of boats in activity, registered by the national fishery statistic program by state along the Northeastern coast during the studied period. Averaged total number of boats in activity along the studied period: 17000 boats.
F l e e t C e a r á R i o G r a n d e
d o N o r t e P e r n a m b u c o A l a g o a s B a h i a T o t a l
P Q T 1 1 . 2 4 - - - - 0 . 8 1 6
J A N 1 0 . 6 1 2 . 6 1 0 . 9 1 1 . 8 6 . 8 5 2 . 7
B O V 2 . 7 4 . 8 - - 1 0 . 3 8 . 8
B O M 5 6 . 1 5 3 3 . 3 2 2 . 4
Table 12 - Relative abundance, catch per unit of effort ((12a) numerical CPUE, (12b) biomass CPUE), by fleet category for the five lutjanids species.
(12a)
F l e e t L . a n a l i s L . c h r y s u r u s L . j o c u L . s y n a g r i s L . v i v a n u s A l l
P Q T 1 . 4 4 . 1 1 . 1 5 . 7 - - 5 . 2
J A N 1 . 3 3 . 8 1 . 8 4 . 4 1 . 7 6 . 4
B O V 0 . 9 7 . 6 1 . 7 2 . 1 2 . 4 7 . 3
B O T 0 . 9 - - 0 . 9 - - - - 4 . 1
B O M 2 . 2 1 1 . 3 1 . 9 8 3 . 3 1 1 . 9
(12b)
F l e e t L . a n a l i s L . c h r y s u r u s L . j o c u L . s y n a g r i s L . v i v a n u s A l l
P Q T 1 . 7 1 . 6 1 . 1 1 . 5 - - 1 . 8
J A N 7 . 0 1 . 6 4 . 6 1 . 3 1 . 4 6 . 1
B O V 2 . 4 5 . 5 6 . 3 1 . 6 1 . 9 9 . 6
B O T 2 . 2 - - 3 . 5 - - - - 4 . 8
B O M 8 . 9 6 . 8 4 . 8 2 . 0 1 . 7 1 3 . 7
Table 13 - Averaged time spent at sea (days/trips) by state and fleet category.
F l e e t C e a r á R i o G r a n d e
d o N o r t e P e r n a m b u c o A l a g o a s B a h i a
P Q T 1 . 3 1 . 8 1 - -
-J A N 2 . 2 2 . 3 1 - -
-B O V 1 1 1 . 8 - - - -
-B O T - - 2 . 9 - - - -
-B O M 1 2 . 7 3 4 . 5 4 1 . 7
DISCUSSION
Patterns of the relationship between body size and abundance in natural assemblage have been documented for a number of animal taxa (Gaston et al., 1993). Also, in a fishery context an increase of the number of large specimen with increasing depth has been commonly observed (Roberts, 1996). Our results indicated significant body size versus depth relationship for each species. Bathymetric distribution according to demersal fish size has been already reported (Lukens, 1981; MacPherson and Duarte, 1991). The relationships, examined in our study, showed a general trend going towards a greater size with increasing depth, which was also reported in other studies (Rooker, 1995; Machias et al., 1998; Rex and Etter, 1998). However, the depth- body size relationship was weaker at intermediate depths due to a spatial overlap. Indeed, when small individuals were exclusive to shallow waters and only large ones were caught in deep waters, mixed catch of medium and large fishes was reported at intermediate depths. This movement could be related to feeding, and reproductive habits (Uiblein, 1991; MacPherson, 1998; St-John, 1999; Grutter, 2000; Carrasson and Matallanas, 2001).
Oliveira (2000) reported that maximum relative abundance (CPUE) of teleosts species on the external part of the shelf and the slope was observed within the depth strata of 100 – 150 m. In this study, the maximum abundance of four
have their losses of energy reduced (Longhurst and Pauly, 1987), which allows them to store more energy so they are less susceptible to fluctuations in food supply (scarcer in deep waters) (Sogard, 1997). The maximum length reported for the
Lutjanus species (L. analis: 94 cm FL, L. chrysurus: 87 cm FL, L. jocu: 128 cm FL, L. synagris: 60 cm FL, L. vivanus: 83 cm FL) (Allen, 1985) was similar to the maximum length registered for the Northeast Brazilian catches. For all species, juveniles were also caught. Hence, the three main operating fishing gears (traps, lines and gill nets) affected almost the entire range of the life history of the Lutjanus species. However, gears caught fishes of similar size for all species. In a multispecific perspective, the fleet/gear comes into contact with stocks of different species, and a mixed catch result due to the exploitation of technologically interdependent species (Anderson, 1986). In such a context, the technological interactions is not only related to the selection of part of the stock but also with the selection of the species caught. Considering the species distribution and the multispecific nature of the reef fishery in Northeast Brazil, fleet operation may vary from shallow to deep waters depending, amongst others factors (environmental conditions, motorised or wind motioned boats, shelf width, trade winds, etc), on the availability of a typical coastal species (as L. synagris) or a typical deeper-water species (as L. vivanus). Considering such stratified distribution, fleets with different operation capacities affect stocks on different ways.
These differences may not necessarily be related to gear (a boat in tropical fishery may carry more than one gear) but also to the fleet power, which is related to fleet category, and also to the state, due to its environmental characteristics. Fishing grounds, i.e. shallow or deep waters, is reached according to fleet power. Factors as engine power, carrying capacity, presence or absence of ice are related to the distance to the shore and hence, the time at sea. Additionally, environmental conditions such as wind, rain, currents, or the continental shelf width may influence the access to shallow or deep fishing grounds.
Our results highlighted the fact that technological interactions, affected the catch composition and, therefore, the fishing impact on snappers. All fleets categories mostly operated within the 40-60 m depth zone, what consequently affected mostly
L. analis, L. jocu and L. chrysurus. Motorised
boats (BOM) affected mainly L. vivanus because of its deeper waters fleet operation. “Jangadas” and “paquetes” had as their main target L. synagris
since they operate in shallower waters. Also, climatic, oceanographic or geographic characteristics as winds, currents or geomorphology of the shelf may influence the fleet operation and catch composition. For example, wind powered boats, “paquetes”, “jangadas”, sailing boats (BOV) in Ceará had a greater operating range, and therefore affect a greater number of species, due to the dominant winds (Trade winds) that allowed the vessel to reach deeper waters.
Fleets are likely to exploit different stages of the life cycle of a fish community while operating in different geographical areas in simultaneous or sequential harvesting (Charles and Reed, 1985). Fisheries of the same fish community are linked through their exploitation. To maintain the sustainability of the stock and to guarantee the continuance of the resource, the optimal fleet mix and catch allocation should be carefully considered (Kulbickiet al., 2000; Labrosse et al., 2000; Letourneuret al., 2000; Lucenaet al., 2002). The multifleet and multispecies nature of the northeastern Brazilian fisheries has various consequences in terms of resources management and ecological issues. In the study area, few marine protected areas (MPA) have been created along the coast as a part of a new management alternative of reef ecosystems (Ferreira, 2000). Some marine protected areas have been set parallel nearby the coast, mainly because of logistical reasons, i.e. zone easily accessible and that can be watched from the shore. This setting would only preserve part of the life cycle of some species, excluding other species. Due to the within and between fish species spatial structure, the MPA design will have consequences on its efficiency (Kramer and Chapman, 1999). In small reserves near the shore, snappers’ home range will exceed the MPA limits. Considering the reef fishery in Northeast Brazil, the MPA might be most efficient if set in direction to the off-shore in a attempt to protect the entire range of fish distribution and consequently the entire life cycle of the species. This could also offer some protection of various kinds of habitats used by different stage of the life-cycle of each species.
tactics, variations in the effort and/or gear fishing power were considered representative to the actual trend in the fish distribution (fishermen go where the fish is). More attention should be given on technological interactions and multispecies aspects of the reef fishery in Northeast Brazil as stock assessment models for the management of single species fished by one type of gear (or fleet) may be inadequate to apply to the northeastern Brazilian fisheries and to predict changes at the assemblage level (Pikitch, 1988; Hilborn and Walters, 1992). The inter and intra-specific bathymetric distribution and the multifleet character of the Northeastern Brazilian reef fishery demonstrated that considering only one category of a fleet would likely bias this assessment on the real impact of fishing activities.
ACKNOWLEDGEMENTS
This research is part of the ‘Programa Nacional de Avaliação do Potencial Sustentável dos Recursos vivos da Zona Econômica Exclusiva - REVIZEE’ funded by the Ministério do Meio Ambiente – MMA and the Secretaria da Comissão Interministerial para os Recursos do Mar – SECIRM. We thank André Vasconcelos, Kenia Cunha, Elton Nunes, Kátia Freire, Denis Hellebrandt, Marcelo Nóbrega, Moustapha Diedhiou, Roberto Kobayashi, Sergio Rezende (DTI/CNPq), Simone Teixeira and several students involved in data collection. We particularly thank Yves Letourneur and Flávia Lucena for their helpful comments on earlier drafts.
RESUMO
A distribuição batimétrica de cinco espécies de peixes do Nordeste Brasileiro foi examinada através da análise da composição da captura e e abundância relativa (CPUE) mostrou que, de uma maneira geral, o comprimento furcal aumentou com a profundidade e que algumas espécies dominaram a captura de acordo com a faixa de profundidade. A cioba, L. analis, a guaiúba, L. chrysurus, e o dentão, L. jocu foram principalmente pescados na zona intermediaria (20-80 m) enquanto ariocó, L. synagris e o pargo olho-de-vidro L. vivanus ocorreram
respectivamente nas águas rasas e nas águas profundas. Cada tipo de embarcação do Nordeste do Brasil explota preferencialmente uma combinação particular de espécies e uma determinada amplitude de tamanho. A dinâmica da frota do nordeste do Brasil é tecnologicamente heterogênea e determina a composição da captura. A distribuição geográfica da pesca e a interação técnica entre as frotas e as artes de pesca devem ser consideradas pelo manejo destas espécies visando a manutenção dos estoques em bases sustentáveis e a garantia de continuidade do recurso.
REFERENCES
Allen, G. R. (1985), Snappers of the world. An annotated and illustrated catalogue of Lutjanid species known to date. Roma: FAO. 208 pp.
Anderson, L. G. (1986), The economics of fisheries management. London: The Johns Hopkins University Press. 296 pp.
Carrasson, M. and Matallanas, J. (2001), Feeding ecology of the Mediterranean spiderfish, Bathypterois mediterraneus (Pisces: Chlorophthalmidae), on the western Mediterranean slope. Fish. Bull., 99 : (2), 266-274.
Charles, A. T. and Reed, W. J. (1985), A bioeconomic analysis of sequential fisheries - competition, coexistence, and optimal harvest allocation between inshore and offshore fleets. Can. J. Fish. Aquat. Sci.,
42 : (5), 952-962.
Estatpesca (2000), Boletim estatístico da pesca marítima do Nordeste do Brasil. 139 pp.
Ferreira, B. P. (2000), Reef fishes and fisheries in Brazil's coral coast MPA: management perspectives.
In: International Coral Reef Symposium. World coral reefs in the millenium: bridging research and management for sustainable development, 9., Bali.
Proceedings... Bali. pp. 162.
Ferreira, B. P.; Cava, F. C. and Ferraz, A. N. (1998), Relações Morfométricas em Peixes Recifais na Zona Econômica Exclusiva. Bol. Téc. Cient. CEPENE, 6 : (1), 61-76.
Ferreira, B. P. and Maida, M. (2001), Fishing and the future of Brazil´s northeastern reefs. InterCoast, 38, 22-23.
Ferreira, B. P.; Maida, M. and Cava, F. C. (2001), Características e perspectivas para o manejo da pesca na APA Marinha Costa dos Corais. In:
Gaston, K. J.; Blackburn, T. M. and Lawton, J. H. (1993), Comparing animals and automobiles: a vehicle for understanding body size and abundance relationships in species assemblages? Oikos, 66 : (1), 172-179.
Gobert, B. (1994), Size structures of demersal catches in a multispecies multigear tropical fishery. Fish. Res., 19, 87-104.
Grimes, C.B. (1987), Reproductive biology of the Lutjanidae: a review. In:Polovina, J. J. and Ralston, S. (Eds.). Tropical snappers and groupers: biology and fisheries management. Boulder, USA: Westview Press. pp. 271-294.
Grutter, A. S. (2000), Ontogenetic variation in the diet of the cleaner fish Labroides dimidiatus and its ecological consequences. Mar. Ecol. Prog. Ser., 197, 241-246.
Hilborn, R. and Walters, C. J. (1992), Quantitative fisheries stock assessment: choice, dynamics and uncertainty. New York: Chapman and Hall. 570 pp. Jennings, S.; Kaiser, M. J. and Reynolds, J. D. (2001),
Marine fisheries ecology. Oxford: Blackwell Science. 417 pp.
Jennings, S. and Polunin, N. V. C. (1995), Comparative size and composition of yield from 6 Fijian reef fisheries. J. Fish Biol., 46 : (1), 28-46.
Kramer, D.L. and Chapman, M.R. (1999), Implication of fish home range size and relocation for marine reserve function. Env. Biol. Fishes, 55, 65-79.
Kulbicki, M.; Labrosse, P. and Letourneur, Y. (2000), Fish stock assessment of the northern New Caledonian lagoons: 2 - Stocks of lagoon bottom and reef-associated fishes. Aquat. Living. Res., 13 : (2), 77-90.
Labrosse, P.; Letourneur, Y.; Kulbicki, M. and Paddon, J. R. (2000), Fish stock assessment of the northern New Caledonian lagoons: 3 - Fishing pressure, potential yields and impact on management options.
Aquat. Living. Res., 13 : (2), 91-98.
Letourneur, Y.; Kulbicki, M. and Labrosse, P. (2000), Fish stock assessment of the northern New Caledonian lagoons: 1 - Structure and stocks of coral reef fish communities. Aquat. Living. Res., 13 : (2), 65-76.
Longhurst, A. and Pauly, D. (1987), Ecology of tropical oceans. San Diego, California: Academic Press. 407 pp.
Lucena, F. M., O'Brien, C. M. and Reis, E. G. (2002), Effect of exploitation of the bluefish Pomatamus saltatrix by two competing fleets in southern Brazil: An application of a catch-at-age model. Mar. Freshwater Res., 53 : (5), 1-13.
Lukens, R. R. (1981), Observations of deep-reef ichthyofauna from the Bahamas and Cayman Islands, with notes on relative abundance and depth distribution. Gulf Res. Rep., 7 : (1), 79-81.
Mabesoone, J. M. and Coutinho, P. N. (1970), Littoral and shallow marine geology of northern and northeastern Brazil. Trab. Oceanogr. UFPE, 12, 1-224. Machias, A.; Somarakis, S. and Tsimenides, N. (1998),
Bathymetric distribution and movements of red mullet Mullus surmuletus. Mar. Ecol. Prog. Ser., 166, 247-257.
MacPherson, E. (1998), Ontogenetic shifts in habitat use and aggregation in juvenile sparid fishes. J. Exp. Mar. Biol. Ecol., 220 : (1), 127-150.
MacPherson, E. and Duarte, C. M. (1991), Bathymetric trends in demersal fish size - Is there a general relationship? Mar. Ecol. Prog. Ser., 71 : (2), 103-112. Maida, M. and Ferreira, B. P. (1997), Coral Reefs of Brazil: Overview and Field Guide. In: International Coral Reef Symposium, 8., Panama. Proceedings... Panama. pp. 263-274.
Manooch, C. S. (1987), Age and growth of snappers and groupers. In: Polovina, J. J. and Ralston, S. (Eds.). Tropical snappers and groupers: biology and fisheries management. Boulder, USA: Westview Press. pp. 329-406.
Oliveira, V. S. (2000), Distribuição e abundancia relativa de peixes dermersais capturados com espinhel de fundo na plataforma externa e talude continental da costa nordeste do Brasil. MSc Thesis, Universidade Federal de Pernambuco. 86 pp.
Pikitch, E. K. (1988), Objectives for biologically and technically interrelated fisheries. In: Wooster, W. S. (Ed.). Fisheries Science and Management: Objectives and Limitations. New York, 28, 107-136.
Polovina, J. J. and Ralston, S. (1987), Tropical snappers and groupers: biology and fisheries management. Boulder, USA: Westview Press. pp. 659 pp.
Polunin, N. V. C. and Roberts, C. M. (1996), Reef fisheries. London: Chapman and Hall. 477 pp. Rex, M. A. and Etter, R. J. (1998), Bathymetric patterns
of body size: implications for deep-sea biodiversity.
Deep-Sea Research Part II -Topical Studies in Oceanography, 45 : (1-3), 103-127.
Roberts, C. M. (1996), Settlement and beyond: population regulation and community structure of reef fishes. In: Polunin, N. V. C. and Roberts, C. M. (Eds.). Reef fisheries. London: Chapman and Hall. pp. 85-112.
Rooker, J. R. (1995), Feeding ecology of the schoolmaster snapper, Lutjanus apodus (Walbaum), from southwestern Puerto Rico. Bull. Mar. Sci., 56 : (3), 881-894.
Sale, P.F. (1980), The ecology of fishes on coral reefs.
Oceanogr. Mar. Biol. Ann. Rev., 18, 367-421.
Santos, S. (2001), Características da pesca no nordeste, utilizando analise multivariada. MSc Thesis, Universidade Federal Rural Pernambuco. 77 pp. Sogard, S. M. (1997), Size selective mortality in the
Sokal, R. R. and Rohlf, F. J. (1995), Biometry. New York: Freeman and Co. 850 pp.
St-John, J. (1999), Ontogenetic changes in the diet of the coral reef grouper Plectropomus leopardus
(Serranidae): patterns in taxa, size and habitat of prey.
Mar. Ecol. Prog. Ser., 180, 233-246.
Uiblein, F. (1991), Ontogenic shifts in resource use and shoaling tendency related to body size in Red Sea goatfish (Parupeneus forsskali, Mullidae). Mar. Ecol. Pubbl. Stn. Zool. Napoli, 12 : (2), 153-161.