i
Master Final Work
Project – Equity Research
Novartis AG. (NVS)
Master in Finance
Sofia Isabel De Miranda Castilho
ii
Master Final Work
Project – Equity Research
Novartis AG. (NVS)
Master in Finance
Sofia Isabel De Miranda Castilho
Supervisor:
Prof. Doutor Pedro Rino Vieira
iii
Abstract
This project follow restricted presentation rules, aligning the style and regulations of ISEG
Master Final Project with the CFA Institute (Pinto, Henry, Robison, and Stowe, 2010)
recommendations, consolidated in this new presentation format for this kind of projects.
This project contains detailed information and studies developed about Novartis AG.
Choosing this company wasn´t properly a difficult choice, since I always had curiosity about
pharmaceutical industry and its main features of continuing hard working and investments
around innovation and investigation, influenced by arising new diseases globally, that makes
it an endless industry in that matter.
The price target of Novartis AG was computed using the Discounted Cash Flow (DCF)
approach. In order to support this valuation method, the Relative Valuation method was also
performed. I reached similar results through both methods.
The price target obtained in the course of the work performed about Novartis AG (NVS) was
$89.52, which represents and upside potential of 4,44% comparing with the stock price at
2018, October 16th. Regarding the full analysis about Novartis AG (NVS) the final
recommendation is Reduce, considering a medium risk assessment estimation for Novartis
AG.
iv
Resumo
Este trabalho final de mestrado segue regras restritas de apresentação sugeridas no estilo
do Trabalho Final do Programa de Mestrado do Instituto Superior de Economia e Gestão –
Universidade de Lisboa e também do CFA Institute (Henry, Robison, Pinto and Stowe,
2010), seguindo assim o novo formato de apresentação deste tipo de trabalho final de
mestrado, projeto.
Este trabalho contém informação sobre a empresa Novartis AG e estudos sobre a mesma.
Escolher esta empresa não foi propriamente uma tarefa árdua pois sempre tive imensa
curiosidade sobre a indústria farmacêutica por ser uma indústria onde não se consegue
projetar um fim e desta maneira um setor com um constante trabalho de investigação e
inovação para acompanhar a evolução das doenças da humanidade, com todos os custos
que esta tarefa acarreta.
Numa primeira instância foi feito um estudo do negócio incluindo uma estrutura de negócio
da companhia por cada divisão da mesma (Innovative Medicines, Sandoz e Alcon),
posteriormente foi esmiuçada a estratégia de negócio da firma muito assente na inovação.
Seguidamente, foi analisada estrutura de gestão da empresa.
O price target desta avaliação foi calculado através do método dos Fluxos de Caixa
Descontados (DCF). Para dar suporte a este método de avaliação alineei também o método
dos Multiplos Comparáveis. Desta forma com dois métodos diferentes consegui chegar à
mesma recomendação.
Neste trabalho foi também feita uma análise de riscos inerentes ao setor e à empresa. A
Novartis AG. enfrenta como principais riscos substanciais aqueles associados à vida útil
das patentes e ao sucesso ou não dos novos blockbusters que desenvolvem. Associado
também ao risco de sucesso dos novos produtos associa-se o custo em R&D gasto nos
mesmos, que em diversas situações não tem retorno algum.
O price target obtido foi de $89.52 que representa assim uma valorização de 4,44% quando
comparado com o preço da ação a 16 de Outubro de 2018. A recomendação é de Reduzir
a exposição e o risco estimado associado à Novartis AG (NVS) é risco Médio.
v
Acknowledgements
This project was a long and hard journey but very rewarding at the same time. Writing this thesis
would never be possible without the unconditional support of my family, friends and mentors.
To my family, thank you for the unconditional support, encouragement and valuable insights through
all my life path, hat made me achieve all my personal and professional goals.
To my friends, thanks for the friendship and good moments we spent together on this journey and
thanks for the push, making sure I make it through this final work.
To my boyfriend, thanks for always having my back, for the support and patience during these
months, for the friendship and for being part of this journey.
To Professor Pedro, thank you for the support, time patience and friendship during this process, I
can truly say you contributed a lot to shape me as a professional, with your guidance and advices.
It’s been an honor to learn from the finest professors from ISEG.
vi
Index
Abstract
iii
Resumo
iv
Acknowledgements
v
Index
vi
List of Figures
vii
List of Tables
viii
1. Research Snapshot
1
2. Business Description
2
3. Management and Corporate Governance
5
4. Industry Overview & Competitive Position
7
5. Investment Summary
13
6. Forecasts: Financial Statements
15
7. Valuation
19
8. Financial Analysis Resume
23
9. Investments Risks: Risk Assessment
24
Appendices
29
vii
List of Figures
FIGURE 1: NET SALES BY DIVISION ... 1
FIGURE 2: NOVARTIS AG. OFFICES ... 2
FIGURE 3: NOVARTIS AG. VALUES ... 2
FIGURE 4: POPULATION PYRAMID, EU-28, 2016 AND 2080 ... 2
FIGURE 5: NOVARTIS DIVISIONS ... 3
FIGURE 6: NET SALES BY DIVISION ... 3
FIGURE 7: INNOVATIVE MEDICINES TREATMENTS AREAS ... 3
FIGURE 8: SANDOZ TREATMENTS AREAS ... 3
FIGURE 9: CAT-T THERAPY PROCESS ... 4
FIGURE 10: BOARD OF DIRECTORS... 5
FIGURE 11: BOARD DIVERSITY ... 5
FIGURE 12: ECN MEMBERS ... 6
FIGURE 13: PESTEL... 7
FIGURE 15: GLOBAL GDP GROWTH ... 7
FIGURE 14: RELATIONSHIP BETWEEN HEALTH EXPENDITURE AND WEALTH ... 7
FIGURE 16: ADVANCED AND DEVELOPING ECONOMIES GDP GROWTH ... 8
FIGURE 17: PHARMACEUTICAL REVENUE GROWTH VS. GDP/CAPITA GROWTH ... 8
FIGURE 19: POPULATION GROWTH (2017-2030) ... 8
FIGURE 18: DRUG APPROVAL PROCESSES IN FDA VERSUS EMA ... 8
FIGURE20: DISTRIBUTION OF REVENUE ... 9
FIGURE 21: R&D-TO-SALES RATIO BY INDUSTRY ... 9
FIGURE 22: WORLDWIDE TOTAL PRESCRIPTION DRUG SALES (2015-2022) ... 9
FIGURE 23: POSITIVE AND NEGATIVE CONDITIONS ON DEMAND ... 10
FIGURE 24: POSITIVE AND NEGATIVE CONDITIONS ON SUPPLY ... 10
FIGURE 25: PORTER’S FIVE FORCES ... 12
FIGURE 26: NET SALES BY DIVISION ... 16
FIGURE 27: DSO, DIH AND DOP ... 17
FIGURE 28: SHORT-TERM DEBT TO TOTAL DEBT ... 17
FIGURE 29: DEBT-TO-EQUITY RATIO ... 17
FIGURE 30: NET DEBT ... 17
FIGURE 31: EBIT ... 19
FIGURE 32: PRICE TARGET ... 22
FIGURE 33: P&L FORECAST ... 23
FIGURE 34: PROFITABILITY RATIOS... 23
FIGURE 35: KEY RATIOS ... 23
viii
List of Tables
TABLE 1: MARKET PROFILE ... 1
TABLE 2: INVESTMENT RECOMMENDATION MATRIX ... 1
TABLE 3: VALUATION METHODS ... 1
TABLE 4: NOVARTIS AG FINANCIALS ... 1
TABLE 5: KEY NOVARTIS SHARE DATA ... 6
TABLE 8: NOVARTIS AG. RATING ... 10
TABLE 6: NOVARTIS AG FREE CASH FLOW ... 10
TABLE 7: NOVARTIS AG NET DEBT ... 10
TABLE 9: NOVARTIS AG. PEERS ... 11
TABLE 10: NOVARTIS AG. PEER GROUP ... 11
TABLE 11: DCF METHOD ... 13
TABLE 12: INVESTMENT RECOMMENDATION MATRIX ... 13
TABLE 13: MULTIPLES VALUATION METHOD ... 13
TABLE 14: GROWTH RATE FORECATED BY REGION ... 15
TABLE 15: INNOVATIVE MEDICINES WEIGHTS OF HISTORICAL NET SALES ... 15
TABLE 16: INNOVATIVE MEDICINES HISTORICAL NET SALES ... 15
TABLE 17: COGS IN NET SALES ... 16
TABLE 18: RORC HISTORICAL ... 16
TABLE 19: A/R AND NUMBER OF DAYS OUTSTANDING ... 16
TABLE 20: I/R AND DIH ... 17
TABLE 21: A/P AND DOP ... 17
TABLE 22: NET DEBT FORECAST ... 18
TABLE 23: DCF RESULTS ... 19
TABLE 24: EBIT FORECAST ... 19
TABLE 25: EBIT FORECAST ... 19
TABLE 26: EQUITY RISK PREMIUM ... 20
TABLE 27: DCF MAIN ASSUMPTIONS ... 20
TABLE 28: PRICE TO BOOK MULTIPLE ... 21
TABLE 29: PRICE TO SALES MULTIPLE ... 21
TABLE 30: EV/EBITDA ... 21
TABLE 31: MULTIPLES RESULTS ... 22
TABLE 32: PEER ANALYSIS ... 22
TABLE 33: PEERS MULTIPLES RESULTS ... 22
TABLE 34: PRICE TARGET WITH DIFFERENT WACC ... 26
TABLE 35: PRICE TARGET WITH DIFFERENT GROWTH RATE ... 26
TABLE 36: PRICE TARGET WITH DIFFERENT GROWTH RATE AND WACC ... 27
TABLE 37: PRICE TARGET WITH DIFFERENT BETA... 27
TABLE 38: PRICE TARGET WITH DIFFERENT TAX RATE ... 27
1
Price Target at December 31th, 2018: $89.52 Upside potential: 4.44%
Risk: Medium
Recommendation: Reduce
With this analysis, my recommendation for Novartis AG. investors is to Reduce by a price target of $89.52 that means an upside potential of 4.44% when compared with $85.72 at 2018, October 16th.
The price target was calculated through the Discounted Cash Flow valuation. To support this valuation method I used as well the Multiples Approach I reached a price target of $91.96 and an upside potential of 7.28%. Both valuation methods lead me to recommend to Reduce. This price target, above the current price makes the company undervalued at this time.
Concerning the Risk Assessment that I did I consider that Novartis AG has a Medium
Risk due to some huge factors this company has to face these days.
In what concerns to the key drivers of the profitability of the company, the main division of Novartis AG. is Innovative Medicines that brings to Novartis AG more than 2/3 of total net sales of the company. It’s expected that Novartis AG. revenues continues to grow in the next forecasted years with a growth rate of 2,36%.
It is predictable, by my valuation, that Novartis AG. continues to be one of the bigger pharmaceuticals companies, with higher profits in the next years. It is expected investments due the fact of the patents expiration of old blockbusters and the need of the launch of new blockbusters.
Table 4: Novartis AG Financials
Source: SC analysis, Millions of US Dollars.FY 2017 F2018 F2019 F2020 F2021 F2022 Perp. Revenues 49 109 49 805 50 980 52 182 53 413 54 672 56 061 Cost of Goods sold 17 175 16 436 16 823 17 220 17 626 18 042 18 500 Operating Expenses 23 305 22 835 23 374 23 925 24 489 25 067 25 703 EBIT 8 629 10 783 10 783 11 037 11 297 11 564 11 857
1. Research Snapshot
Figure 1: Net sales by division
Source: Novartis AG. Annual report
Table 1: Market Profile
Source: SC analysis Moody’s Rating A1 Price at 2018/10/16 $85.72 Price Target $89.52 Ticker NVS Industry PharmaceuticalPeer Group Pharmaceutical
Table 2: Investment
recommendation matrix
Source: BPI risk matrixLow Risk Medium Risk High Risk BUY >15% >20% >30% HOLD >5% and <15% >10% and <20% >15% and <30% REDUCE >-10% and <5% >-10% and <10% >-10% and <30% SELL <-10% <-10% <-10%
Table 3: Valuation Methods
Source: SC analysis DCF $89.52 Multiples $91.96 Risk Assessment Medium risk 67% 21% 12% Innovative Medicines Sandoz Alcon2
Novartis AG. (NVS) is a global healthcare company based in Basel, Switzerland,dedicated to develop new healthcare products in order to provide solutions both for patient and society’s needs. Novartis that counts with more than 150 years of history provides pharmaceuticals, generic drugs, over-the-counter drugs, vaccines and diagnostic tools.
This company was born in 1996 from the merge between Ciba-Geigy and Sandoz and nowadays is one of the largest pharmaceutical companies (see Figure 2), counting with over 126 000 employees around the world.
Innovation
Is predicted that biomedical innovation will continue to accelerate so that the continuous research of the molecular mechanisms of diseases combined with new and more targeted treatments will result on better outcomes for patients.
Digital technologies will lead the company in a new era of therapeutic assistances,
leaving behind the traditional medical treatment. Combining both medicines and digital technology the patients will benefit from an improved quality of care and treatment. The healthcare data analysis combined with statistical methods and artificial
intelligence (AI) provides a faster way in diagnose and patient treatment. The combo
of AI, data and doctor’s knowledge will result on a better access to the information of a patient and the whole medical data about the individual or even his family will be easily available, resulting in active prevention of diseases. All these factors will also improve drug research and development.
The digital innovation will lead us to a higher standard of efficiency in every medical field.
Aging of population
A developing world means people living longer(see figure 4) and fast urbanization, both factors resulting in lifestyles changes that are contributing to an increase of chronic conditions such as cardiovascular diseases, respiratory diseases and cancer. At the same time, many countries in the world want to expand their population access to healthcare. As a result of this increasing demand for healthcare, the spending in this area will grow at 4,3% between 2015 and 2020 according to IMF.
Government and health insurers are already increasing the use of generics, price cuts, and even controlling the access to some therapies. On the pharmaceutical industry side they are exploring new pricing models and delivering innovative treatments that lead to more benefits for the patients.
All of these concerns are in line with the company’s values (see figure 3).
Figure 2: Novartis AG. offices
Source: Novartis AG. data
Figure 3: Novartis AG. values
Source: Novartis AG. Annual report
Figure 4: Population pyramid,
EU-28, 2016 and 2080
Source: Eurostat
Solid color: 2080 Bordered: 2016 Blue: men - Orange: Women
valu es Innovation Quality Collaboration Performance Courage Integrity
2. Business Description
3
Company structure:
The Novartis Institutes for BioMedical Research (NIBR) is the tool of innovation and promotes the research of new medicines that that can change the medical practice as we know it.
The Global Drug Development (GDD) has the main function of estimate the potential new products in the company’s pipelines and choose the projects that maximize the value of the in-line products.
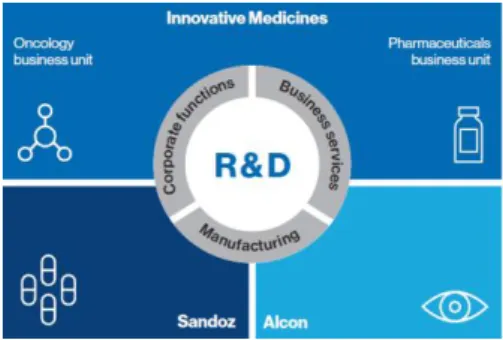
The Divisions (Figure 5):
Innovative Medicines represented more than a half of the net sales of Novartis in
2017(Figure 6). This division is formed by two core business units, Novartis Oncology business unit, which is more focused on treatments for a diversity of cancers and rare diseases, and Novartis pharmaceuticals, targeted on patented treatments in some other areas (figure 7). Novartis pharmaceuticals is the core business unit of the company, reaching 63% of the net sales of Innovative Medicines division.
Sandoz has the function to offer medicines and healthcare to the population and also
helps on expanding the access to these medical products in the whole world. In fact, this division has three global businesses, but the one that has the higher impact on Sandoz net sales is Retail Generics (figure 8).
Alcon is specialized on products and equipment for eye surgery and products for eye
care, mostly lens care solutions.
Novartis Operations:
Novartis Technical Operations (NTO) do the manufacturing of Innovative Medicines and Sandoz.
Novartis Business Services (NBS) oversee of financial services, human resources, information and technology, product lifecycle services, real state and management Company strategy:
Novartis believes that science and innovation are the key for an efficient strategy, allowing the discovery of innovative ways to improve and extend people’s lives. This company has identified some must have priorities in the most important nowadays areas of innovation, digital technology and scale.
Further strengthen innovation: Investing in research and development (R&D)
prioritizing innovation that produces change in the practice of medicine.
Drive a digital transformation: In all lines of business like R&D, sales and operation.
With an evidence in data analysis, artificial intelligence and other technologies in a way to extract a huge amount of information consolidated.
Growing areas of healthcare: Reinforce the presence in growing areas of healthcare
such as oncology, cardiology, ophthalmology, immunology and dermatology, and other medical fields. In terms of markets, Novartis plans to reinforce the presence in the US, Japan and in emerging markets such as China.
Figure 5: Novartis Divisions
Source: Novartis annual report 2017
Figure 6: Net sales by division
Source: Novartis AG. Annual report
Figure 7: Innovative Medicines
treatments areas
Source: Novartis AG. Annual report
Figure 8: Sandoz treatments
areas
Source: Novartis AG. Annual report
67% 21% 12% Innovative Medicines Sandoz Alcon Novartis Oncology •Cancers •Rare diseases Novartis Pharmaceuticals •Ophthalmology •Immunology and dermatology •Neuroscience •Repiratory •Cardio-metabolic 84% 11%5% Retail Generics Biopharmaceuticals Anti-infectives
4
Innovation:
The company is increasing her way to innovate using internal and external sources. In that way, the role on open innovation it’s getting bigger. They launched the Genesis Labs for their collaborators where they can form a team with an idea outside of the scope of the departments at NIBR and then present a pitch to a panel of scientists. The best projects will receive funding to and the collaborators moved from their previous jobs to the new project for a period between 6 to 18 months.
The company is inviting academic investigators to share information or ideas and then academic researchers have access to a discovery investigation and platforms while Novartis researchers can learn directly from them.
They are investing in new tools and technologies, for example, they are using an app to assist on the follow up of heart failure. The patients use a smart watch to track their physical activity, symptoms, sleep, and other parameters that might help to predict the deterioration of the condition. Novartis believes data-centered innovation and artificial intelligence will provide more efficiently treatments for neurological and immunological disorders or even cancers and other diseases.
Some key development projects have a huge potential to change the medical practice and improve patients outcomes:
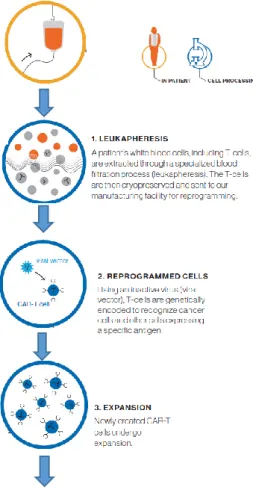
Immuno-oncology (see Figure 9): As cancer is considered to be the second most
common reason of death in the world, innovation and advanced treatments concerning this topic are, beyond doubt, one of the most important areas. The basics of CAR-T
therapies are taking T-cells (a specific type of white blood cell) and modify them
genetically to track down and destroy cancer cells, with minimal damage to normal cells. The most advanced CAR-T therapy, Kymriah, as already been approved by Food and Drug Administration.
Fatty liver disease, obesity and type 2 diabetes have become of huge significance to Novartis, due to their high prevalence in the population. Other treatments have been developed to fight asthma, malaria and other prevalent conditions.
Corporate Responsibility:
Concerning corporate responsibility, Novartis principles state that everyone should have access to healthcare. The company is turning its products more accessible with programs like Novartis Access, which provides treatment for chronic diseases in lower income countries. The company combines different methods involving products and funding along governments, nonprofit organizations, the company collaborators, and foundations that can provide access to healthcare and strengthen healthcare systems in these countries. Other corporate responsibility concern is fighting counterfeit medicines and provide health education and prevention.
Figure 9: CAT-T therapy process
Source: Novartis AG. Annual report
5
Corporate Governance:
The General Meeting of Shareholders has the main functions to approve financial and operational evaluation, financial statements (consolidated and Novartis AG.), fitting earnings and dividends, commend compensation of Board and Executive Committee, deciding about election of Board members, Chairman, Compensation Committee, external auditors. The company chooses an independent, non-executive Chairman and a separate CEO.
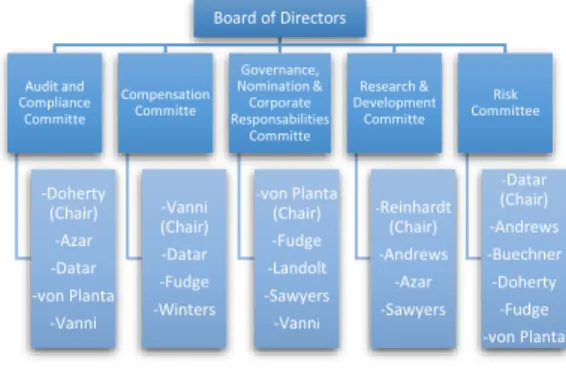
The Board of Directors:
The Board of Directors is composed by 13 non-executive and independent members (Figure 10) where Reinhardt is the Chairman and Vanni is Vice Chairman. The allocation of the board is made by five committee (Figure 10). The guidelines of the Board are direction, strategy, organization and administration of the company. The Board has meetings without the CEO and other Executive Committee members and with those as well. The diversity of the board, in terms of nationality, gender or even age (Figure 11) and of the Governance, Nomination and Corporate Responsibilities Committee (GNCRC) both represent significant points of efficiency and diversity.
Audit and Compliance Committee: In 2017, this committee worked on the issues of
reporting requirement such as accounting and compliance rules. Other topics were taken into account such as tax questions, compensation topics and the external auditors results and potential rotation.
Compensation Committee: The main topics in this committee last year were
conclusions about CEO succession, analysis of the Board and committee fees and possible variations, the repayment scheme of the Executive Committee and possible changes to the Annual Performance Plan.
Governance, Nomination & Corporate Responsibilities Committee: The
responsibility of this committee comprises on supervising the policies and procedures of the Board and its committees, recommending on Board committees and committee Chairmen, the planning for the Board, CEO succession, reviewing of company’s responsibilities such as the company’s performance in such areas as Environment, Society and Governance (ESG), giving special attention to ratings and indices.
Research & Development Committee: This committee has the main function to lead
the research and development projects in every medical area and is also responsible for all the innovation projects.
Risk Committee: This committee cares about data privacy, about the risks associated
with the change of operating model, risks related to Alcon, Novartis Technical Operations department, IT and supervision of patient and medical activities.
3. Management and Corporate Governance
Figure 10: Board of Directors
Source: Novartis AG. Annual report
Figure 11: Board Diversity
Source: Novartis AG. Annual report Board of Directors Audit and Compliance Committe -Doherty (Chair) -Azar -Datar -von Planta -Vanni Compensation Committe -Vanni (Chair) -Datar -Fudge -Winters Governance, Nomination & Corporate Responsabilities Committe -von Planta (Chair) -Fudge -Landolt -Sawyers -Vanni Research & Development Committe -Reinhardt (Chair) -Andrews -Azar -Sawyers Risk Committee -Datar (Chair) -Andrews -Buechner -Doherty -Fudge -von Planta 15% 8% 15% 24% 38%
Nationality
Dutch German British Swiss American 77% 23%Gender
Male Female 23% 23% 46% 8%Age
>65 61-65 55-60 <556
Management:
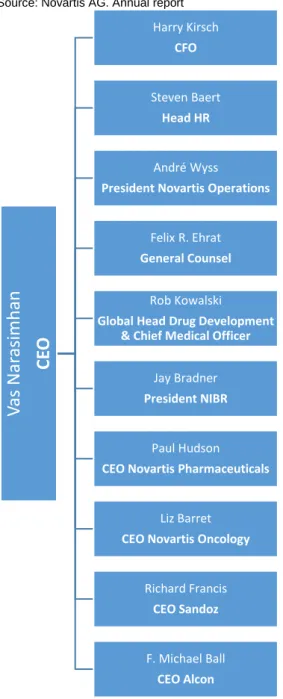
The Executive Committee:
The Executive Committee of Novartis (ECN) has the responsibility of overseeing the whole business operations of the group Novartis. This committee has to provide sufficient information to the Board, so they can perform its duty and make the right decisions. The ECN members (Figure 12) are selected by the Board of Directors.
Shareholder structure
The Shareholder structure at 31st Dec 2017 had a share capital of CHF 1,308,422,410 divided into 2,616,844,820 registered shares with a nominal value of CHF 0.50/share. The company’s shares are listed on the Swiss Exchange (SIX) and on the New York
Stock Exchange (NYSE) in the form of (ADRs) American depositary receipts,
which represents American depositary shares (ADSs). An ADR holder has the rights agreed in the deposit agreement like the right to receive dividends or even give voting orders. The ADS depositary of the company is JPMorgan Chase Bank that holds the underlying asset of ADRs, Novartis shares. JPMorgan is registered as a shareholder in the Novartis share records. ADR holders exercise their voting rights by instruction the JPMorgan to exercise that and each ADR represents one Novartis share.
The shares at the end of 2017 (Table 5) were listed at CHF 74.10 recording an increase of 11.2% when compared with the previous year. The ADRs has recorded the same trend with a growth of 15.3% in 2017. In result of that, the market cap at the end of 2017 was 195.5 B, making Novartis the biggest pharmaceutical in 2017 in terms of market cap.
Because the continuous good results, the Board proposed an increase of 2% in the dividend payment to CHF 2.80, in 2017.
Concerning the shareholder structure, the most of the shares are held by Nominees, fiduciaries and ADS depositary that represent 51.39% of the shares, and another portion by legal entities that own 35.25% of the shares. The shares are mostly held by Switzerland investors with 42.56% of the shares, United Kingdom and American investors with 22.22% and 25.82% of the shares, respectively.
Figure 12: ECN Members
Source: Novartis AG. Annual report
Table 5: Key Novartis Share data
Source: Reuters 2016 2017 Variance% Shares finished at CHF 82.40 CHF 74.10 + 11.2% ADRs USD 72.84 USD 83.96 + 15.3% Market Cap USD 172 B USD 195.5 B + 13.7%V
as
Na
rasimha
n
CE
O
Harry Kirsch CFO Steven Baert Head HR André WyssPresident Novartis Operations
Felix R. Ehrat General Counsel
Rob Kowalski
Global Head Drug Development & Chief Medical Officer
Jay Bradner President NIBR
Paul Hudson CEO Novartis Pharmaceuticals
Liz Barret CEO Novartis Oncology
Richard Francis CEO Sandoz
F. Michael Ball CEO Alcon
7
Macroeconomic Outlook:
Wealth:
Wealth, measured typically as GDP or GDP per capita, constitutes a significant driver for healthcare expenditures, which involves pharmaceuticals as a critical component. While in developed countries the average healthcare expenditures are between 10%-16.5% of total GDP, the least developed countries record 4.8%, in 2014 (Figure 14).
Figure 14: Relationship between Health expenditure and Wealth
Between 2014 and 2016 there was a reduction in terms of global GDP growth (Figure 15), directly influenced by the political and financial issues faced worldwide. For the following years, the Internal Monetary Fund predicts that the global GDP is going to increase between 3.4% and 3.8%, in response to this, the global economic outlook seems to be satisfactory.
Regarding advanced economies, it was registered a drop on GDP from 2014 to 2015, due to the impacts of deflation and large amounts of debt over quite a few countries, but for the coming years, the IMF forecasts these fluctuation will be around 1.8% (Figure 16).
For the same temporal range (2014-2015) emerging markets and developing
economies attended a negative growth due to the hyperinflation of some countries in
Latin America such as Venezuela that results on a recession of these countries. Because of GDP growth wealth growth has a positive shift as well mostly in advanced to economies, this leads us to a positive macroeconomic outlook for pharmaceutical industry (Figure 16). 0% 2% 4% 6% 8% 10% 12% 14% 16% 18% $0 $10,000 $20,000 $30,000 $40,000 $50,000 $60,000
Health expenditure, total (% of GDP) Health expenditure, public (% of GDP) GDP per capita
4. Industry Overview & Competitive Position
Figure 13: PESTEL
Political:
Access of public healthcare infrastructure Austerity politics: cost-cutting measures,
pressure on pricing freedom
Tax rates, social security contributions
Legal:
Patent law and industrial property rights Regulation standards in various fields
Economic:
Public and private wealth (GDP, GDP/capita)
Healthcare financing sources: taxes, social security contributions, employment
Technological:
Big Data and data analytics for personalized treatments
IoT and preventive healthcare, R&D
Social:
Population growth, but unequal distributed Aging of population
Increase in chronic diseases Sedentary lifestyles
Environmental:
Global warming Pollution and air quality
Figure 15: Global GDP Growth
Source: IMF, Growth in Percentage Pharma-Industry Environmental Political Legal Economic Technological Social 3.4 3.2 3.1 3.4 3.6 3.7 3.7 3.8 2.5 3 3.5 4
8
Population Growth:The population growth suggest a potential increase in pharma treatments. Nevertheless, must be paid attention to the unevenly growth distribution. While main potential pharmaceutical sales regions such as Europe and North America stagnate (-0.03% and 0.69%, respectively), population growth occurs in underprovided areas (Figure 16). Furthermore, the increase in population mean age leads to take longer
treatments that open new sales opportunities. High life expectations due to the
increase of population mean age is statistically correlated with grater propensity for
diseases. Joined with sedentary lifestyles, this leads to a huge occurrence of chronic
diseases.
Regulatory environment:
Political and regulatory forces are essential elements of the pharmaceutical industry. Governments sustain the public healthcare structure, which accounts 6% of expenditures when compared with world GDP and 60% of public expenditures versus 40% of private expenditures. This budget are under pressure due to world debt levels and austerity politics and results in pressure pricing and cutting off specific services. Additionally, internal regulator, Food and Drug Administration (FDA), in the U.S. and European Medicines Agency (EMA), in E.U. exercises a severely control in pharmaceuticals companies concerning several performance of key drivers like patent
laws, R&D approvals or even pricing.
In what concerns to a new drug approval FDA and EMA processes are very similar (Figure 18). Only after the approval of both regulators, Novartis can go further to the launch of new medicine or treatment.
Figure 18: Drug approval processes in FDA versus EMA
The expiration of a patent or licensing rights is a threatening obstacle of pharmaceutical industry. Each pharmaceutical company has a portfolio of patented products and these intellectual property rights has different expiration dates. Once the patent has expired, the company has no longer the exclusivity of their medicine and generic pharmaceuticals are completely able to produce resembling medicines and sell them for a more competitive price.
FDA
APPLICATION: application to the FDA for permission to conduct clinical studies and transport drugs across
states.
CLINICAL TRIALS PHASE: Phase 0 and 1 trials: small number of healthy subjects, clarify pharmacology and dose range Phase II trials: several hundred patients with the
target condition, to determine dose/reponse relashionship.
Phase III trials: several hundred to several thousand patients to show safety and efficacy.
New drug application to the FDA.
EMA
APPLICATION: application within one or more states of the E.U. for approval to conduct clinical studies; each state designates its own regulatory body that
will carry out approvals.
CLINICAL TRIALS PHASE: Phase 0 and 1 trials: small number of healthy subjects, clarify pharmacology and dose range Phase II trials: several hundred patients with the
target condition, to determine dose/reponse relashionship.
Phase III trials: several hundred to several thousand patients to show safety and efficacy.
4 Pathways to drug approval: 1. Centralized process through the EMA for
designated drugs.
2. Application to the designated national body within a single EU state.
3.Mutual recognition: after approval in a single state, application for mutual recognition in all states via the
EMA.
4. Decentralized process: simultaneous application in multiple EU states.
Figure 16: Advanced and
Developing Economies GDP growth
Source: IMF, Growth in Percentage
Figure 17: Pharmaceutical Revenue
Growth vs. GDP/capita growth
Figure 19: Population Growth
(2017-2030)
Source: United Nations
1.9 2.1 1.6 1.8 1.8 1.8 1.7 1.7 4.6 4 4.2 4.6 4.8 5 5.1 5.1 0 1 2 3 4 5 6 Advanced economies
Emerging market and developing economies
-10% -5% 0% 5% 10% 15% 20% 2002 2004 2006 2008 2010 2012 2014
Worldwide Revenue Growth of Pharmaceutical Markets Worldwide GDP / Capita Growth
2.37%
1.22%
0.96% 0.82% 0.72% 0.69%
-0.03% Africa Oceania World Latin
America and the Caribbean Asia North America Europe
9
Industry Overview and Key Drivers of Profitability:
The pharmaceutical industry plays a central role in making human life healthier, making a sustainable healthcare system, or even providing additional jobs. The largest pharmaceutical market, North-America, held a market share of 49% in 2016 of total revenue of pharmaceuticals, followed by Europe with a smaller share of 21.5% in the same period (Figure 20). The market with a bigger growth (+4.7% CAGR) from 2010 to 2016 was Africa, Asia and Australia.
The highest revenue is provided by “blockbuster-drugs” that represents 1$ billion of annual revenue and, this way, can cover huge R&D expenses. On pharmaceutical, block-buster drug is a medicine that generates sales of many millions for the firm that sells it.
This industry is the major leader in R&D when compared to other manufacturing industries. In United States, the pharmaceutical industry invests twelve time more per worker in R&D and has the highest CAGR in this type of investment. This industry is characterized by a massive R&D spending and huge growth rates. The R&D-to-sales ratio is the highest when compared with others manufacturing industries (Figure 21). The R&D process is long and risky, companies’ take an average of thirteen years to develop a new medicine with a probability of enter in the market of 1 in 10000. So, with a patent term of twenty years only left seven years of patent protection, effectively. After the expiration of the patent, cheap generics enters into the market making the prices go downward. Therefore, time-to-market is a key factor of success, the first to arrive the market with a new product can achieve from 40% to 60% of the market share. The second major pharmaceuticals cost drivers are Advertising and Selling, General and Administrative expenses due to promotions and sales representatives to convince doctors and hospitals to buy their products.
To face challenges like as the threat of generic competition or patent expirations, pharmaceuticals have solutions such as M&A projects to reduce the risk and expenses with R&D projects.
Demand and Supply:
The demand for medications can be measured by its prescription, provided by the doctors, and depends onthe economic trends already mentioned, like the increase of chronic diseases as a result of the aging of the population, sedentary lifestyles, rise of government expenditures and so on. The demand for medicines measured through Prescription is represented in Figure 22 where we can see a growth trend from 2015 to 2017, and a forecasted growth rate (CAGR) of 6.5% for the next years until 2022. This growth can be explained by the expansion of existing therapies as well new therapies.
On the demand side (Figure 23), there is a visible growth potential. Specifically in emerging markets and developing economies, there is a considerable rise in demand, leading to a growth in medium and long-term. The rise of generics will boost consumption and at the same time decreasing margins, while personalized treatments create new profitable customer needs. The actual growth of world population that leads to older and more sedentary citizens will result in more health complications in the future that provide an increase in the consumption of medicines and therapies. Another key driver of consumption is the increasing of chronic diseases like heart disease, cancer, diabetes and asthma. Due to all these factors, the consumption of medicines seems to be favourable on the Novartis outlook.
Figure20: Distribution of Revenue
Source: Thomson Reuters
Figure 21: R&D-to-sales ratio by
industry
Source: Thomson Reuters
Figure 22: Worldwide Total
Prescription Drug Sales (2015-2022)
Source: Pharma World Preview 2017, $bn.
49% 22% 17% 8%4% North America Europe Africa, Asia, Australia Japan LATAM 0.00% 2.00% 4.00% 6.00% 8.00% 10.00% 12.00% 14.00% 16.00% 18.00% 20.00% 0 200 400 600 800 1000 1200
10
On the supply side, the exchange rates can have a significant effect on profitability, costs and earnings as well as on companies’ balance sheet values. The volatility of the currencies can be hard to predict at the same time that can affect revenues and potential losses. Countries could be facing several economic or financial limitations like high inflation rates or high levels of debt that can impact the exchange of foreign currency. This represents a moderate risk for Novartis AG. In a way to mitigate this exposure to the exchange rates fluctuations firms can enter in hedging contracts. Other situations are equally important on the supply issues as we can observe on Figure 24.
The loss of exclusivity provided by the patent will lead to a huge supply of generics and this way, a price competition. So both outcomes are negative and positive, respectively. To mitigate the price competition of generics the R&D expenses tends to increase the innovative projects that will lead to a treatments more focused on patient. This will change the whole business model of pharmaceuticals.
Liquidity, cash flow and capital resources:
Novartis AG has a solid position taking into account the environment of the industry. The FCF (Free cash flow) amounted in 2017 was USD 10428 millions (Table 6), more 10% when compared with the previous year. This increase can be explained by lower legal payments and favourable working capital changes. The strong FCF, assets, easy
access to capital markets that allows the company to use credit seems favourable
to the liquidity requirements and a successful future.
Table 6: Novartis AG Free Cash Flow
Source: Company data(USD millions) 2017 2016 Change
Operating income 8629 8268 4,37%
Operating income adjusted for non-cash items
14761 15135 -2,47%
Cash flows from operating activities 12621 11475 9,98%
Free Cash flow 10428 9455 10,29%
On the other hand the company’s net debt increased 18.86%(Table 7) when compared with the previous year, reaching USD -19047 millions, mainly driven by an increase in borrowings.
The long-term credit rating remains with high quality investment grade by Moody’s, Standard & Poor’s and Fitch (Table 8). Due to this factors it’s not predictable any change in terms of liquidity needed.
Table 7: Novartis AG Net Debt
Source: Company data(USD millions) 2017 2016 Change
Total financial Debt -28532 -23802 19,87%
Total liquidity 9485 7777 21,96%
Net Debt on December, 31 -19047 -16025 18,86%
In terms of financing the cash flows used by Novartis AG in financing activities were USD 7733 millions in 2017, which increased when compared with USD 5314 millions in 2016. This increase result from the cash outflows from the payment of dividends (UDS 65000 millions) and from the net treasury transactions of USD 54000 millions and the cash inflows of non-current and current financials debts of USD 40000 millions. Peer Group Analysis:
Figure 23: Positive and negative
conditions on demand
Figure 24: Positive and negative
conditions on supply
Table 8: Novartis AG. Rating
Source: BloombergAgency Novartis AG. Shor-term credit
Novartis AG. Long-term credit
Moody’s P-1 Aa3
S&P A-1+ AA-
Fitch F1+ AA Macroeconomic -Unevenly distribuited population growth -Migration -Demographic changes -Growth of public and private health and associated overproportional healthcare expenditures -New markets via personalized treatments Industry -Patent expirations: Rise of generics Macroeconomic -Austerity politics -Tightening regulations -Patent law, R&D approvals and generics autorizations
Macroeconomic
-New markets via personalized treatments Industry -Patent expirations: Rise of generics Macroeconomic -Tightening regulations -Patent law, R&D approvals and generics autorizations
11
This point will be analysed in more detail when considering Multiples on the Relative
Valuation, due to the importance that comparing the performance of similar
companies have for investors. Novartis AG has many competitors in its business units. The main competitors are represented on table 9 ranked by net income. In terms of market share, Novartis AG has around 124% and in 2017 was outperformed in terms of net sales only by Johnson & Johnson and Roche Holding AG (Table 10). The position of Novartis AG. in terms of Market Cap it seems favourable to maintain the reputation of the firm like one of the biggest in the industry(Table 10).
The peer group involves 10 global pharmaceutical that belong to the biggest companies in the industry and are public traded. These companies are based in Europe and United States where they have their core business. One of the key strategies of these companies is to adjust its portfolios to make a successful block-buster drug and this way mitigate the huge costs and risks with R&D projects. Constant development strategies to follow this change of industry involve external investment like partnerships with other pharmaceuticals or technology companies, acquisitions of smaller pharma companies. Expand even more for emerging markets it’s another way to achieve other promising opportunities.
Competitive Position:
To understand the strategic situation and position in the market of Novartis AG. on external and internal approaches it is important conduct the SWOT analysis.
The analysis shows that Novartis AG. is facing a lot of strengths, weaknesses, opportunities, and threats. Most of them have already been spoken. A huge weaknesses is that there is an investigation about a possible corruption situation between Novartis Greek filial and some of greatest greek politicans.The increasing threat of losses in income due to patent expiration and generic competition or patent restrictions that can be overruled in China/India due that the missing of strong regulation like U.E. or U.S.A., affects Novartis and all the peer group in general. Some
Strengths
-Global distribuition channels in more than 140 countries
-M&A increased reputation -Employee strenght of over 126.000
-R&D strategy focus -2nd largest manufacturer of generics
Weaknesses
-Patent expiration losses of the major blockbuster (Gilenya)
-Potential problems in Indian patent laws due the enter on Indian market -Potential Greek filial corruption
involvement
Opportunities
-Emerging to underveloped countries -Entry barriers that keeps competitores
away
-Desiases like aging societies -Increasing healthcare awareness
Threats
-Generics cheaper solutions -R&D costs associated with failures of
projects
-Governmental Restrictions -Competition of China/India where patent
restrictions can be overruled -Potential economic slowdown
SWOT
Table 9: Novartis AG. Peers
Source: Reuters, USD millionsIdentifier Company
Name
Net Income
PFE.N Pfizer Inc 21 308
SASY.PA Sanofi SA 10 342
ROG.S Roche Holding
AG
9 321
BAYGn.DE Bayer AG 8 945
NOVN.S Novartis AG 7 703
MRK.N Merck & Co Inc 2 568
GSK.L GlaxoSmithKline PLC 2 126 JNJ.N Johnson & Johnson 1 300 BMY.N Bristol-Myers Squibb Co 1 007
LLY.N Eli Lilly and Co -204
Average 6442
Table 10: Novartis AG. Peer Group
Source: Reuters, USD millionsCompany Name Market Cap ($M) Net Sales ($M) Market share Price Close Johnson & Johnson 354 967 76 450 19,0% 133,06 Pfizer Inc 216 387 11 502 2,9% 36,58 Novartis AG 215 825 50 135 12,4% 82,03 Roche Holding AG 209 299 54 705 13,6% 232,08 Merck & Co Inc 147 751 40 122 10,0% 55,25 Bristol-Myers Squibb Co 108 779 20 776 5,2% 66,25 Sanofi SA 101 357 43 430 10,8% 81,49 Bayer AG 97 764 42 004 10,4% 116,69 GlaxoSmithKline PLC 90 611 40 787 10,1% 18,27 Eli Lilly and Co 85 993 22 871 5,7% 78,75
12
companies react to this faster than others, Novartis is expected to suffer severely from upcoming patent expiration of major blockbuster drugs like “Gilenya”. Novartis AG. follows an intense M&A-strategy which enables market leadership in certain areas. Porter’s Five Forces Analysis (Figure 25):
To analyse the competitive environment and dynamics of the industry, I choose to use the Porter’s Five Forces framework. This methodology allows us to establish how certain conditions impact the profit structure of the industry by determining the way in which economic value is created.
Rivalry among existing competitors (HIGH):
This aspect is presumably the strongest force driving the pharmaceutical industry, which is characterized by its mature stage and a heavy consolidation trend (M&A). Companies that want to gain a competitive advantage not only need to surpass others in developing blockbusters but also make aggressive and defensive strategies. Furthermore, the increased innovation pressure and shift to niche markets forces pharmaceutical companies to enter strategic partnerships with biotech companies which are one of the most important types of collaboration and potential sources of breakthrough innovation.
Bargaining power of buyers (MEDIUM):
The strongest power may be exerted by pharmacies and healthcare insurance agencies satisfying subscriptions, however they rarely act in the interest of a patient as their focus is to maximize margins. Doctors entitled to prescribe drugs have significant influence on patients purchase behavior but must act within legal restrictions. Furthermore, patients are more aware of generics as cheap alternatives to branded-drugs, which results in increasing cost-sensitiveness.
Bargaining power of suppliers (LOW):
Impact of suppliers on the industry’s shape is relatively low. They are divided into three categories: suppliers of raw materials, biotechnology companies and manufacturers. Even though they have special knowledge in many areas, this is rarely enough to offset redundant supply forces. Raw materials are usually widely used in chemical-industry and pharmaceutical companies have virtually unlimited access to them. Regarding equipment, pharmaceutical companies have multiple sources available and can obtain products from several suppliers and even in case of more advanced needs they can negotiate favorable deals.
Threat of new entrants (LOW):
High entry barriers resulting from huge R&D investments, huge capital requirements and a complex approval process block the entrance of new competitors and enable a high profitability of the market participants. Moreover, there are significant R&D. SG&A and advertising economies of scale to be realised, giving rise to an ongoing M&A-consolidation, rather than new individual players in the market.
Threat of substitutes (HIGH):
This category comprises generics, and biologics. Substitutes such as alternative therapies or medical devices are minors’ threats but have been gaining popularity. Since high quality of the generics provides the same treatment effects as brand drugs at a significance lower price, they pose a significant threat as substitutes. Furthermore, developments in areas such as bioscience with the goal to directly alter and develop DNA sequences of an organism will at some point become a major shaping force of the industry.
Figure 25: Porter’s Five Forces
0 1 2 3 4 5 Threat of new entrants Rivalry Bargaining power of suppliers Bargaining power of buyers Substitutes
13
In my analysis through the Discounted Cash Flow method (DCF) I reached a price target of $89.52 (Table 11) representing an upside potential of 4.44% comparing with the price at 2018 October 16th ($85.72). With a Medium Risk valuation lead us to a recommendation to Reduce (table 12). Also another analysis that I made was the
Multiples Valuation Approach to support the previous recommendation in which I
reached an average price target of $91.96 and consequently an upside potential of
7.28% (Table 13).
Investment Risks:
Already mentioned in this analysis some of the most dangerous risks for Novartis AG, and also for the whole industry. Nevertheless, in this point I will go further in some of the key risks that can’t be controlled by management.
Expiration of patents and exclusivity of the products
As seen previously all of the pharma companies, including Novartis AG. face the competition of generics because it’s cheaper to the buyers. Many of Novartis AG. products are secure by patent or property rights. The loss of any of these rights causes a negative impact on the results of the firm, mainly in net sales, and when we talk about major pipeline products this impact can be huge.
Deliver new products
The ability to keep and grow the performance of the industry to face generic and other competition is influenced a lot by R&D projects in recognizing and developing new treatments. So this process is long and risky due to the time of intellectual property rights versus the time it takes to develop and launch the product.
Success of key products
All of the products pipeline faces strong competition of new replaceable products from competitors. Patients and other clients have the power to choose which product or treatment to buy in terms of costs, efficacy or other indicator. So commercial success of major products has an important role in the company’s performance.
Refund and pricing
Governments and clients in general continue to increase the healthcare costs due to, for example, the rise of average age that result in increase of chronic diseases. Factors such this have increased the pressure they face concerning the price at which medicines are sold and how to establish good refund rates by insurance companies, governments and other payers.
Foreign exchange oscillations
This company has subsidiaries in many countries with different currencies. So, each subsidiary has to adjust its reporting (STAT) on its currency to US dollar (USGAAP). Oscillations between currency of reports (USD) and other currencies can have an impact on the adjustments of reported balance sheet (sales), income statement(gains and losses) and cash flow.
Intangible assets and goodwill
Novartis AG. has an huge value of goodwill mainly because acquisitions of Alcon and oncology assets from GSK. Due to this, changes in impairments between Novartis AG. values and regulatory reviews may have impacts on operational results and financing situation of the firm.
IT and data security
5. Investment Summary
Table 11: DCF method
Equity value 213 561 Net debt 17 639 Shares outstanding 2 386 Price at 16/10/2018 $85.72 Price target $89.52 Upside potential 4.44%Table 12: Investment
recommendation matrix
Low Risk Medium Risk High Risk BUY >15% >20% >30% HOLD >5% and <15% >10% and <20% >15% and <30% REDUCE >-10% and <5% >-10% and <10% >-10% and <30% SELL <-10% <-10% <-10%Table 13: Multiples Valuation
approach
Multiples analyzed Price Target EV/EBITDA $90.49 P/B $96.31 P/Sales $89.08 Average Price Target $91.96 Upside potential 7.28%14
Cybercrime is a new reality that all of the companies face at this time. Novartis AG. is no exception, and has a deeply dependence of IT systems to help the business processes to store data. Internet, clouds and other IT tools are susceptible to hacking.
Business models transformation
Fast development of the digital technologies, IoT that has a huge impact on business models and is causing enormous transformations in a lot of industries while leaving others uncompetitive.
15
Income Statement or P&L (Profit and Losses):
Net Sales
The company’s total net sales were $49 109M in 2017 which were composed by sales and services of Innovative Medicines, Sandoz and Alcon divisions.
These Net Sales were divided by region of the world (Figure 14). The Novartis AG. total net sales were forecasted to rise at a CAGR (compound annual growth rate) of 2,36% for the forecasted years. This growth rate is a merge of different GDP growth rates by regions and considering the weight of net sales of these countries in the total net sales of the company (Table 14).
Innovative Medicines:
To make projections about this item of the income statement, one of the most important, I had to look a little deeper to the pipeline of the products of the company and understand which products have more and less weights, which products are close of the patent expiration, which products have potential to be the next blockbuster of Novartis AG and so on.
If we take a look on the historical Innovative Medicines net sales we can conclude the past blockbusters drugs, Gleevec and Lucentis, they had a decline in net sales (table 15 and Table 16) and so on in growth rate of them (Table 15 and Table 16) since 2016 and 2015, respectively. It is expected that the trend of these medicines net sales continue until the next few years, since in 2016 Gleevec patent expired and 2020 Lucentis patent will expire.
According news published by Reuters (January, 24th) from Novartis executives the potential next blockbuster in the near future are Consentyx, Entresto and other new drugs launched since 2014 and 2015. Consentyx is from Immunology and Dermatology area of medicine and has had remarkable results in what concerns to the psoriasis and psoriatic arthritis inflammation. This success is visible in the net sales of this drug, with a growth rate in the last year of 4.22% (Table 15 and Table 16), being the second drug with more weight in the total net sales of Innovative Medicines. Entresto had an huge potential to become one of the next blockbuster due to the specifications of this medicine in heart failures. The life of these medicines starts after 2014 so they have an huge potential to growth in the next years (Appendix I). These are the main assumptions that I take to forecast the net sales of Innovative Medicines since more than 60% of the net sales become from this division I had to go deeper in my research on the projections of the company to each medicine.
Sandoz and Alcon:
Sandoz and Alcon, due to the lower weight on the net sales (Figure 26) I based my calculations for their net sales on the average of historical weights of each division in the total net sales. As we can see in the figure 26, last year Alcon had an weight in the total net sales of 12%, Sandoz 21% and Innovative Medicines 67% (Figure 26). The Appendix I contains more detail about the net sales forecast to each product of the company pipeline and from each division of the business.
6. Forecasts: Financial Statements
Table 14: Growth Rate forecasted by
region
Source: IMF and SC analysis
Table 15: Innovative Medicines
weights of historical net sales
Source: SC analysis FY 2014 FY 2015 FY 2016 FY 2017 IM: 60,65% 67,45% 67,11% 67,25% Gleevec 9,05% 9,42% 6,85% 3,96% Lucentis 4,66% 4,17% 3,78% 3,84% Consentyx 0,53% 2,32% 4,22% Gilenya 4,73% 6,29% 6,41% 6,49% Galvus 2,34% 2,31% 2,54% 2,43% Entresto 0,04% 0,35% 1,03% -Promacta 0,81% 1,31% 1,77% -Tafinlar 0,92% 1,39% 1,78% -Others 39,88% 42,96% 42,16% 41,74%Table 16: Innovative Medicines
historical net sales
Source: SC analysis FY 2014 FY 2015 FY 2016 FY 2017 IM: 31 791 33 345 32 562 33 025 Gleevec 4 746 4 658 3 323 1 943 Lucentis 2 441 2 060 1 835 1 888 Consentyx 261 1 128 2 071 Gilenya 2 477 3 109 3 109 3 185 Galvus 1 224 1 140 1 233 1 193 Entresto 21 170 507 Promacta 402 635 867 Tafinlar 453 672 873 Others 20 903 21 241 20 457 20 498
Country Nova rti s Net
s a l es % l a s t (g) 3y Avera ge per Country Europe 17 492 35,62% 1,6% 0,57% US 16 935 34,48% 2,2% 0,76% As i a /Afri ca 10 718 21,82% 4,2% 0,92% Ca na da /La ti n Ameri ca 3 964 8,07% 1,4% 0,11% Worl d 49 109 100,00% 3,3% 2,36%
16
Cost of Goods Sold (COGS), R&D, Marketing & Sales and Other expensesFor these Income Statement items (expenses with an weight of more than 15% of the total net sales) I made an assumption of more efficiency in general. In terms of cost of goods sold I believe that it will be increase in line with the increase of net sales (Table 17). With the innovation of technologies stated above, the research and development of new medicines is now faster than ever and more animal friendly, for example, since the animal tests are being replicable in robots. With the advance of innovation through, for example, new innovative ways to do marketing & sales in pharmaceuticals with robotic and big data analysis they can reach faster potential clients and close businesses. The remain expenses had a less weight (Table 17) in the total net sales so the forecast of them are calculate through the average historical weight to sales. Since pharmaceuticals spend a lot in R&D it is good to take a look on return on research capital ratio (RORC). The general formula used for compute this ratio is:
𝑅𝑂𝑅𝐶 = 𝐶𝑢𝑟𝑟𝑒𝑛𝑡 𝑌𝑒𝑎𝑟 𝐺𝑟𝑜𝑠𝑠 𝑃𝑟𝑜𝑓𝑖𝑡 𝑃𝑟𝑒𝑣𝑖𝑜𝑢𝑠 𝑌𝑒𝑎𝑟 𝑅&𝐷 𝑒𝑥𝑝𝑒𝑛𝑑𝑖𝑡𝑢𝑟𝑒𝑠
This ratio gives us an idea of how successfully the company is working to transform the previous year R&D expenditures into current year gross profit. On table 18 are the historical and forecasted RORC, for examples, for every $1 Novartis Company spent on Research and Development, they achieved a return of $3.65 in gross profit (2017). Balance Sheet:
Assets Goodwill
Due to the newest acquisition by Novartis AG of the AveXis gene therpy that would be closed at the end of this year, the forecast of the goodwill wouldn’t be stable. So due to the projections of the company in bets the number one pharmaceutical in gene therapy, I predicted a growth over the next years.
Accounts Receivable
To forecast the first item to be forecasted of the working capital, I’ve calculated the historical Accounts Receivables turnover ratio (A/R) that measures how efficient a company can be in the use of its assets in each period of one year.
The general formula used to compute this ratio was: 𝐴𝑅 𝑡𝑢𝑟𝑛𝑜𝑣𝑒𝑟 𝑟𝑎𝑡𝑖𝑜 = 𝑆𝑎𝑙𝑒𝑠(𝑡)
𝐴𝑐𝑐𝑜𝑢𝑛𝑡𝑠 𝑅𝑒𝑐𝑒𝑖𝑣𝑎𝑏𝑙𝑒(𝑡) + 𝐴𝑐𝑐𝑜𝑢𝑛𝑡𝑠 𝑅𝑒𝑐𝑒𝑖𝑣𝑎𝑏𝑙𝑒(𝑡 − 1) 2
And with this ratio I’ve calculated the number of days sales outstanding (DSO) that means how long it takes to Novartis AG collect its receivables(Table 19).
The general formula used to compute this ratio was:
𝐷𝑆𝑂 = 365
𝐴𝑐𝑐𝑜𝑢𝑛𝑡𝑠 𝑟𝑒𝑐𝑒𝑖𝑣𝑎𝑏𝑙𝑒 𝑡𝑢𝑟𝑛𝑜𝑣𝑒𝑟 𝑟𝑎𝑡𝑖𝑜
After the historical ratio calculated I used this ratio to predict the future Accounts Receivables item in the Balance Sheet.
Figure 26: Net sales by division
Source: SC analysisTable 17: COGS in Net Sales
Source: SC analysisTable 18: RORC historical
Source: SC analysis2015 2016 2017 2018F 2019F 363% 357% 365% 383% 415,82%
Table 19: A/R and Number of days
outstanding
Source: SC analysis Historical average A/R 5,72 DSO 63,99 0 10000 20000 30000 40000 50000 60000Innovative Medicines Sandoz Alcon
0 10,000 20,000 30,000 40,000 50,000 60,000 2015 2016 2017 2018F 2019F 2020F 2021F 2022F Per p etu ity
17
InventoriesInventory was forecasted in a similar way to accounts receivables, but instead of using A/R turnover ratio I used Inventory turnover ratio that measures how many times an inventory is sold in a period of one year.
The general formula used to compute this ratio was:
𝐼𝑛𝑣𝑒𝑛𝑡𝑜𝑟𝑦 𝑡𝑢𝑟𝑛𝑜𝑣𝑒𝑟 𝑟𝑎𝑡𝑖𝑜 = 𝐶𝑂𝐺𝑆(𝑡)
𝐼𝑛𝑣𝑒𝑛𝑡𝑜𝑟𝑖𝑒𝑠(𝑡) + 𝐼𝑛𝑣𝑒𝑛𝑡𝑜𝑟𝑖𝑒𝑠(𝑡 − 1) 2
And with this ratio I’ve calculated the number of days of inventory on hand(DIH) that means how long it takes to Novartis AG to sell his inventory(Table 20).
The general formula used to compute this ratio was:
𝐷𝐼𝐻 = 365
𝐼𝑛𝑣𝑒𝑛𝑡𝑜𝑟𝑦 𝑡𝑢𝑟𝑛𝑜𝑣𝑒𝑟 𝑟𝑎𝑡𝑖𝑜
After the historical ratio calculated I used this ratio to predict the future Inventory item in the Balance Sheet.
Remain assets items
The remain forecasted accounts of assets were calculated through an average growth rate of the last 7 years and their weight on total assets. Some items were calculated in the same way but with an average of less years than the historical, due to the acquisition of Glaxo Oncology in 2014 that I assume an outlier in these growth rates.
Liabilities
Accounts Payables
To forecast this account the method that I used was quite similar to the accounts receivables. I’ve calculated the historical Accounts Payables turnover ratio (A/P) that measures how many times a company can pay its payables in each period of one year. The general formula used to compute this ratio was:
𝐴𝑃 𝑡𝑢𝑟𝑛𝑜𝑣𝑒𝑟 𝑟𝑎𝑡𝑖𝑜 = 𝐶𝑂𝐺𝑆(𝑡)
𝐴𝑐𝑐𝑜𝑢𝑛𝑡𝑠 𝑃𝑎𝑦𝑎𝑏𝑙𝑒𝑠(𝑡) + 𝐴𝑐𝑐𝑜𝑢𝑛𝑡𝑠 𝑃𝑎𝑦𝑎𝑏𝑙𝑒𝑠(𝑡 − 1) 2
And with this ratio I’ve calculated the number of days of payables (DOP) that means how long it takes to Novartis AG pay back to his vendors (Table 21).
The general formula used to compute this ratio was:
𝐷𝑂𝑃 = 365
𝐴𝑐𝑐𝑜𝑢𝑛𝑡𝑠 𝑃𝑎𝑦𝑎𝑏𝑙𝑒𝑠 𝑡𝑢𝑟𝑛𝑜𝑣𝑒𝑟 𝑟𝑎𝑡𝑖𝑜
After the historical ratio calculated I used it to predict the future Accounts Payables item in the Balance Sheet.
Analyzing the average of days sales outstanding and days of payables we can conclude that Novartis AG. can reach a good leverage due to the fact of days of payables are almost twice of days of receivables. So the sellers are financing the activity of Novartis AG (Figure 27).
Table 20: I/R and DIH
Source: SC analysisHistorical average I/R 2,70
DIH 136,50
Table 21: A/P and DOP
Source: SC analysisHistorical average A/P 3,21
DOP 114,54
Figure 27: DSO, DIH and DOP
Source: SC analysisFigure 28: Short-term debt to total
debt
Source: SC analysis
=𝒇𝒊𝒏𝒂𝒏𝒄𝒊𝒂𝒍 𝒅𝒆𝒃𝒕𝒔 𝒂𝒏𝒅 𝒅𝒆𝒓𝒊𝒗𝒂𝒕𝒊𝒗𝒆𝒔 𝒕𝒐𝒕𝒂𝒍 𝒅𝒆𝒃𝒕
Figure 29: Debt-to-equity ratio
Source: SC analysis=𝑺𝒉𝒐𝒓𝒕 𝒕𝒆𝒓𝒎 𝒅𝒆𝒃𝒕 + 𝑳𝒐𝒏𝒈 𝒕𝒆𝒓𝒎 𝒅𝒆𝒃𝒕 𝑻𝒐𝒕𝒂𝒍 𝑬𝒒𝒖𝒊𝒕𝒚