Article
Printed in Brazil - ©2017 Sociedade Brasileira de Química0103 - 5053 $6.00+0.00*e-mail: [email protected]
Strategy for Correction of Matrix Effect on the Determination of Pesticides in
Water Bodies Using SPME-GC-FID
Vitor P. A. Silva,a Mário S. O. Paz,a Rivelino M. Cavalcanteb and
Ronaldo F. Nascimento*,a
aDepartamento de Química Analítica e Físico-Química, Centro de Ciências,
Universidade Federal do Ceará, 60455-760 Fortaleza-CE, Brazil
bInstituto de Ciências do Mar, Labomar, Universidade Federal do Ceará,
60165-081 Fortaleza-CE, Brazil
This paper investigates a strategy as a quality control parameter, using standard surrogate and determination of a relation factor for determination of parathion-methyl, chlorpyriphos and cypermethrin pesticides in environmental aqueous matrices with distinct characteristics (river water, estuarine, seawater and weir water), using the technique of solid phase microextraction gas chromatography with flame ionization detector (SPME-GC-FID). Pesticides were very susceptible to matrix effects promoted by environmental samples. The salinity and the organic matter seem to have been the main sources of interference in the method. For chlorpyriphos, in middle and high levels, the values of relation factor (Rf) for estuarines, seawater and weir matrices were statistically similar. For cypermethrin, the statistical equality occurred in estuarine matrices in medium and high levels of concentration. That indicates proportional behavior between the pesticide and the surrogate recovery, suggesting that a single value of Rf can be used as correction factor recovery for any of these matrices.
Keywords: correction of matrix effect, pesticides in estuarine, pesticide analysis by SPME-GC-FID, methyl-parathion, relation factor
Introduction
The abusive use of pesticides in agricultural production may be responsible for the contamination of food, soil and water. The occurrence of herbicide residues in natural waters may present a risk to water resources with a negative
impact on aquatic life.1-3 The pesticides may trigger
ecotoxicological problems acting as endocrine disruptor.4
Therefore, the concern and monitoring of pesticide residues in aqueous environmental matrices is necessary.
The technological advances of the analytical instrumentation have provided a great simplification to implementing of the methods of analysis. For example, eliminating laborious steps in the sample preparation
prior to analysis.5,6 However, the procedures of sample
preparation still represent an obstacle to development
of an efficient analytical method.7 The constituents or
coextractives which are present in the sample, be food
or environmental,8-10 may be responsible for promote
the imprecision and/or inaccuracy in quantification of the species of interest, such as pesticides. This type of interference is known as matrix effect.
The matrix effect is a type of interference generated by combination of all other sample components which decrease or increase the analytical signal detected, and
directly affects the analyte quantification of interest.11-16
This can affect the precision and accuracy of the method. Strategies have been proposed to minimize or eliminate the problems of matrix effect.17-20 Furthermore, also should
be considered the problems involving injection techniques, coated inlet liners, labeled internal standards, extensive sample cleanup, GC priming, compensation factors and
matrix matching and surrogate standard.21,22
The standard surrogate (SS) is a pure compound with similar physical and chemical characteristics of the target analyte (e.g., same substance, but isotopically modified) spiking to the sample to be analyzed. The surrogate amount recovered is used in the calculation of the recovery factor
(%Rss), and this factor is applied to correct the target
concentration is made through the recovery of the surrogate standard. This method is very useful when it does not have
a certified reference material (CRM).22
As mentioned, it is important that the standard surrogate has chemical behavior similar to the target analyte. However, may occur the unavailability of such compound.
This work investigated a strategy as a quality control parameter (QC), using standard surrogate with physical and chemical characteristics different of the analytes of interest, to minimize the effect matrix in the determination of pesticides, by solid phase microextraction gas chromatography with flame ionization detector (SPME-GC-FID), in environmental aqueous matrices with different characteristics: river water, estuarine, seawater and weir water.
Experimental
Chemical and reagents
The pesticides parathion-methyl (95%), chlorpyriphos (98%) and cypermethrin (96%) were ceded by Nufarm (Maracanaú, Ceará), and used to prepare five mix stock solutions in varied concentrations.
Each stock solution was used to prepare, respectively, a point of the calibration curve by fortification of pure water and environmental samples in vials. It was used 35 mL of water and 35 µL sample mix solution. Thus, it remained constant volume of solvent added to five levels of concentration of the calibration curve.
The concentration of the standard solutions varied of 100 to 500 µg L-1 for parathion-methyl, 5 to 300 µg L-1 for
chlorpyriphos and 5 to 100 µg L-1 for cypermethrin, which
corresponded to a linear range study. The azobenzene (99%) (Sigma-Aldrich, St. Louis, USA) was used as a standard surrogate (SS) in extractions being employed in
all solutions at 100 µg mL-1. The standard mix and of the
recovery solutions were prepared in acetone (Vetec, grade HPLC-UV) due to efficiency of solubilization. Nonpolar solvents were avoided because they cause damage to the fiber. Ultra pure water, obtained by Milli-Q® system (São Paulo, Brazil) was used in other procedures.
Sampling
Water samples used in this study were collected from the Ceará river, in Caucaia and weir Santo Anastácio, in Fortaleza, both in Ceará State, Brazil. The samples from the Ceará river were collected at four different points reaching the river zone to estuary. The weir samples were collected at a point near its margin. Thus, water samples with distinct characteristics were investigated. The values of pH, salinity and total organic carbon (TOC) dissolved are described in Table 1.
The samples were stored in glass bottles and refrigerated at 4 °C for further filtering in PTFE membrane with porosity of 0.45 µm and recovery studies using SPME.
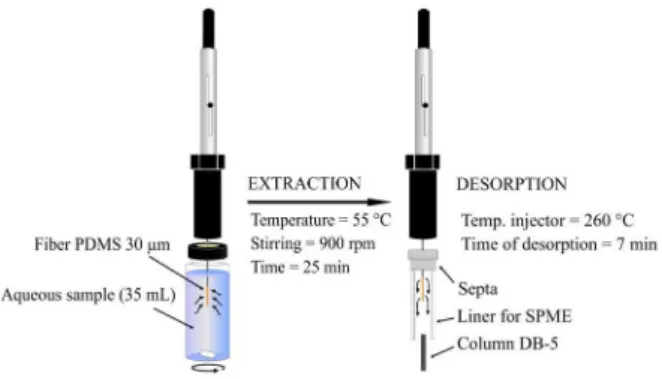
Method of extraction
In SPME experiments were used fibers with the PDMS (polydimethylsiloxane) coating, 30 µm (Supelco). This polymer, with nonpolar characteristics, is widely used in pesticide analysis in aqueous matrices and demonstrated satisfactory results in many extractions of organochlorine
and organophosphate, as well as pyrethroid.24-27 The
extraction was performed by direct mode, using 35 mL of solution, 25 minutes for extraction time, stirring at 900 rpm and temperature 55 °C. Preliminary extraction tests were performed at room temperature, but the best results were obtained at 55 °C.
The Figure 1 summarizes the steps of the process of extraction and desorption in the injector.
Table 1. Physicochemical parameters of samples
Parameter Water sample
River Estuary P1 Estuary P2 Seawater Weir
pH 7.35 8.14 8.21 8.33 8.08
Salinity / % 0.67 14.13 24.61 35.69 0.46
TOC / (mg L-1) 24.72 17.56 23.69 12.54 28.92
TOC: total organic carbon.
The samples of pure water used in verification of method performance and environmental samples were fortified with 35 µL of the standard solution that varied of 100 to 500 µg L-1 for parathion-methyl, 5 to 300 µg L-1 for
chlorpyriphos and 5 to 100 µg L-1 for cypermethrin. The
surrogate standard (azobenzene) was added for all solutions at 100 µg mL-1.
A blank solution (pure water) was prepared to investigate possible losses to the glass walls of the container. Also was not observed the formation of precipitates at pH studied.
Analytical conditions
Chromatographic analysis were carried out using a Shimadzu gas chromatograph (GC17) with a flame ionization detector (FID). The system was equipped with a capillary column DB-5 (Agilent J&W, 30 m, 0.25 mm i.d., 0.25 µm film thickness). The GC oven was operated with the following temperature program: initially at 60 °C held
for 2 min, followed by a ramp of 15 °C min–1 to 300 °C
and then held for 6 min. The injection port was at 260 °C in splitless mode, and the detection was carried out at 300 °C. Hydrogen 4.5 FID (White Martins) was used as carrier gas
at constant flow rate of 1.2 mL min-1.
Validation parameters
The performance of the extraction method was evaluated for linearity, sensibility, repeatability, limits of detection and quantification, recovery and matrix effect. The quantitation of the analytes was performed by external standard. A procedure for adjustment of the calibration curve was also used to allow a better prediction of the concentration of analytes in real samples.28 Thus, sensitivity
and limits of detection and quantification were recalculated based on the corrected curve.
The limits of detection (LOD) and quantification (LOQ)
were calculated using the equation: LOD = 3sblank / m and
LOQ = 10sblank / m, respectively, where sblank is the standard
deviation of the three blank concentration values and m is the slope of the calibration curve.
To assess the recovery and matrix effect, the aqueous samples were spiked with standard mix of pesticide, in three concentrations levels, and surrogate standard azobenzene in concentration constant. Always been added 35 µL for both.
The recovery percentages (R(%)) for pesticides and azobenzene (SS) were determined according to the equation 1.
(1)
From the R(%) value obtained, the correction of the analyte concentration can be made on a sample by equation 2:
(2)
However, with the use of surrogate standard for correction of pesticide concentration, R(%) value is now
called Rss(%). Since the standard surrogate investigated
(azobenzene) has physicochemical properties different of the pesticides investigated, it is necessary to calculate a relation between these compounds. This relation is called relation
factor (Rf). It represents a correction or adjustment due to
different chemical behavior between these compounds in the matrix relative to extraction by the analytical method. The Rf is calculated by the ratio of recoveries of the pesticide (R)
and the recovery of surrogate standard (Rss).20
Thus, the correction of the analyte concentration using a surrogate standard of different chemical class and its
respective Rf value can be obtained by equation 3:
(3)
To evaluate the influence of the aqueous matrix by SPME analysis, was used the F-test (Fisher-Snedecor) (95% confidence level), to assess the homogeneity of variance between peak areas of pesticides in pure water (degrees
of freedom, υ = 2) and environmental water (degrees of
freedom, υ = 2) in three recovery levels. Thus, can be
checked if the environmental aqueous matrix affect the
accuracy of the method.29
In the case where the constituents of the matrix does not affect the accuracy of the results obtained (Fcalculated < Fcritical),
the standard deviations (s) of two analysis groups were
grouped for obtained standard deviation combined (scomb) (equation 4), for application of the Student’s t-test
(equation 5). N is the number of points of the curve.
(4)
(5)
The t-test allowed the evaluation of statistical equality
In cases where, for a given level of fortification, the variances of the two sample groups (pure water and environmental samples) were statistically different (Fcalculated > Fcritical), the matrix effect was evaluated by
Student’s t-test using equation 6, and the number of degrees
of freedom (ν) was obtained by equation 7:
(6)
(7)
Results and Discussion
SPME-GC-FID method
SPME is an extraction technique that stands out for its simplicity in terms of sample treatment because there is no need for the sample to pass through a rigorous clean-up and avoids the use of organic solvents.30,31 Its use is widespread
in many analytical applications, such as environmental analysis,32-34 food,35-40 aromatic,41-43 forensic44-46 and
pharmaceutical.47-49 Also, low detection limits can be
easily reached with this technique due to their ability in
preconcentration of analytes,50 since it uses a polymeric
coating which favors extraction.
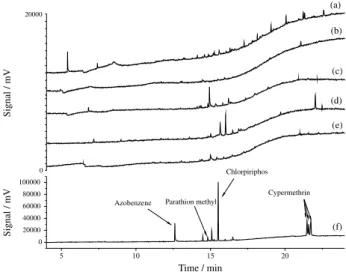
The parathion-methyl, chlorpyriphos and cypermethrin pesticides were identified by GC-FID through the retention time, using individual standard solutions. In Figure 2 can be seen chromatograms obtained from environmental water samples (river, estuarine, seawater and weir) as well as pure water spiked. In Figure 2f, the peaks obtained for chlorpyriphos and cypermethrin are more intense, indicating good detection efficiency by the method.
In fact, from Table 2 it can be seen good sensitivity of the method for chlorpyriphos and cypermethrin pesticides,
with LOD of 0.4 and 0.3 µg L-1 and LOQ of 1.4 and
1.0 µg L-1, respectively.
In Brazil, CONAMA Resolution 357/200551 does the
regulation of surface water and CONAMA Resolution
396/200852 for groundwater. The MS Ordinance No.
2914/2011 sets potability standards for human consumption
and establishes maximum value allowed 30 µg L-1 for
chlorpyriphos. This ordinance does not report values for parathion-methyl and cypermethrin.
Physical and chemical properties of pesticides are shown in Table 3. Other studies indicate that there is a
direct and positive relationship between log Kow (octanol/
water partition coefficient) and log Kfw (fiber/water partition
coefficient) for non-polar polymers.53,54
Thus, knowing that Kow for parathion-methyl can be
considered relatively low,55 the partition equilibrium for
this pesticide between the PDMS coating of the fiber and the water, tends to be displaced into the aqueous phase.
The solubility value of this pesticide is a fact that corroborates their tendency to remain in the aqueous phase, due to non-polar nature of the fiber coating. This may explain the low sensitivity for the extraction of methyl-parathion. A better extraction for this pesticide
Figure 2. Chromatograms obtained by SPME-GC-FID of the environmental water samples in blank: (a) river; (b) estuary P1; (c) estuary P2; (d) marine; (e) the weir and (f) pure water spiking in the middle level of concentration.
Table 2. Validation parameters for method in pure water
Pesticide Regression equation R Calibration range / (mg L-1) (mg LLOD / -1) (mg LLOQ / -1) tR / min
Parathion-methyl y = 23.8x − 76.6 0.994 100-500 22.2 73.9 14.82
Chlorpyriphos y = 1523.6x + 27172.2 0.997 5-300 0.4 1.5 15.52
Cypermethrin y = 4091.8x − 5891.2 0.996 5-100 0.3 0.9 21.47
may be possible using fibers with intermediate polarity phase, as polyacrylate (PA) and polydimethylsiloxane/
divinylbenzene (PDMS/DVB).57,58
The application of appropriate statistical tests can contribute to a more reliable measure and provide a better prediction of concentration in samples. For this, the confidence interval for the intercept and the slope may be calculated. Also, in some cases it is possible to carry out a fitting of calibration curve. This adjustment is made when the intercept of the calibration curve does not cross the origin.
It can be seen that the intercept (a) of the calibration curves, in Table 2, does not pass through the origin. However, one can consider that the intercept pass through the origin if the confidence interval for the intercept
contains zero. Thus, the curve would have the form y = bx.28
This procedure would be considered as an adjustment of the calibration curve.
As an example to estimate the range of the intercept at 95% confidence, we used the curve for parathion-methyl in pure water.
Initially, it must be determined the residual standard deviation (RSD), according to equation 8:
(8)
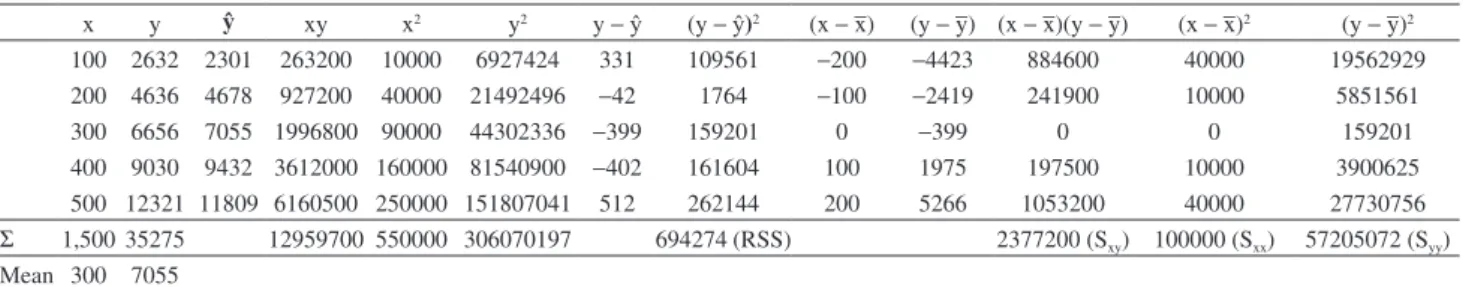
The residual sum of squares (RSS) can be obtained from
the Table 4. The degree of freedom is equal to (N− 2) where
n is the number of points of the curve (N = 5). It loses two
degrees of freedom because it is being estimated both the slope and intercept.
Then it was estimated the confidence interval for the true intercept (a), equation 9:
(9)
where: a is intercept of calibration curve, t is tcritical, RSD
is residual standard deviation, –x2 is square average of
concentrations values, N is the number of points of the curve
and Sxx is sum of squares of x. The value of tcritical (95%) Table 3. Physicochemical properties of pesticides
Pesticide Group Chemical structure S / (mg L-1) K
oc / (mL g-1) Kow
Paration-methyl organophosphate 55 240 1.00 × 10³
Chlorpyriphos organophosphate 1.05 8151 5.01 × 10⁴
Cypermethrin pyrethroid 0.004 57889 3.16 × 10⁵
S: solubility; Koc: organic carbon distribution coefficients; Kow: octanol/water partition coefficient. (Source: IUPAC, 2015).56
Table 4. Calculation of , Σxy, Σx2, Σy2, RSS, S
xy, Sxx and Syy
x y ŷ xy x2 y2 y −ŷ (y −ŷ)2 (x − –x) (y − –y) (x − –x)(y − –y) (x − –x)2 (y − –y)2
100 2632 2301 263200 10000 6927424 331 109561 −200 −4423 884600 40000 19562929
200 4636 4678 927200 40000 21492496 −42 1764 −100 −2419 241900 10000 5851561
300 6656 7055 1996800 90000 44302336 −399 159201 0 −399 0 0 159201
400 9030 9432 3612000 160000 81540900 −402 161604 100 1975 197500 10000 3900625
500 12321 11809 6160500 250000 151807041 512 262144 200 5266 1053200 40000 27730756 Σ 1,500 35275 12959700 550000 306070197 694274 (RSS) 2377200 (Sxy) 100000 (Sxx) 57205072 (Syy) Mean 300 7055
y: signal obtained experimentally; ŷ: predicted signal in accordance with the equation of the curve; RSS: residual sum of squares; Sxx,Syy: sum of squares;
used in the equation above was 3.18, which corresponds
to 3 degrees of freedom (υ), because υ = N− 2. Solving
equation 9, there is obtained −76.6 ± 1604.5.
That is, the confidence interval is −1681.1 to 1527.9. The wide range may reflect the lower value of measurements (based on five points).28 As noted, the interval contains zero.
Thus, can be considered to fit the line through the origin and take it to the form y = bx.
The confidence interval of the slope for equation non adjusted can be calculated according to equation 10, obtaining 23.77 ± 4.84:
(10)
Proceeding with the fitted equation, which now has the form y = bx is necessary to calculate the new slope (b) and its confidence interval, from equations 11 and 12, respectively.
(11)
(12)
Therefore, the equation of the curve became y = 23.6x with slope b = 23.6 ± 1.6.
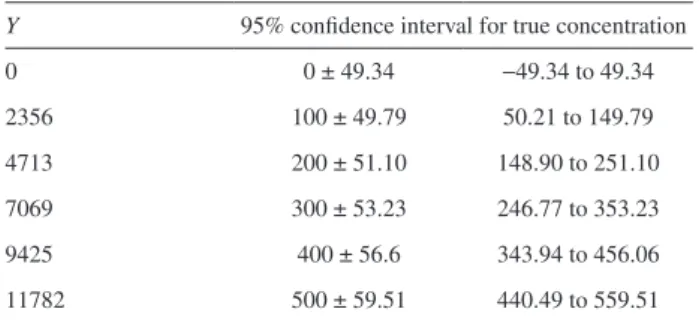
The true concentration (Y / b) can be given by
equation 13:
(13)
Substituting values of Y in the above equation, the
intervals for concentration were obtained (Table 5). Perceive that the value of RSD is calculated as above, however, the
number of degrees of freedom is now equal to (N− 1).
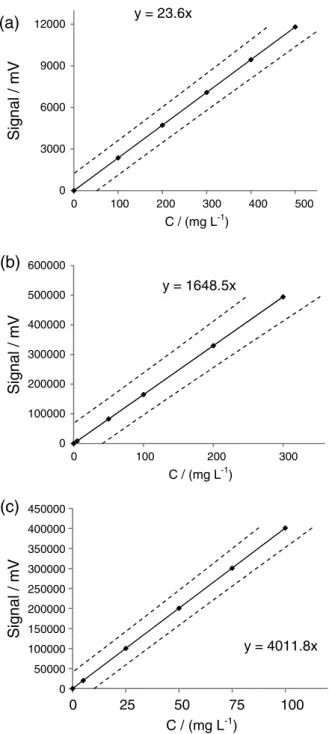
Likewise, preceded to pesticides chlorpyriphos and cypermethrin in pure water and the results of the adjusted calibration curve with the new detection and quantification limits can be seen in Table 6. The objective of the adjusted curve is to provide a better prediction of concentration in unknown samples. The graph of calibration curves can be seen in Figure 3.
Recovery and matrix effect
The matrix effect is dependent on the physicochemical properties of pesticides and characteristics of endogenous
matrix components.59 Thus, in aqueous samples, the matrix
effect can become more pronounced with increasing complexity. Thus, rainwater, groundwater and drinking water tend to have less matrix effect than estuarine waters and weir.
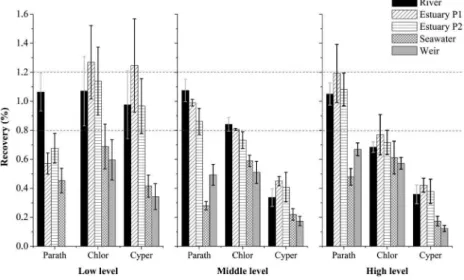
In Figure 4, it can be seen a trend in decreased recovery of pesticide while the aqueous samples tend to become more complex. At low level concentration the parathion-methyl was not detected in weir, probably due to the competitive effects of dissolved organic matter by PDMS. The weir from which water has been collected presented evidence of eutrophication, which suggests some amount of dissolved organic matter.
Although the poor distribution of this compound to the non-polar PDMS fiber, it can be expected that the increase in concentration favors the analyte extraction, resulting in increased recovery.
Although the chlorpyriphos and cypermethrin have low
water solubilities and higher values of Kow, the extraction
efficiency of the method was unsatisfactory for these pesticides, considering the non-polar nature of the fiber. Albanis and Hela60 also observed that salinity and the total
organic compound content increase the interferences in environmental analysis of water samples using solid-phase extraction discs.
Chiou et al.61 report evidence that the solubility
and stability of many hydrophobic organic compounds may be significantly improved by the presence of low concentrations of dissolved and/or suspended
particulate-Table 5. Confidence interval for the true concentration of parathion methyl in pure water
Y 95% confidence interval for true concentration
0 0 ± 49.34 −49.34 to 49.34
2356 100 ± 49.79 50.21 to 149.79
4713 200 ± 51.10 148.90 to 251.10
7069 300 ± 53.23 246.77 to 353.23
9425 400 ± 56.6 343.94 to 456.06
11782 500 ± 59.51 440.49 to 559.51
Table 6. Adjusted calibration curve by the origin for the determination of pesticides in pure water and news limits of detection and quantification
Pesticide Regression equation Equation of adjusted curve CI for b (95%) LOD / (mg L-1) LOQ / (mg L-1)
Parathion-methyl y = 23.8x − 76.6 y = 23.6x ± 1.7 22.3 74.5
Chlorpyriphos y = 1523.6x + 27172 y = 1648.6x ± 180.3 0.4 1.4
bound natural organic matter in water. These factors could have contributed to the low recovery values for pesticides by
SPME.62 In fact, the salinity and dissolved organic matter
content are the main features between aqueous matrices assessed. Also, minerals with high adsorption capacity are present in estuarine matrices. They can interact with the organic contaminants and interfere with the extraction process.63,64
In Table 7, it can be seen the significance of the matrix effect in the aqueous matrices based on the statistical
tests F and t. The marine water and weir water promoted
matrix effects in pesticide at all concentration levels. The chlorpyriphos and cypermethrin were the most affected by the matrix interferences. The parathion-methyl was the pesticide that has suffered minor occurrence of matrix effects.
Relation factor (Rf)
Strategies using standard substitution (SS) can be adopted to correct the concentration of analytes due to the matriz effect. For SS compound to be considered adequate, it must have similar behavior to the analyte in the evaluated matrix, because it will be subject to the same conditions of interaction with the endogenous matrix components and extraction conditions.
In general, a deuterated compound is used. The SS is added to the sample (with known concentration) at the beginning of the analytical procedure, following every step of the process.
As low cost alternative, when there is no available deuterated or similar compound to the analyte of interest, it can be used another generic substance. Thus, a relation between these compounds (analyte and surrogate) is called relation factor (Rf). The Rf can be calculated by the recovery
ratio between the SS and analyte. The Rf represents a
correction or adjustment due to different chemical behavior between these compounds in the matrix to the analytical method of extraction.
As reported by Cavalcante et al.,20 the use of compounds
as standard surrogate has shown satisfactory results for correction of concentration of the pesticides in estuarine
matrix. In Table 8 are shown the values of the Rf obtained
by the ratio between the recovery of pesticides and recovery standard. The standard deviation (SD) value was obtained from error propagation formula:
(14)
where y is the result of the ratio of recoveries, a and b
are the recovery values and sa and sb are their respective standard deviations.
In order to understand the matrix effect in the pesticides in aquatic environments from different origins, such as marine water and weir water the relation factors at three recovery levels of pesticides were studied. These aquatic environments usually are characterized by high salt content and high organic matter, respectively. As seen in Table 7 the chlorpyriphos and cypermethrin, which are hydrophobic compounds, were the most affected by the matrix interferences. On the other hand, although
Figure 4. Recovery of pesticides in three fortification levels in river, estuary, marine and weir waters.
Table 8. Relation factor (Rf) of pesticides with the standard surrogate in three fortification levels (low, medium and high levels)
Pesticide River Estuary 1 Estuary 2 Seawater Weir
Low level
parathion-methyl mean 0.716 0.418 0.556 0.414 −
SD 0.213 0.088 0.024 0.041 −
chlorpyriphos mean 0.462 0.727 0.637 0.333 0.292
SD 0.084 0.201 0.006 0.164 0.059
cypermethrin mean 0.572 0.947 0.743 0.438 0.353
SD 0.079 0.080 0.069 0.125 0.045
Middle level
parathion-methyl mean 0.608 0.650 0.565 0.372 0.480
SD 0.055 0.073 0.002 0.005 0.104
chlorpyriphos mean 0.268 0.308 0.278 0.333 0.292
SD 0.022 0.014 0.048 0.022 0.081
cypermethrin mean 0.198 0.313 0.321 0.209 0.169
SD 0.062 0.074 0.067 0.060 0.047
High level
parathion-methyl mean 0.726 0.884 0.917 0.474 0.661
SD 0.064 0.028 0.074 0.088 0.078
chlorpyriphos mean 0.473 0.576 0.590 0.598 0.563
SD 0.044 0.038 0.014 0.054 0.020
cypermethrin mean 0.205 0.314 0.284 0.193 0.136
SD 0.023 0.003 0.074 0.029 0.007
Table 7. Significance matrix effect in aqueous samples for the determination of pesticides at three concentration levels, according to the statistical tests F and t
Pesticide Level Matrix aqueous
River Estuary P1 Estuary P2 Seawater Weir
Parathion- methyl
low no yes yes yes yes
middle no no no yes yes
high no no no yes yes
Chlorpyriphos
low yes no no yes yes
middle yes yes yes yes yes
high yes yes yes yes yes
Cypermethrin
low no no no yes yes
middle yes yes yes yes yes
the parathion-methyl has unfavorable distribution on the PDMS fiber, it was verified a less pronounced matrix effect.
High recoveries for parathion-methyl were observed for higher concentration levels (middle and high), as shown in Figure 4, indicating that the matrix effects promoted by aquatic environments did not affect significantly the parathion-methyl extraction as noticeable for the chlorpyriphos and cypermethrin.
The matrix effect on the recoveries from pesticides in marine water and weir water with high organic matter were verified for a proportional increase of the relation
factor (Rf) values for methyl-parathion among the aqueous
environments from the middle levels of concentrations to high levels as shown in Table 8. It can be noted that
lower Rf values may be associated with the increase on the
occurrence of matrix effect.
The influence of organic matter of aquatic environments from various origins on the pesticide recoveries has implications and correlations with the total organic carbon
(TOC).61 The difference in magnitude for K
oc (mL g-1)
shown in Table 3 indicates that a more pronounced matrix effect due to organic matter is expected for chlorpyriphos
(8151 mL g-1) and cypermethrin (57889 mL g-1) than for
the parathion-methyl (240 mL g-1).
In this case, it can be expected that an increase in parathion-methyl concentration favors its extraction, resulting in increase on recovery, because of the increased availability of the compound. Thus, in high recovery levels
(300 and 500 µg L-1, respectively) the matrix effect has
become less pronounced for parathion-methyl.
For parathion-methyl, the Rf value was similar in
estuarine and marine water, in low levels. For chlorpyriphos,
the Rf values in middle and high levels, for estuarines,
seawater and weir waters were statistically similar, indicating proportional behavior between the pesticide and the surrogate recovery. For cypermethrin, the statistical equality occurred in estuarine matrices in medium and high levels of concentration. In addition, the data suggest that a
single value of Rf can be used in calculations of recovery
of pesticides in cited matrices.
The use of compounds as surrogate belonging to the same chemical class or group of analyte of interest can produce best results between the analyte and surrogate standard due to the similarity between both. Above all, more important is that the analyst knows the properties of the compounds being investigated so that it can make a prediction of their behavior in the matrix investigated. Thus, more efficient strategies can be designed in order to develop a methodology that meets the study requirements.
Conclusion
A real estimate of analyte concentration levels in samples should be based on an appropriate quality control. Thus, the application of adequate statistical tests and strategies that make it possible to offset the effect matrix in complex samples can contribute to a more reliable analysis. Pesticides were very susceptible to matrix effects promoted by environmental samples. This showed the need for the use of a surrogate standard for the correction of their concentrations. Thus, the use of a relation factor seemed viable as recovery correction parameter for pesticides, although belonging to another chemical group.
Furthermore, it has been found the possibility of the
same Rf can be used in matrices of the same nature but
with different characteristics.
Acknowledgments
The authors thank CNPq for the financial support. Also, we thank the Laboratório de Análise de Contaminantes Orgânicos (LABOMAR-UFC) and Laboratório de Tecnologia de Biomassa - Embrapa Agroindústria Tropical.
References
1. Lushchak, O. V.; Kubrak, O. I.; Storey, J. M.; Storey, K. B.; Lushchak, V. I.; Chemosphere 2009, 76, 932.
2. Hiller, E.; Tatarková, V.; Šimonovičová, A.; Bartal’, M.;
Chemosphere 2012, 87, 437.
3. Maloschik, E.; Ernst, A.; Hegedus, G.; Darvas, B.; Székács, A.;
Microchem. J. 2007, 85, 88.
4. Carlos, E. A.; Neves, A. A.; Reis, C.; Queiroz, E. L. R.; Quim. Nova 2011, 34, 272.
5. Caldas, S. S.; Gonçalves, F. F.; Primel, E. G.; Prestes, O. D.; Martins, M. L.; Zanella, R.; Quim. Nova 2011, 34, 1604.
6. Rizzetti, T. M.; Kemmerich, M.; Martins, M. L.; Prestes, O. D.; Adaime, M. B.; Zanella, R.; Food Chem. 2016, 196, 25.
7. Souza-Silva, É. A.; Jiang, R.; Rodríguez-Lafuente, A.; Gionfriddo, E.; Pawliszyn, J.; TrAC, Trends Anal. Chem. 2015, 71, 224.
8. Arruda, J.; Guedes, C.; Oliveira, R.; Gomes, C.; Aparecida, M.; Milhome, L.; Ferreira, R. ; Food Chem. 2016, 199, 380. 9. Oliveira, R.; Carius, R.; Castro, D.; Aparecida, M.; Milhome,
L.; Ferreira, R.; LWT - Food Sci. Technol. 2014, 59, 21. 10. Pinheiro, A. D. S.; da Rocha, G. O.; de Andrade, J. B.;
Microchem. J. 2011, 99, 303.
11. Paschoal, J. A. R.; Rath, S.; Airoldi, F. P. D. S.; Reyes, F. G. R.;
Quim. Nova 2008, 31, 1190.
12. Shakouri, A.; Yazdanpanah, H.; Shojaee, M. H.; Kobarfard, F.;
13. Picó, Y.; Blasco, C.; Font, G.; Mass Spectrom. Rev. 2004, 23, 45. 14. IUPAC; Gold Book; Iupac: Genebra, 2014, p. 1670. Available at
http://goldbook.iupac.org/M03759.html, accessed in September 2016.
15. Kruve, A.; Künnapas, A.; Herodes, K.; Leito, I.; J. Chromatogr. A 2008, 1187, 58.
16. Kebarle, P.; Tang, L.; Anal. Chem. 1993, 65, 972A.
17. Kruve, A.; Leito, I.; Herodes, K.; Anal. Chim. Acta 2009, 651, 75.
18. Ferrer, C.; Lozano, A.; Agüera, A.; Girón, A. J.; Fernández-Alba, A. R.; J. Chromatogr. A 2011, 1218, 7634.
19. Van Eeckhaut, A.; Lanckmans, K.; Sarre, S.; Smolders, I.; Michotte, Y.; J. Chromatogr. B: Anal. Technol. Biomed. Life Sci. 2009, 877, 2198.
20. Cavalcante, R. M.; Lima, D. M.; Fernandes, G. M.; Duaví, W. C.; Talanta 2012, 93, 212.
21. Rimayi, C.; Odusanya, D.; Mtunzi, F.; Tsoka, S.; Chemosphere
2015, 118, 35.
22. Ribani, M.; Bottoli, C. B. G.; Collins, C. H.; Jardim, I. C. S. F.; Melo, L. F. C.; Quim. Nova 2004, 27, 771.
23. Cuadros-Rodríguez, L.; Gámiz-Gracia, L.; Almansa-López, E. M.; Bosque-Sendra, J. M.; TrAC, Trends Anal. Chem. 2001, 20, 620. 24. Abdulra’uf, L. B.; Tan, G. H.; Food Chem. 2015, 177, 267.
25. Alpendurada, M. F.; J. Chromatogr. A 2002, 968, 177. 26. Filho, A. M.; dos Santos, F. N.; Pereira, P. A. P.; Microchem. J.
2010, 96, 139.
27. Tankiewicz, M.; Morrison, C.; Biziuk, M.; Talanta 2013, 107, 1.
28. Caulcutt, R.; Richard, B.; Statistics for Analytical Chemists; Chapman & Hall: London, 1994.
29. Brasil, MAPA/ACS; Manual de Garantia da Qualidade Analítica, 1a ed.; Ministério da Agricultura, Pecuária e Abastecimento,
Secretaria de Defesa Agropecuária: Brasília, 2011. 30. Arthur, A. L.; Pawliszyn, J.; Anal. Chem. 1990, 62, 2145.
31. Ouyang, G.; Pawliszyn, J.; Anal. Chim. Acta 2008, 627, 184. 32. Holopainen, S.; Luukkonen, V.; Nousiainen, M.; Sillanpää, M.;
Talanta 2013, 114, 176.
33. Huang, S.; He, S.; Xu, H.; Wu, P.; Jiang, R.; Zhu, F.; Luan, T.; Ouyang, G.; Environ. Pollut. 2015, 200, 149.
34. Noventa, S.; Barbaro, J.; Formalewicz, M.; Gion, C.; Rampazzo, F.; Brusà, R. B.; Gabellini, M.; Berto, D.; Anal. Chim. Acta
2015, 858, 66.
35. Menezes, H. C.; Paulo, B. P.; Paiva, M. J. N.; de Barcelos, S. M. R.; Macedo, D. F. D.; Cardeal, Z. L.; Microchem. J. 2015, 118, 272.
36. Adiani, V.; Gupta, S.; Padole, R.; Variyar, P. S.; Sharma, A.;
Postharvest Biol. Technol. 2014, 98, 34.
37. Cecchi, T.; Alfei, B.; Food Chem. 2013, 141, 2025.
38. Lin, J.; Zhang, P.; Pan, Z.; Xu, H.; Luo, Y.; Wang, X.; Food Chem. 2013, 141, 259.
39. Moreira, M. A.; André, L. C.; Cardeal, Z. L.; Food Chem. 2015,
178, 195.
40. Da Silva, G. C.; Da Silva, A. A. S.; Da Silva, L. S. N.; Godoy,
R. L. D. O.; Nogueira, L. C.; Quitério, S. L.; Raices, R. S. L.;
Food Chem. 2015, 167, 71.
41. Dawidowicz, A. L.; Szewczyk, J.; Dybowski, M. P.; Talanta
2016, 146, 195.
42. Miró, P.; Buxaderas, S.; Food Res. Int. 2014, 57, 196. 43. Soto, V. C.; Maldonado, I. B.; Jofré, V. P.; Galmarini, C. R.;
Silva, M. F.; Microchem. J. 2015, 122, 110.
44. Aleksa, K.; Walasek, P.; Fulga, N.; Kapur, B.; Gareri, J.; Koren, G.; Forensic Sci. Int. 2012, 218, 31.
45. Brown, S. D.; Rhodes, D. J.; Pritchard, B. J.; Forensic Sci. Int.
2007, 171, 142.
46. Vazquez-Roig, P.; Blasco, C.; Picó, Y.; TrAC, Trends Anal. Chem. 2013, 50, 65.
47. Aresta, A.; Bianchi, D.; Calvano, C. D.; Zambonin, C. G.; J. Pharm. Biomed. Anal. 2010, 53, 440.
48. Olszowy, P.; Szultka, M.; Fuchs, P.; Kegler, R.; Mundkowski, R.; Miekisch, W.; Schubert, J.; Buszewski, B.; J. Pharm. Biomed. Anal. 2010, 53, 1022.
49. Olszowy, P.; Szultka, M.; Ligor, T.; Nowaczyk, J.; Buszewski, B.; J. Chromatogr. B: Anal. Technol. Biomed. Life Sci. 2010, 878, 2226.
50. Zhao, R. S.; Liu, Y. L.; Chen, X. F.; Yuan, J. P.; Bai, A. Y.; Zhou, J. B.; Anal. Chim. Acta 2013, 769, 65.
51. www.mma.gov.br/port/conama/res/res05/res35705.pdf, accessed in August 2016.
52. http://www.mma.gov.br/port/conama/legislacao/CONAMA_ RES_CONS_2008_396.pdf, accessed in August 2016. 53. Chao, K. P.; Lu, Y. T.; Yang, H. W.; Int. J. Mol. Sci. 2014, 15,
2585.
54. Difilippo, E. L.; Eganhouse, R. P.; Environ. Sci. Technol. 2010,
44, 6917.
55. FAO; http://www.fao.org/docrep/w5715e/w5715e03.htm, accessed in September 2016.
56. http://sitem.herts.ac.uk/aeru/iupac/, acessed in August 2016. 57. Li, X.; Gan, P.; Peng, R.; Huang, C.; Yu, H.; J. Chromatogr. Sci.
2010, 48, 183.
58. Lambropoulou, D.; Sakellarides, T.; Albanis, T.; Fresenius J. Anal. Chem. 2000, 368, 616.
59. Pinho, G. P.; Silvério, F. O.; Neves, A. A.; Queiroz, M. E. L. R.; Starling, M. A. V. M.; Quim. Nova 2010, 33, 909. 60. Albanis, T. A.; Hela, D. G.; J. Chromatogr. A 1995, 707, 283.
61. Chiou, C. T.; Malcolm, R. L.; Brinton, T. I.; Kile, D. E.; Environ. Sci. Technol. 1986, 20 (5), 502.
62. Lambropoulou, D. A.; Sakkas, V. A.; Albanis, T. A.; Anal. Bioanal. Chem. 2002, 374, 932.
63. Schroeder, A.; Wiesner, M. G.; Liu, Z.; Earth Planet. Sci. Lett.
2015, 430, 30.
64. Weber, W. J.; LeBoeuf, E. J.; Young, T. M.; Huang, W.; Water Res. 2001, 35, 853.
Submitted: May 22, 2016