Hospital São Lucas - PUCRS
Mailing address: Nelson Rudi Koehler - Av. Ipiranga, 6690 - S/207 - 90610-000 - Porto Alegre, RS, Brazil
Received on 8/13/99 Accepted on 4/7/99
Objective – To determine if the application of a conti-nuous electrode paste band on precordial leads results in alteration of the electrocardiographic tracing as compa-red with an adequate amount of electrode paste, and if the former condition does not cause uniform morphologies from V1 to V6.
Methods – The amplitude and morphology of the trocardiographic waves on the precordial leads in elec-trocardiographic tracings, which were performed with standard (control group) or excessive (continuous band) application of the electrode paste, were compared.
Results – None of the 106 patients studied showed uniformity of the QRS morphology from V1 to V6. The ele-trocardiographic alterations identified in the tracings performed with a continuous electrode paste band that showed statistical significance in relation to the control group were the following: inversion of the P wave in V1; inversion of the T wave in V1, V2, and V3; appearance of R’ waves in V1 and V2; disappearance of S waves in V1; appearance of S waves in V5 and V6; alterations in the am-plitude of almost all waves, in all leads.
Conclusion – Application of a continuous electrode paste band in the precordial leads may cause significant alterations in the electrocardiographic tracing obtained.
Key words: electrocardiogram, electrocardiographic tech-nique, electrodes, electrode paste, precordial leads
Arq Bras Cardiol, volume 73 (nº 3), 266-272, 1999
Carlos Henrique Purper Petterson, Nelson Rudi Koehler, Ronaldo Passos, Iuri Christmann
Porto Alegre, RS - Brazil
Analysis of the Effects of the Continuous Electrode Paste Band
on Precordial Leads of the Electrocardiogram
In spite of multiple developments in the diagnostic field through laboratory tests in cardiology, the resting electro-cardiogram (ECG) continues to be an essential method in the evaluation of patients with heart disease, mainly due to the ECG’s diagnostic simplicity, reproducibility, and accuracy. In order to maintain these characteristics, the methodology employed in the test should be carefully observed. We emphasize two points about this technique: 1) in an attempt to increase the electrical conductivity between the patient’s skin and the registering electrodes, the electrode paste, which is an electroconductive paste, is commonly used between those 2 surfaces; 2) several authors have already observed that misplacement of the precordial electrodes may deeply alter the ECG obtained, leading to misinterpretations 1-4. Even
small changes in the position of the electrodes may cause great alterations in precordial tracings.
Considering these 2 points, Lamb and Moss in their books 5,6 emphasize that the electrode paste should be
care-fully applied to the precordial electrodes, because if in excess, the electrode paste of one electrode can contact the electrode paste of the other electrode, and this may create the effect of “the large common electrode” due to the con-ductivity of the electrical current through the paste, thus distorting the ECG tracing. The tracing would exhibit the same morphology in the distinct leads from V1 to V6, as if re-presenting a single large electrode on the patient’s thorax. This morphology would not be equivalent to any of those of the 6 conventional precordial leads, because it would cor-respond to a nonexistent lead. Lamb also said that this inter-ference would be more commonly observed between leads V2, V3, and V4, which are very close to each other 5.
Methods
The study comprised patients of both sexes and of any age, who underwent ECG in the private clinic of one of the authors or in the outpatient care unit of the Cardiology Ser-vice of the HSL, from June ’97 to August ’97. One of the authors and a medical assistant with specific training performed all ECGs. Initially, a conventional ECG was perfor-med with a small amount of electrode paste in each electrode, avoiding contact between the electrode paste of one precordial lead and that of the other. Then, after an interval of 2 to 3 minutes, another ECG was recorded for control, without alteration in the electrodes or electrode paste. Right after-wards, the researcher added a great amount of electrode pas-te, creating a continuous band between all precordial leads, and the last tracing was recorded. In this way, 3 ECG tracings were obtained for each patient, as follows: 1) tracing with usu-al amount of electrode paste; 2) a 2nd tracing obtained as the
first; 3) tracing with continuous electrode paste band. All ECG tracings were complete, comprising the 12 conventional leads. As the ECG tracings, when recorded in the same person but at different moments, may show small differences in the morphology of the waves 7, an analysis was performed to
minimize this effect. Three ECGs of each patient were studied and the difference between the first and the second ECGs (both with the usual amount of electrode paste) was measu-red; then, the difference between the first (with the usual amount of electrode paste) and the third ECGs (with the continuous electrode paste band) was measured. It was assu-med that the first difference represents a normal variability of the ECG tracing, and the second difference represents the normal variability increased with the variability caused by the continuous electrode paste band.
The tracings were interpreted by 2 of the authors, blindly in regard to the amount of electrode paste in each tracing, and the following parameters were analyzed: 1) am-plitude of the P, Q, R, S, and T waves (quantitative analysis); 2) positivity or negativity of the P and T waves (qualitative analysis); 3) similarity or not between the morphologies of the QRS complex in the different precordial leads.
This analysis aimed to identify: the spontaneous variability in the morphology of the ECG waves (the dif-ference between the first and the second ECGs); the chan-ges determined by the inadequate use of the electrode pas-te (the difference between the first and the third ECGs); the difference between these variabilities (if significant or not).
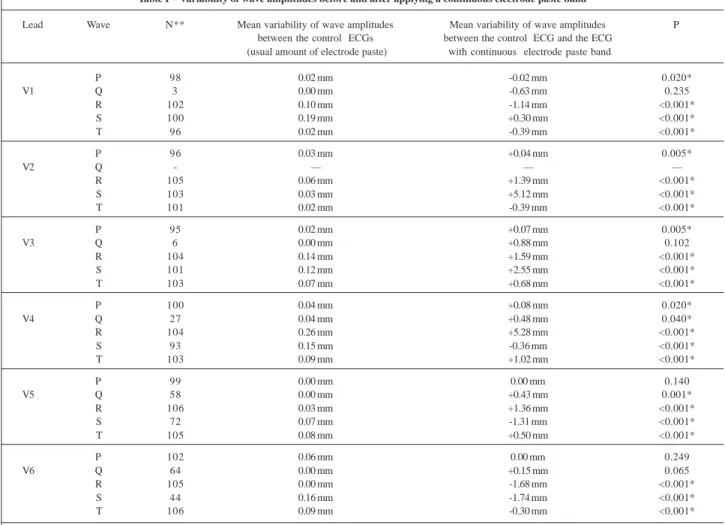
Table I – Variability of wave amplitudes before and after applying a continuous electrode paste band
Lead Wave N** Mean variability of wave amplitudes Mean variability of wave amplitudes P between the control ECGs between the control ECG and the ECG
(usual amount of electrode paste) with continuous electrode paste band
P 98 0.02 mm -0.02 mm 0.020*
V1 Q 3 0.00 mm -0.63 mm 0.235
R 102 0.10 mm -1.14 mm <0.001*
S 100 0.19 mm +0.30 mm <0.001*
T 96 0.02 mm -0.39 mm <0.001*
P 96 0.03 mm +0.04 mm 0.005*
V2 Q - — — —
R 105 0.06 mm +1.39 mm <0.001*
S 103 0.03 mm +5.12 mm <0.001*
T 101 0.02 mm -0.39 mm <0.001*
P 95 0.02 mm +0.07 mm 0.005*
V3 Q 6 0.00 mm +0.88 mm 0.102
R 104 0.14 mm +1.59 mm <0.001*
S 101 0.12 mm +2.55 mm <0.001*
T 103 0.07 mm +0.68 mm <0.001*
P 100 0.04 mm +0.08 mm 0.020*
V4 Q 27 0.04 mm +0.48 mm 0.040*
R 104 0.26 mm +5.28 mm <0.001*
S 93 0.15 mm -0.36 mm <0.001*
T 103 0.09 mm +1.02 mm <0.001*
P 99 0.00 mm 0.00 mm 0.140
V5 Q 58 0.00 mm +0.43 mm 0.001*
R 106 0.03 mm +1.36 mm <0.001*
S 72 0.07 mm -1.31 mm <0.001*
T 105 0.08 mm +0.50 mm <0.001*
P 102 0.06 mm 0.00 mm 0.249
V6 Q 64 0.00 mm +0.15 mm 0.065
R 105 0.00 mm -1.68 mm <0.001*
S 44 0.16 mm -1.74 mm <0.001*
T 106 0.09 mm -0.30 mm <0.001*
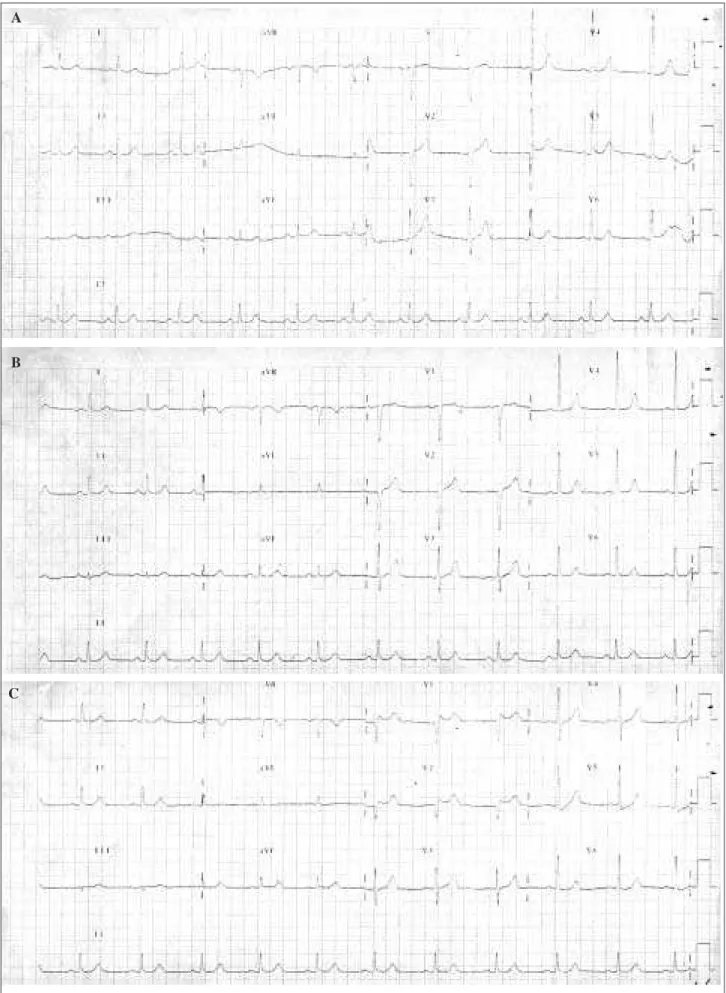
Fig. 1 - ECG tracings of a 68-year-old woman: ECG tracing with usual amount of electrode paste; ECG tracing with usual amount of electrode paste (control); ECG tracing with continuous electrode paste band.
A
B
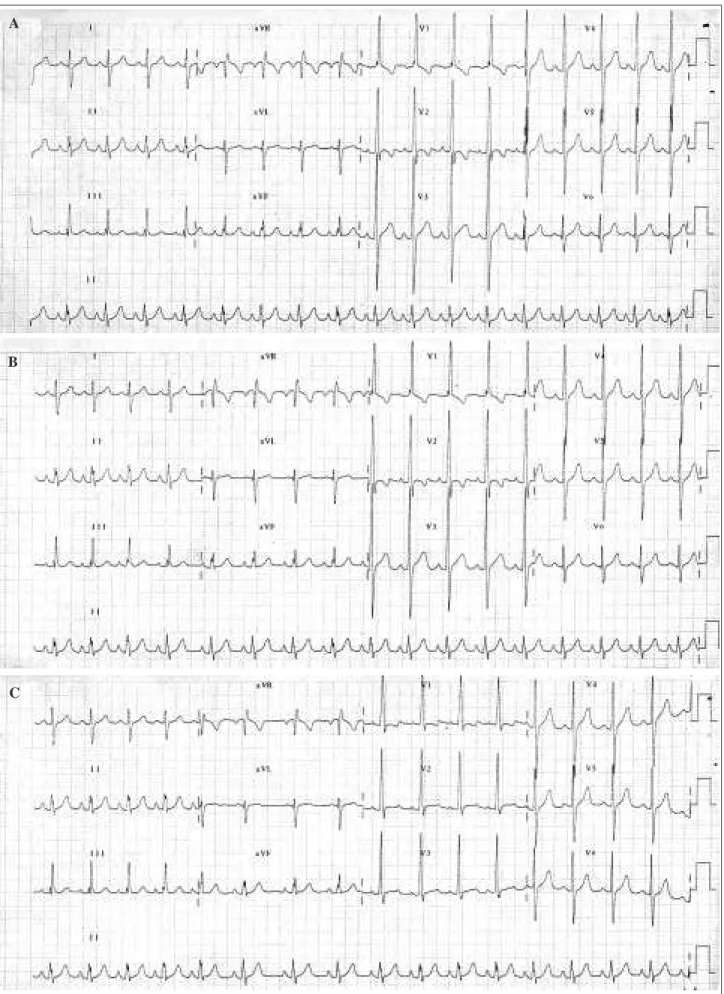
Fig. 2 - ECG tracings of a 9-year-old boy: ECG tracing with usual amount of electrode paste; ECG tracing with usual amount of electrode paste (control); ECG tracing with continuous electrode paste band.
A
B
The SPSS software was used and the mean of the va-riabilities was determined. The t test for paired samples and the t test for independent samples were used in the compa-rison of the subgroups. Confidence intervals (CI) of 95% were calculated for the difference of wave amplitudes and p < 0.05 was considered significant.
Results
From June ’97 to August ’97, 106 ECGs were perfor-med according to the methodology described above. Only the R wave of V5 and the T wave of V6 were present and could be analyzed in all tracings (n=106). That is why the “n” of each wave in each lead is different (n=83.3 tracings, in the average). The frequency of interpretable waves is shown in table I. In none of the patients was the Q wave in the V2 lead present in the 3 tracings; therefore, it was excluded from the analysis.
The mean age of the patients was 34±24 years and 35 patients were 10 years old or younger. Males comprised 68% of the sample.
Figures 1 and 2 exemplify ECG tracings that under-went alterations after application of a continuous electrode paste band.
None of the patients showed such a deep and genera-lized alteration of the morphology of the QRS waves to cau-se similar ECG tracings in all precordial leads.
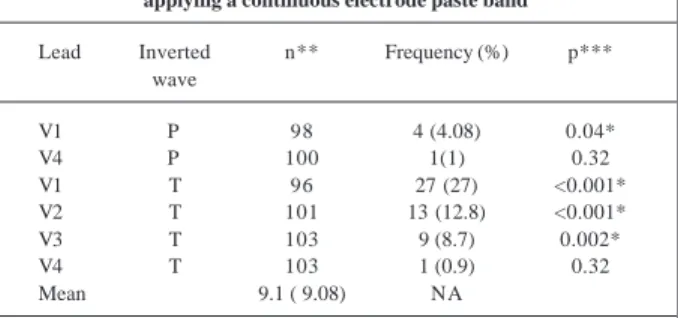
Inversion of the polarity of the T and P waves with application of the electrode paste band was observed in 37.7% of the tracings (in 54.3% of the children under 10 years of age and in 29.6% of the remaining patients; p=0.013). All patients showed positive waves in the control tracings that became negative after the application of the electrode paste band. This alteration was not observed in any of the control ECGs (with the usual amount of electrode paste). The frequencies of these inversions are shown in table II.
Discussion
The literature is scarce in regard to information about the amount of electrode paste to be applied in the obtain-ment of ECG tracings. Only two authors 5,6 mention this
to-pic. According to them, application of a continuous electro-de paste band would result in an ielectro-dentical ECG tracing in all precordial leads (equivalent to a single electrode). This did not happen in any of the ECGs of the 106 patients analyzed in this study.
As the group of patients studied represents a broad age range, we tried to determine if the small number of chil-dren under 10 years of age constituting the sample would not be masking the findings. This could be explained by the reduced thoracic circumference of the children, causing the precordial electrodes to be placed very closely, resulting in contact between them.
Therefore, we analyzed separately the subgroups of patients under and above 10 years of age. In these subgro-ups, the alterations caused by the excessive amount of elec-trode paste were very similar, except for the case of polarity inversion of the P and T waves, which occurred more fre-quently in the subgroup of children under 10 years of age.
Inversion of the T wave was frequently found in V1, V2, and V3, after the application of a continuous electrode paste band; this alteration could cause a misinterpretation of the ECG tracing in a patient. Inversion of the P wave in V1 occurred in 4% of the cases, and this could lead to a false diagnosis of left atrial hypertrophy.
On the other hand, the appearance of new deflections (R’ and S’) in the ECG tracing with a continuous electrode paste band, even though quite frequent in V1 and V2, would hardly significantly alter the ECG interpretation, because there was no increase in the duration of the QRS complex in these cases. It is worth emphasizing the frequent appearance of new S waves in the V5 and V6 leads, which, in spite of being low-amplitude waves (maximum = 4mm, mean = 1.9mm), may alter the ECG interpretation if associated with other changes.
The variability of wave amplitudes between the 2 control ECGs, when present, was very small. It may have resulted from alterations in the breathing cycle, because the electrode remained untouched between the 2 ECGs. We have no explanation for the smaller coefficients of variability found in the literature 7.
Application of a continuous electrode paste band caused alterations in all the ECG tracings obtained, more fre-quently in the R and S waves (probably due to their larger amplitudes).
In all leads, changes in the amplitudes of the R, S, and T waves reached statistical significance. This did not ha-ppen to the P wave in V5 and V6 and to the Q wave in V1, V2, V3, and V6, probably due to the low amplitudes of these wa-ves. Alterations observed in the R, S, and T waves, howe-ver, were of low magnitude, even though significant. The greatest changes were observed in the S wave in V2 (5.1mm; 7.2mm in children under the age of 10 years) and in the R wave in V4 (5.2mm; 7.1mm in children under 10 years of age). These changes, mainly those occurring in patients under 10 years of age, could lead to a misinterpretation of left ventri-cular hypertrophy on the ECG, in some patients. The other alterations in amplitude in the deflections, however, seem to be of dubious clinical importance.
Table II – Frequency of inversion of the P and T waves after applying a continuous electrode paste band
Lead Inverted n** Frequency (%) p*** wave
V1 P 98 4 (4.08) 0.04*
V4 P 100 1(1) 0.32
V1 T 96 27 (27) <0.001*
V2 T 101 13 (12.8) <0.001*
V3 T 103 9 (8.7) 0.002*
V4 T 103 1 (0.9) 0.32
Mean 9.1 ( 9.08) NA
Table III – Incidence of appearance of R’ and S’ waves after applying a continuous electrode paste band (n=106)
Lead Appearance of Incidence (%) p**
V1 R’ 8 (7.8) 0.004*
V2 R’ 9 (8.5) 0.002*
V3 R’ 2 (1.9) 0.15
V4 R’ 2 (1.9) 0.15
V2 S’ 1 (0.9) 0.32
V3 S’ 2 (1.9) 0.15
Mean 4 (3.81) NA
* significant difference (p<0.05); **comparison with control ECGs (incidence 0%); NA- nonapplicable.
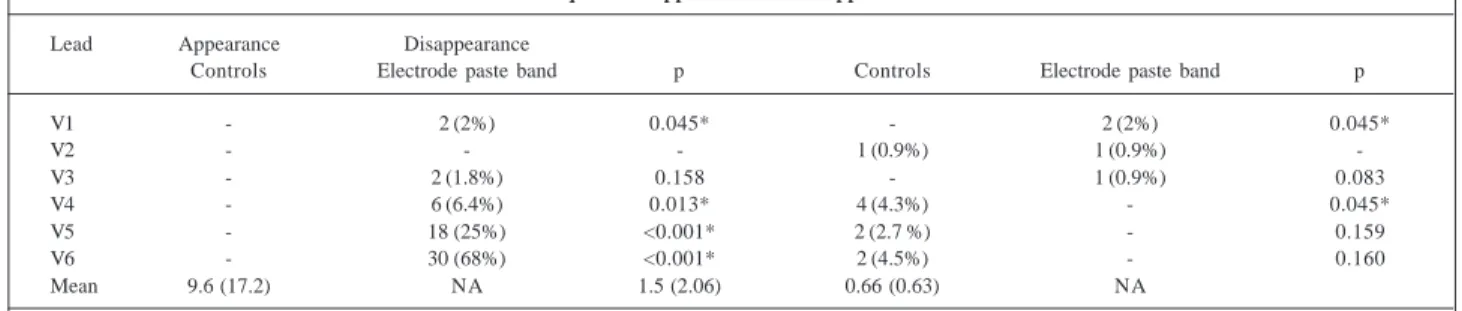
Table IV – Frequence of appearance and disappearance of S waves
Lead Appearance Disappearance
Controls Electrode paste band p Controls Electrode paste band p
V1 - 2 (2%) 0.045* - 2 (2%) 0.045*
V2 - - - 1 (0.9%) 1 (0.9%)
-V3 - 2 (1.8%) 0.158 - 1 (0.9%) 0.083
V4 - 6 (6.4%) 0.013* 4 (4.3%) - 0.045*
V5 - 18 (25%) <0.001* 2 (2.7 %) - 0.159
V6 - 30 (68%) <0.001* 2 (4.5%) - 0.160
Mean 9.6 (17.2) NA 1.5 (2.06) 0.66 (0.63) NA
Controls – comparison between the two ECG tracings with the usual amount of electrode paste; electrode paste band – comparison between the tracing with the usual amount of electrode paste and the tracing with the continuous electrode paste band; * significant difference (p<0.05); NA- nonapplicable.
Table V – Coefficients of spontaneous variability in the sample and in the literature
Wave / CSV in the CSV in the
Lead literature (%) 6 sample (%)
S/V1 4.3 2.45
S/V2 NA 1.48
S/V3 4.5 0.64
R/V4 NA 1.66
R/V5 5.1 1.34
R/V6 5.1 2.76
CSV– coefficient of spontaneous variability; NA– not available.
Therefore, the use of a continuous electrode paste band in the precordial leads of ECG tracings resulted in changes of all 106 patients; in none of whom, however, did we observe uniformity in the morphology of the QRS com-plex from V1 to V6. The changes were significant in regard to wave amplitude, independently from the patient’s age, especially for the S wave in V2 and for the R wave in V4. In addition, the changes also included inversion of the T wave in V1, V2, and V3 in a significant number of patients, mainly those under 10 years of age. These changes may cause alte-rations in the interpretation of the ECGs; therefore, taking a lot of care is advisable at the moment of application of the electrode paste in the precordial leads, in order to avoid the use of a continuous electrode paste band.
In regard to morphology of the QRS complexes, 14.2% of the tracings showed the appearance of R’ and S’ waves after the addition of an excessive amount of the electrode paste. These waves, however, had not been observed in the first 2 tracings (control) (table III). The incidence of these alterations in the subgroup of children under 10 years of age was 22.9% versus 9.9% in the remaining patients, p = 0.07. The appearance of these waves was not observed in any of the control ECGs.
Appearance or disappearance of the S waves was ob-served in 48.1% of the tracings (42.9% in the subgroup of children under 10 years of age and 50.7% of the remaining,
p=0.45). Table IV details these changes. Other alterations in the morphology of the tracings were not observed.
In regard to wave amplitude, several leads did not show alterations in control ECGs, resulting in low coeffici-ents of spontaneous variability (table V). Change, howe-ver, was common after the application of the electrode pas-te band, as compared with the variability of control ECGs (table VI).
Among the tracings in which the wave amplitudes varied, the “normal” variability of the ECG, i. e., the varia-bility observed between 2 consecutive ECGs with the usual amount of electrode paste, did not reach a mean of 0.3mm. On the other hand, the variability imposed by the continuous electrode paste band, i. e., that observed between the first and the third ECGs, was significantly higher than in the control group in all leads, for most of the waves (table VI).
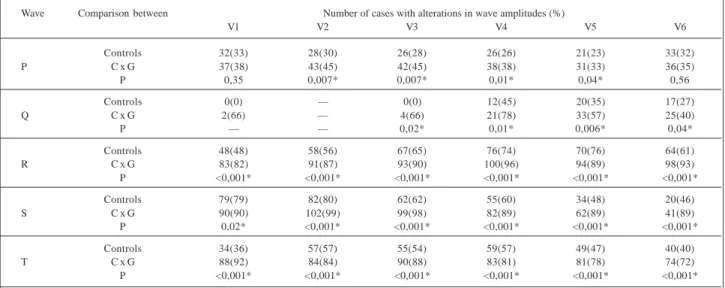
Table VI – Incidence of cases with alteration in wave amplitudes before (control) and after applying a continuous electrode paste band (“n” as in table I)
Wave Comparison between Number of cases with alterations in wave amplitudes (%)
V1 V2 V3 V4 V5 V6
Controls 32(33) 28(30) 26(28) 26(26) 21(23) 33(32)
P C x G 37(38) 43(45) 42(45) 38(38) 31(33) 36(35)
P 0,35 0,007* 0,007* 0,01* 0,04* 0,56
Controls 0(0) — 0(0) 12(45) 20(35) 17(27)
Q C x G 2(66) — 4(66) 21(78) 33(57) 25(40)
P — — 0,02* 0,01* 0,006* 0,04*
Controls 48(48) 58(56) 67(65) 76(74) 70(76) 64(61)
R C x G 83(82) 91(87) 93(90) 100(96) 94(89) 98(93)
P <0,001* <0,001* <0,001* <0,001* <0,001* <0,001*
Controls 79(79) 82(80) 62(62) 55(60) 34(48) 20(46)
S C x G 90(90) 102(99) 99(98) 82(89) 62(89) 41(89)
P 0,02* <0,001* <0,001* <0,001* <0,001* <0,001*
Controls 34(36) 57(57) 55(54) 59(57) 49(47) 40(40)
T C x G 88(92) 84(84) 90(88) 83(81) 81(78) 74(72)
P <0,001* <0,001* <0,001* <0,001* <0,001* <0,001*
C x G- control tracing x continuous electrode paste band tracing; * significant difference (p<0.05).
1. Koehler NR. Alterações do eletrocardiograma em V1 por malposição do eletrodo precordial. Arq Bras Cardiol 1993; 61: 99-101.
2. Byrd J. Bedside EKG electrode placement. J Emerg Nurs 1994; 20: 73-4. 3. Wenger W, Kligfield P. Variability of precordial electrode placement during
rou-tine electrogardiography. J Electrocardiol 1996; 29: 179-84. 4. Grauer K. A pratical guide to EKG interpretation. : Mosby, 1992.