www.atmos-chem-phys.net/11/8543/2011/ doi:10.5194/acp-11-8543-2011
© Author(s) 2011. CC Attribution 3.0 License.
Chemistry
and Physics
A high spatial resolution retrieval of NO
2
column densities from
OMI: method and evaluation
A. R. Russell1, A. E. Perring1,*,**, L. C. Valin1, E. J. Bucsela2, E. C. Browne1, K.-E. Min1, P. J. Wooldridge1, and R. C. Cohen1,3
1Department of Chemistry, University of California Berkeley, Berkeley, CA, USA 2SRI International, Menlo Park, CA 94025, USA
3Department of Earth and Planetary Sciences, University of California Berkeley, Berkeley, CA, USA
*now at: Chemical Sciences Division, Earth Systems Research Laboratory, National Oceanic and Atmospheric
Administration, Boulder, CO, USA
**now at: Cooperative Institute for Research in Environmental Sciences, University of Colorado Boulder, Boulder, CO, USA
Received: 17 March 2011 – Published in Atmos. Chem. Phys. Discuss.: 20 April 2011 Revised: 20 July 2011 – Accepted: 8 August 2011 – Published: 22 August 2011
Abstract. We present a new retrieval of tropospheric NO2
vertical column density from the Ozone Monitoring Instru-ment (OMI) based on high spatial and temporal resolution terrain and profile inputs. We compare our NO2 product,
the Berkeley High-Resolution (BEHR) product, with oper-ational retrievals and find that the operoper-ational retrievals are biased high (30 %) over remote areas and biased low (8 %) over urban regions. Additionally, we find non-negligible impacts on the retrieved NO2 column for terrain pressure
(±20 %), albedo (±40 %), and NO2vertical profile (−75 %– +10 %). We validate the operational and BEHR products us-ing boundary layer aircraft observations from the Arctic Re-search of the Composition of the Troposphere from Aircraft and Satellites (ARCTAS-CA) field campaign which occurred in June 2008 in California. Results indicate that columns de-rived using our boundary layer extrapolation method show good agreement with satellite observations (R2=0.65–0.83;
N=68) and provide a more robust validation of satellite-observed NO2column than those determined using full
ver-tical spirals (R2=0.26;N=5) as in previous work. Agree-ment between aircraft observations and the BEHR prod-uct (R2=0.83) is better than agreement with the opera-tional products (R2=0.65–0.72). We also show that agree-ment between satellite and aircraft observations can be fur-ther improved (e.g. BEHR:R2=0.91) using cloud informa-tion from the Moderate Resoluinforma-tion Imaging Spectroradiome-ter (MODIS) instrument instead of the OMI cloud product.
Correspondence to:R. C. Cohen ([email protected])
These results indicate that much of the variance in the oper-ational products can be attributed to coarse resolution terrain pressure, albedo, and profile parameters implemented in the retrievals.
1 Introduction
Nitrogen oxides (NOx≡NO + NO2)play a major role in
de-termining atmospheric composition. NOx affects the rate
of tropospheric ozone production and influences the oxida-tive capacity of the atmosphere through regulation of OH, thereby acting as a feedback on its own chemical lifetime. Further, oxidation products of NOxare contributors to
atmo-spheric aerosol. Until recently, routine observation of NOx
was restricted to sparse surface networks concentrated in ur-ban regions. The introduction of satellite remote-sensing instruments over the past decade, however, has provided global, routine observation of NO2leading to new insights
into the spatial patterns of NOxemissions and chemistry, and
into the factors influencing NOx sources. Satellite
observa-tions have provided exquisite evidence for spatial and tempo-ral patterns in anthropogenic NOxemissions (e.g. Kim et al.,
2006, 2009; Martin et al., 2006; Mijling et al., 2009; Franke et al., 2009; Russell et al., 2010; Lin and McElroy, 2011; Valin et al., 2011), agricultural NOxemissions (Bertram et
al., 2005; Jaegl´e et al., 2005; Hudman et al., 2010), lightning NOxemissions (Beirle et al., 2004, 2006, 2009; Boersma et
al., 2005; Martin et al., 2007; Bucsela et al., 2010), and fire NOxemissions (Mebust et al., 2011).
With a spatial footprint of 13×24 km2at nadir, the Ozone Monitoring Instrument (OMI) has the highest spatial reso-lution of all the current space-based, NO2-observing
instru-ments. Operational retrieval of NO2vertical column density
performed by the National Aeronautics and Space Admin-istration Goddard Space Flight Center (NASA-GSFC) and the Netherlands Royal Meteorological Institute (KNMI) re-lies on coarsely resolved databases for terrain height, albedo, and NO2vertical profile shape. These inputs all have coarser
spatial and temporal resolutions than the OMI observation. There is evidence that higher resolution albedo and surface pressure would improve the retrieval products (Schaub et al., 2007; Zhou et al., 2009; Hains et al., 2010; Heckel et al., 2011). There is also evidence that higher temporal resolution in the assumed profile will change the retrieval by as much as 74 % seasonally (Lamsal et al., 2010). However, a retrieval utilizing parameters that are all as spatially resolved as the OMI observation, as well as highly temporally resolved, has not been implemented and tested against in situ observations. Here we develop a new retrieval of tropospheric NO2
col-umn, compare it to operational products, and finally, validate it with a robust in situ dataset from the California portion of the Arctic Research of the Composition of the Troposphere from Aircraft and Satellites (ARCTAS-CA) field campaign. Our new retrieval – hereafter referred to as the Berkeley High Resolution (BEHR) retrieval – uses much higher spatial and temporal resolution terrain and profile inputs than the op-erational retrievals. We examine aspects of the BEHR re-trieval to show that it is an improvement over the low reso-lution products available, particularly in regions where ter-rain or albedo are varying on spatial scales comparable to the dimensions of the satellite pixel. We then evaluate the BEHR and operational retrievals using aircraft observations collected within the planetary boundary layer. We show that a large ensemble of observations collected in the boundary layer provide a statistically more robust evaluation of the retrieval than if we relied on aircraft profiles spanning the troposphere. Finally, we evaluate the use of the OMI and MODIS cloud products for excluding cloud-contaminated observations from the comparisons.
2 Tropospheric NO2columns from OMI
The Ozone Monitoring Instrument (OMI) aboard the Aura satellite (launched in July 2004) is a 0.5 nm resolution UV/Visible spectrometer observing reflected sunlight from the Earth in the 270–500 nm range that can be used to de-rive NO2vertical column densities using a Differential
Op-tical Absorption Spectroscopy (DOAS) algorithm (Levelt et al., 2006). The instrument has a 2600 km wide swath and a spatial footprint of 13×24 km2 at nadir. Algorithm devel-opment and validation has been carried out by both NASA-GSFC and KNMI. The two institutions have developed dif-ferent operational retrieval algorithms for determining
verti-cal column densities of NO2, namely NASA’s Standard
Prod-uct and KNMI’s DOMINO prodProd-uct. These two prodProd-ucts use the same modified DOAS spectral analysis technique to de-termine NO2slant column densities but differ in their
deter-mination of stratospheric portion of the column and the air mass factor (AMF) – a multiplicative factor that is used to covert the slant column into a vertical column. Brief descrip-tions of each algorithm and their differences are included be-low.
2.1 NASA standard product
Details concerning the Standard Product retrieval (Level 2, Version 1.0.5, Collection 3) algorithm are provided in Buc-sela et al. (2006) and Celarier et al. (2008). Briefly, the strato-spheric contribution to the column is estimated by mask-ing polluted regions and applymask-ing a zonal planetary wave smoothing. AMFs are computed as a function of viewing parameters, terrain pressure, albedo, and NO2profile shape
and stored in a look-up table generated using the TOMRAD radiative transfer code. AMFs are calculated under both clear and cloudy conditions and a radiance-weighted sum is com-puted to derive the final AMF using cloud height and ef-fective cloud fraction from the OMI O2-O2cloud algorithm
(Acarreta et al., 2004). Albedo is derived from observations from the Global Ozone Monitoring Experiment (GOME) satellite instrument averaged monthly to 1◦×1◦ resolution until February 2009 when reflectivity was modified to OMI surface albedo climatology at 0.5◦×0.5◦(Koelemeijer et al., 2003; Kleipool et al., 2008). NO2 profiles are from a
ge-ographically gridded set of annual mean tropospheric NO2
profiles from the GEOS-Chem model at 2◦×2.5◦resolution.
2.2 DOMINO product
The DOMINO retrieval algorithm (Level 2, Version 1.0.2, Collection 3) is described in detail in Boersma et al. (2007). In the DOMINO product, stratospheric columns are deter-mined by assimilating slant columns in the TM4 global chemistry and transport model. As in the Standard Product, AMF’s are determined by using output from a radiative trans-fer model, albedo at 1◦×1◦is from Koelemeijer et al. (2003) until February 2009 when the OMI surface albedo climatol-ogy at 0.5◦×0.5◦began to be used (Kleipool et al., 2008), and cloud properties are from Acarreta et al. (2004). Daily surface pressure and NO2profile shape are determined by
in-terpolating the four adjacent cells from a TM4 model output (at 3◦×2◦resolution) to the center of the OMI pixel.
2.3 The BEHR product
The Berkeley High Resolution (BEHR) retrieval uses the same method of stratospheric subtraction as that outlined for the Standard Product and AMFs are determined using the same TOMRAD-derived lookup table that depends on view-ing parameters and terrain and profile information. Table 1
Table 1.Albedo, terrain pressure, and NO2vertical profiles in each of the three satellite column NO2retrievals studied here.
NASA OMI Dutch OMI This Work
Standard Product DOMINO Product
Albedo ∗10/04–02/09: GOME derived, ∗10/04–02/09: GOME derived, MODIS MCD43C3,
1◦×1◦, Monthly; 1◦×1◦, Monthly; 0.05◦×0.05◦,
02/09-current: OMI derived, 02/09-current: OMI derived, 16 day average every 8 days
0.5◦×0.5◦, Monthly 0.5◦×0.5◦, Monthly (averaged to OMI pixel)
Terrain Pressure SDP Toolkit 90 arcsec DEM TM4 model, 3◦×2◦resolution, GLOBE 1 km×1 km map (pressure @ center of interpolate four adjacent cells topographical database
OMI footprint) to the center of the OMI pixel (averaged to OMI pixel)
NO2Profile GEOS-Chem 2◦×2.5◦, TM4 model, 3◦×2◦resolution, WRF-Chem 4 km×4 km,
Annually Daily, interpolate four adjacent Monthly (averaged to OMI pixel)
cells to the center of the OMI pixel
∗Note: As of early 2009, the product uses OMI reflectivity at 0.5◦×0.5◦resolution, however, the switch has not yet been retroactive and early data still uses the GOME 1◦×1◦ resolution reflectivity product.
compares terrain and profile parameters implemented in the Standard Product, the DOMINO product, and our BEHR re-trieval. We recalculate AMFs using the GLOBE (Global Land One-kilometer Base Elevation) 1×1 km2topographical database, MODIS (Moderate Resolution Imaging Spectrora-diometer) 0.05◦×0.05◦16-day average albedo (produced
ev-ery 8 days), and WRF-Chem monthly-averaged, 4×4 km2 simulated NO2profiles. The following sections describe the
estimated uncertainties associated with each parameter in the two publicly available retrievals and the differences we ob-serve between our improved NO2product and the operational
retrievals.
3 Evaluation of the BEHR retrieval
In this section we describe each of the new datasets imple-mented into the BEHR retrieval and then compare the prod-uct with each individual parameter implemented with the op-erational products.
3.1 Terrain pressure effects
Recent studies have shown that inaccurate terrain pressure can have a significant effect on the retrieved NO2vertical
col-umn density. A systematic topography bias in the DOMINO product of∼80 hPa was reported by Zhou et al. (2009). They attributed the bias to the coarse resolution of the TM4 mod-eled terrain pressures. Hains et al. (2010) also found that ter-rain pressures estimated by TM4 were 72–99 hPa larger than those they estimated, inducing a 5–20 % systematic error in the retrieved NO2vertical column densities. The accuracy of
the pressure database used in the Standard Product has not been rigorously evaluated.
Here, we use the GLOBE topographical database to esti-mate terrain height for OMI NO2retrieval (Hastings et al.,
1999). We average the high resolution dataset over the area of the satellite pixel instead of using the terrain pressure at the center of the OMI pixel as in the NASA and KNMI prod-ucts. Figure 1a shows a map of the difference between terrain pressures utilized in the Standard Product and those used in the BEHR retrieval for a single day, 18 June 2008. Little change is observed where the terrain is flat (e.g. California’s central valley), while larger differences are observed in the mountains. Differences on the order of±10 % are observed, with pressures from the Standard Product generally larger than those in the BEHR retrieval. A comparison with the DOMINO product (not shown) revealed similar results. This bias is in agreement with that observed for the DOMINO product by both Zhou et al. (2009) and Hains et al. (2010). Figure 1d shows the percent change in tropospheric NO2
col-umn as a function of the percent change in terrain pressure and Fig. 1f shows a histogram of the percent change in tropo-spheric NO2column. Differences in column are of the order
±20 %.
3.2 Albedo effects
We use a 16-day average albedo product, retrieved every 8 days, from the MODIS instrument aboard the Aqua satel-lite (MCD43C3; http://modis.gsfc.nasa.gov/) which provides a much-improved spatial (0.05◦×0.05◦; ∼5×5 km2)and
temporal resolution when compared with the monthly aver-aged 1◦×1◦GOME product and 0.5◦×0.5◦OMI product
currently employed in the operational retrievals. Since both OMI and MODIS instruments are part of the A-train con-stellation and observe the earth within 15 minutes of one an-other, terrain reflectivity is captured at similar viewing and solar geometries as OMI observations of NO2. Changes in
reflectivity are better captured by the enhanced temporal and spatial resolution of MODIS, providing better representation of reflectivity over the OMI footprint. The two instruments
(a) (b) (c)
(d) (e)
(f) (g) (h)
Fig. 1. Retrieval inputs from the BEHR retrieval are compared with those from the Standard Product. Maps of the percent change in
(a)terrain pressure and(b) and terrain reflectivity for 18 June 2008. (c)Profile shapes from GEOS-Chem and WRF-Chem for single points over urban and rural regions in California. The percent change in NO2column versus the percent change in(d)terrain pressure and
(e)albedo. Histograms of the percent change in NO2column due to changes in(f)terrain pressure,(g)albedo, and(h)NO2profile shape.
have different spectral bandwidths (OMI at 405–465 nm and MODIS at 459–479 nm), however, the error associated with this difference is expected to be much smaller than the error induced by the coarse spatial resolution of the current albedo products. We note that the MODIS albedo product does not provide information over the ocean so all comparisons here are for observations over land.
Figure 1b shows a map of the difference between the albedo products used in the Standard and BEHR retrievals for 18 June 2008. Differences exceeding±100 % are observed. The percent change in tropospheric column NO2between the
Standard Product and the BEHR NO2product versus the
per-cent change in the albedo used in the two products is shown in Fig. 1e. Differences in tropospheric column NO2due to
the effects of albedo are as large as±40 % (Fig. 1g).
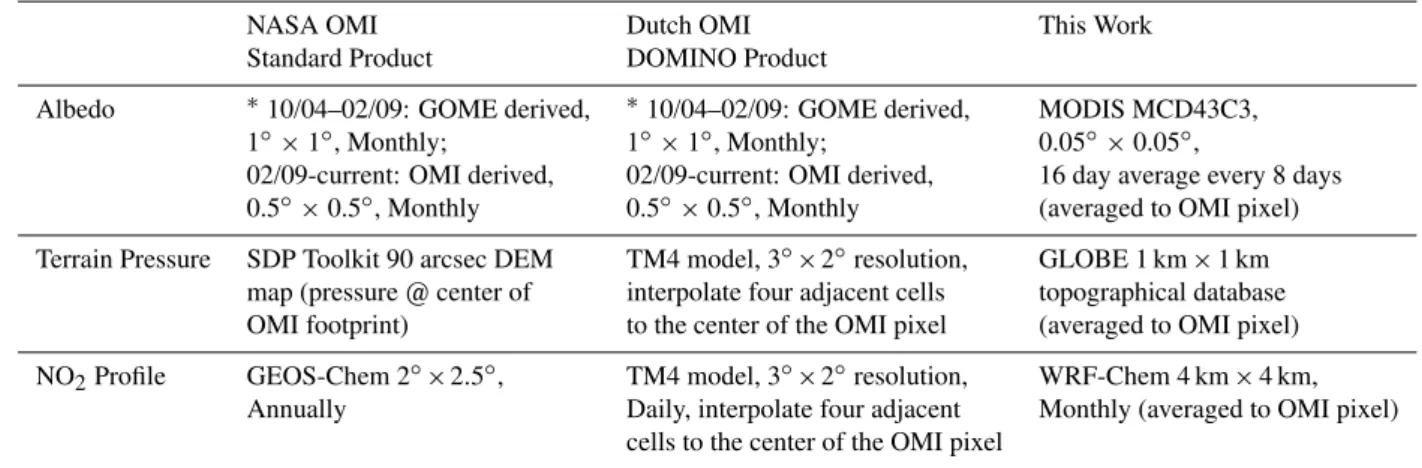
To demonstrate the effects of albedo on the tropospheric NO2 product in further detail, we evaluate a small region
in northwestern Nevada where reflectivity is highly vari-able. Figure 2a shows an image of a salt flat as observed by MODIS. This region is isolated with no significant sources of NOx. A summertime average (June–August 2008) of
the OMI Standard Product tropospheric NO2 column,
how-ever, shows enhanced NO2 in a spatial pattern resembling
the reflectivity over the region (Fig. 2e). This feature arises because the coarse albedo used in the operational products (1◦×1◦) is unable to capture contrasts at this spatial scale
(Fig. 2b). Coarse averaging of the reflectivity with less re-flective, surrounding terrain yields a lower albedo. As sur-face albedo decreases, the AMF decreases, and the retrieved NO2 is enhanced (Fig. 2e). By employing a more resolved
albedo in the BEHR product (Fig. 2d), however, this false
(a)
(b)
(c)
(d)
(e)
(f)
MODIS True Color Image GOME Albedo OMI Albedo
MODIS MCD43C3 Albedo Standard Product NO2 BEHR NO2
Fig. 2. (a)MODIS true color image of a salt flat in north western Nevada on 18 June 2008. Albedo used in(b)the operational retrievals for October 2004–February 2009 (GOME climatology, monthly at 1◦×1◦),(c)the operational retrievals for February 2009 – today (OMI climatology, monthly at 0.5◦×0.5◦), and(d)the BEHR retrieval (MODIS MCD43C3, 16 day average every 8 days, at 0.05◦×0.05◦) for 18 June 2008. Average OMI tropospheric NO2column from(e)the Standard Product and(f)the BEHR retrieval for June-August 2008.
signal is almost fully diminished (Fig. 2f), a reduction of ap-proximately 33 % relative to the operational products. We find that 67 % of the decrease is due to the improved albedo while the remainder is from using our improved terrain pres-sures and WRF-Chem profiles. The remaining enhancement may be due to the presence of clouds or aerosols, or to errors in the MODIS albedo.
3.3 NO2profile shape effects
The sensitivity of OMI to NO2 is inversely related to
alti-tude. As a result, the observed tropospheric NO2 column
depends on the NO2profile shape. When NO2is highly
con-centrated close to the surface, the AMF is smaller and the NO2 column is enhanced. The operational DOMINO and
Standard products currently use daily TM4 modeled profiles and annually averaged profiles from GEOS-Chem, respec-tively (Table 1). The profiles provided by both models are at a much coarser spatial resolution that the OMI observation (WRF-Chem: 2◦×2.5◦; TM4: 3◦×2◦). Consequently, an average semi-polluted profile is applied over the large grid cell that contains both urban and rural locations, poorly rep-resenting the actual NO2profile over both areas and resulting
in an underestimation of the NO2column in the urban region
and an overestimate in the rural region. In addition to these
biases due to resolution, Lamsal et al. (2010) found that the OMI Standard Product is biased high in summer, which they attribute to the lack of seasonality in the Standard Product NO2profiles.
We use monthly averaged NO2 profiles from a
WRF-Chem simulation at 4km resolution. Briefly, WRF-WRF-Chem is a state-of-the-art, multi-scale regional 3-D air quality chemical transport model (Grell et al., 2005). The domain covers 2304×2304 km2 centered on the state of Califor-nia (30–50 N, −124W –−100 W). Emissions are the Na-tional Emission Inventory (NEI) 2005 on-road and off-road transportation emissions for a typical June week-day at native 4 km×4 km resolution. Emissions from lightning and fires are not included but are expected to have a minimal influence in the urban regions studied here. More information concerning emissions is avail-able at: ftp://aftp.fsl.noaa.gov/divisions/taq/emissions data 2005/Weekday emissions/readme.txt. The model mete-orology was driven by initial and boundary conditions derived from the North American Regional Reanalysis for July, 2005 (NARR-http://nomads.ncdc.noaa.gov/dods/ NCEP NARR DAILY). We use the Regional Acid Deposi-tion Model, version 2 chemical mechanism (Stockwell et al., 1990).
Using monthly averaged WRF-Chem profiles allows us to eliminate the seasonal bias observed in the Standard Product that results from the use of annually averaged profiles (Lam-sal et al., 2010). As before, profiles are averaged over the satellite pixel area. Figure 1e shows normalized NO2
pro-files for a single point over an urban region in the Los Ange-les area and over a rural region in coastal northern Califor-nia from the GEOS-Chem and WRF-Chem models. A his-togram showing the percent difference in tropospheric NO2
column between the Standard Product and BEHR retrieval is shown in Fig. 1h. Implementation of WRF-Chem profiles results in a decrease in column NO2 of 29 % on average,
compared to the Standard Product. As expected, decreases are observed over remote areas while enhancements are ob-served over highly polluted, urban regions.
3.4 Spatial resolution and cloud effects
Retrieval of boundary layer NO2from space-based
observa-tions is highly sensitive to cloud cover. As a result, previous studies have used cloud filters in order to exclude data that has a higher uncertainty due to cloud contamination. These filters have generally been set to exclude data with a cloud fraction greater than 0.2–0.3 or data with a cloud radiance fraction greater than 0.5–0.7 according to cloud information from the OMI O2-O2cloud product.
The OMI O2-O2cloud algorithm relies on the 477 nm
ab-sorption band of the O2-O2 collision complex to estimate
cloud height and fraction. Shielding of the O2-O2column
by the presence of clouds allows determination of cloud pa-rameters when radiance observations are coupled with view-ing geometry and terrain information and processed in a ra-diative transfer model. As in the OMI NO2 products, the
OMI cloud algorithm also relies on the coarse 1◦×1◦albedo from GOME. Consequently, over bright surfaces, the algo-rithm has trouble discerning whether the high reflectivity is from the ground or from a cloud. The algorithm thereby has a tendency to mistakenly identify clear-sky, highly reflective regions as cloudy. This error results primarily from a depen-dence on the coarsely-resolved reflectivity and terrain pres-sure currently used in the cloud algorithm. While use of the OMI cloud product has the advantage of providing cloud in-formation that is perfectly co-located with NO2observations,
eliminating concerns of instrumental biases, cloud retrieval from OMI is subject to large uncertainty due to the poorly resolved terrain parameters currently used in the product.
To illustrate this, Fig. 3a, b show maps of OMI O2-O2
derived cloud fraction and MODIS MCD43C3 albedo over California for 18 June 2008. The OMI product shows high cloud fractions over regions of high reflectivity in north west-ern Utah, north westwest-ern Nevada, and the California-Mexico border, east of San Diego. In contrast, no clouds are observed in these regions using the MODIS MYD06 cloud product (Fig. 3c). In light of this issue with the OMI O2-O2 cloud
product, we perform our validation analyses by filtering
ac-cording to both OMI and MODIS cloud fractions (averaged to the OMI pixel size) as a test of the impact of the two cloud products on the comparisons.
3.5 BEHR OMI NO2
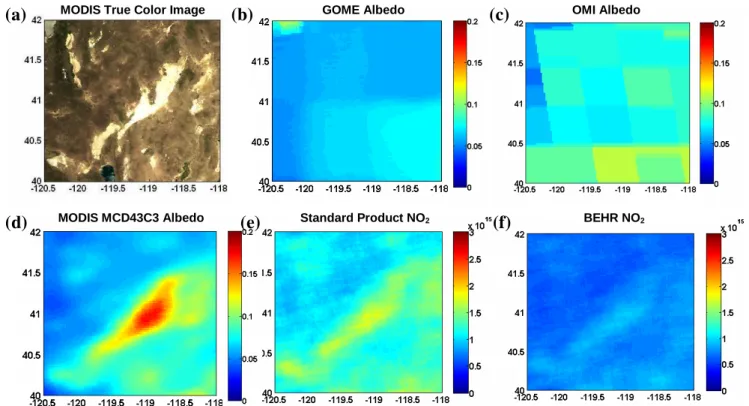
Figure 4 compares average tropospheric NO2 columns for
June 2008 from the Standard Product (Fig. 4a) and the BEHR retrieval (Fig. 4b) with all new terrain and profile parame-ters implemented. The percent difference in retrieved tropo-spheric NO2column is shown in Fig. 4c. NO2columns
deter-mined using the BEHR retrieval are, on average, 31 % lower than those observed using the Standard Product. Exceptions to this decrease occur in urban regions where we observe an average increase of 8 % that is primarily due to improved NO2profiles, and to a lesser extent, improved albedo.
4 Validation of the BEHR retrieval
In order to validate the accuracy of the BEHR product, we use in situ boundary layer measurements of NO2collected
during the California portion of the Arctic Research of the Composition of the Troposphere from Aircraft and Satellites (ARCTAS-CA) field campaign. The ARCTAS-CA cam-paign was carried out in order to improve our understand-ing of emissions, chemical dynamics and air quality over the state of California (Jacob et al., 2010). Aircraft observations were collected on 18, 20, 22, and 24 June 2008 and a substan-tial fraction of the measurements were collected within the planetary boundary layer. Previous validation efforts have extrapolated columns from surface networks, which are nu-merous but influenced by local sources, or full aircraft spirals which are sparse (Martin et al., 2006; Bucsela et al., 2008; Lamsal et al., 2008; Boersma et al., 2009; Hains et al., 2010). Boundary layer observations, however, have the advantage of being removed from the direct influence of sources mak-ing them more representative of the tropospheric column. Further, given that individual boundary layer aircraft obser-vations largely outnumber full vertical profile obserobser-vations, their use as a validation tool greatly enhances the robustness of validation analyses.
4.1 Inferred columns from boundary layer observations
The in situ observations of NO2studied here were collected
throughout the troposphere using the UC-Berkeley Laser-Induced Fluorescence (LIF) instrument aboard NASA’s DC-8 aircraft. Details concerning the instrument are provided in Thornton et al. (2000) and Cleary et al. (2002). Briefly, the LIF system employs a Q-switched, frequency-doubled Nd3+:YAG laser to pump a tunable dye laser. Following cooling of the sample via supersonic expansion to increase the population of NO2molecules at a target rotational level,
the dye laser is held at the peak of the strong resonant for 9 s and then at an offline position in the continuum absorption
MODIS Cloud Fraction MODIS Albedo
OMI Cloud Fraction
(a)
(b)
(c)
Fig. 3.Maps of California showing(a)OMI O2-O2derived cloud fractions,(b)MODIS MCD43C3 albedo, and(c)MODIS MYD06 cloud fraction for 18 June 2008. White boxes show regions where OMI and MODIS cloud fractions do not agree due to albedo effects.
ARCTAS Flight Tracks % Difference
BEHR Standard Product
(a)
(b)
(c)
(d)
Fig. 4. Average tropospheric NO2column for June 2008 from(a)the Standard Product and(b)the BEHR product, and(a)the percent difference between the two products.(a)Flight tracks during the ARCTAS-CA campaign, 18-24 June 2008.
for 3 s. Fluorescence is detected at 4 Hz by a photomultiplier tube. NO2 mixing ratio is proportional to the ratio of the
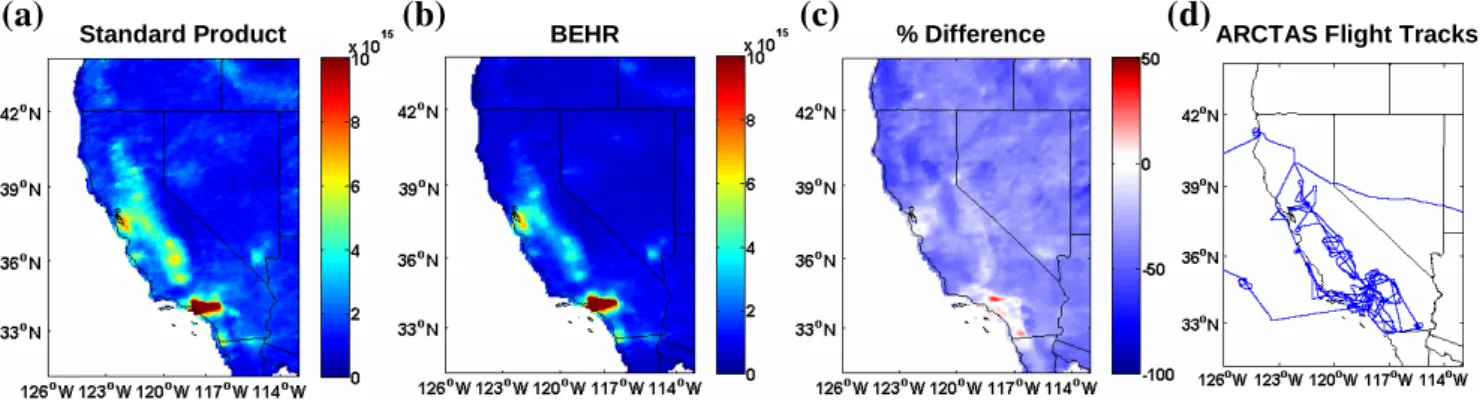
peak to the background. A map showing flight tracks where in situ aircraft measurements took place during ARCTAS-CA is shown in Fig. 4d.
We estimate NO2vertical column densities from
bound-ary layer aircraft observations for comparison with satellite-observed NO2columns by first co-locating aircraft segments
that coincide with individual satellite observations (Fig. 5a). We require that each aircraft segment consist of at least 20 s of measurements that were collected within the boundary layer and within the spatial extent of an OMI pixel after dis-carding outliers. Outliers are defined as values that are more than two standard deviations away from the mean value for the set of measurements. An aircraft segment consists of measurements gathered between 12:00 p.m. and 03:00 p.m. local time, coinciding with the 01:45 p.m. OMI overpass time.
The boundary layer height for each aircraft observation is defined by identifying sharp gradients in aircraft measured
NO2 concentration, water vapor, and potential temperature
with altitude to determine boundary layer entrance and exit points (Fig. 5b). We assume that the boundary layer height varies linearly between each entrance into and exit from the boundary layer. Observations gathered during ARCTAS-CA show small variability in NO2 throughout the free
tropo-sphere and a mean free tropospheric concentration of roughly 40 ppt. We assume a constant 40 ppt NO2mixing ratio above
the boundary layer for the free-tropospheric portion of the column. We further assume that the boundary layer is well-mixed in order to infer the boundary layer portion of the column from aircraft observations. This assumption gener-ally agrees well with GEOS-Chem and WRF-Chem simu-lations as well as the in situ aircraft observations examined here (e.g. Fig. 1c). Further, in the analyses that follow, simi-lar variance between aircraft and satellite observations is ob-served if an exponential profile is assumed. The segment of aircraft measurements associated with a single satellite pixel are averaged and integrated from the terrain height to the height of the boundary layer in order to determine the
(b)
(c)
(a)
Fig. 5. (a)The black line shows the flight path over CA of the DC-8 aircraft on 24 June 2008. Colored squares show the column concentration and location of the center of coincident OMI pixels. (b)Aircraft altitude, H2O vapor concentration, NO2 concentration, and inferred boundary layer height versus time for the flight on 24 June.(c)In situ derived and OMI Standard Product columns collected on 24 June.
vertical column density. A preliminary comparison between in situ-derived and satellite-observed vertical column densi-ties is shown in Fig. 5c.
In the analyses that follow, we exclude comparisons for which OMI pixels were flagged during the retrieval process as well as pixels with an OMI-derived cloud fraction greater than 20 %. A total of sixty-eight comparisons remain follow-ing the filterfollow-ing processes.
4.2 Satellite observations versus inferred columns
Figures 6a, b compare the in situ-derived tropospheric col-umn NO2from aircraft observations with satellite-observed
column NO2 derived using the Standard Product and
DOMINO product algorithms. There is good agreement be-tween in situ and remote-sensed observations, with correla-tion coefficients ofR2=0.72 andR2=0.65 for the Standard Product and DOMINO product, respectively. Slopes asso-ciated with the fits suggest there is no bias in the Standard Product for this time of year but that the DOMINO product is biased high relative to the in situ observations. A simi-lar bias in the DOMINO product was found by Bucsela et al. (2008) using observations from the PAVE, INTEX-A, and INTEX-B aircraft validation campaigns.
Figure 6c compares tropospheric NO2 columns derived
from in situ aircraft observations with the columns from the BEHR product. A slope of 0.96 suggests that there is no sig-nificant bias between inferred NO2columns and the BEHR
product. We further observe a dramatically improved corre-lation between BEHR columns and the in situ derived
obser-vations (R2=0.83) compared to the Standard and DOMINO products. This suggests that a large contribution to the uncer-tainty in OMI observations arises from biases resulting from unresolved terrain and profile databases that are currently im-plemented in the operational retrievals.
4.3 OMI versus MODIS cloud products
Table 2 summarizes our results for the BEHR product when employing various cloud-filters. For the MODIS cloud fil-tering case, the cloud fraction derived by MODIS and aver-aged over the OMI satellite pixel is implemented in the AMF calculation to determine NO2 columns (while the standard
OMI cloud product is used for the SP and DOMINO cloud-filtering cases). We observe a similar correlation between aircraft and remote-sensing observations when stricter OMI O2-O2cloud restrictions are imposed ranging from 20 % to
5 % cloud fraction. A decrease in the correlation is observed, however, when we impose a 0 % cloud threshold due to a substantial reduction in data points at this threshold for eval-uation. When we retrieve OMI NO2 using MODIS cloud
fractions and set a 0 % MODIS cloud threshold, however, we retain a substantial number of data points and observe a much higher correlation than all other thresholds tested here. As discussed in Sect. 3.4, the poor correlation between aircraft observations and the BEHR product derived using the stan-dard OMI cloud information is expected to result from arti-facts in the OMI cloud algorithm related to the coarse terrain reflectivity used in the product.
Table 2.The number of data points available, equation for best fit line, and correlation coefficient when OMI NO2derived using the BEHR product is filtered according to different cloud information.
Cloud Product Cloud Fraction # of Data Points Best Fit Line R2
OMI 20 % 68 y=0.96x−5.01×10¹⁴ 0.83
10 % 64 y=0.95x−4.38×10¹⁴ 0.83
5 % 42 y=1.00x−4.45×10¹⁴ 0.82
0 % 11 y=1.56x−5.13×10¹³ 0.58
MODIS 0 % 45 y=1.03x−1.39×10¹⁴ 0.91
Table 3. Equation for the best fit line and correlation coefficient for satellite columns versus in situ columns when the OMI cloud fraction and MODIS cloud fraction thresholds are used.
OMI cloud fraction<20 % MODIS cloud fraction = 0 %
Standard y=0.99x+4.51×10¹⁴ y=1.04x+5.45×10¹⁴
Product R2=0.72 R2=0.86
DOMINO y=1.78x−1.31×10¹⁵ y=1.70x−4.67×10¹³ R2=0.65 R2=0.83
BEHR y=0.96x−5.01×10¹⁴ y=1.03x−1.39×10¹⁴ R2=0.83 R2=0.91
In Table 3 we compare how the relationship between in-ferred columns and satellite NO2changes for each NO2
prod-uct when we impose a MODIS cloud fraction threshold of 0 % (Fig. 6; dark crosses) as opposed to the OMI O2-O220 %
cloud fraction threshold (Fig. 6; all crosses). For all three NO2products, the fits to observations with a MODIS cloud
fraction of 0 % have similar slopes as the fits to observations with an OMI cloud fraction less than 20 %. We observe im-proved correlations when using the MODIS cloud thresh-old for all three products (Standard Product: R2=0.86; DOMINO:R2=0.83; BEHR:R2=0.91).
4.4 Boundary layer versus complete spiral analyses
In Fig. 6 we compare the relationship between inferred columns from ARCTAS-CA in situ observations and the BEHR tropospheric column NO2using our boundary layer
validation method (crosses) and the traditional validation method requiring measurements from full aircraft spirals spanning the troposphere as described in Hains et al. (2010; triangles). Briefly, the Hains et al. method requires that part of the aircraft segment was collected between 500 m and 2 km above the land surface, that the aircraft observations were collected within 3 h of the OMI overpass, and that the cloud radiance fraction (as observed by OMI) was less than 0.5. Aircraft observations are extrapolated to an assumed tropopause height of 12 km and the highest (lowest) 10 alti-tude observations are used to extrapolate to the top (bottom) of the column.
(a) (b)
(c)
Fig. 6. OMI tropospheric column from(a)the Standard Product,
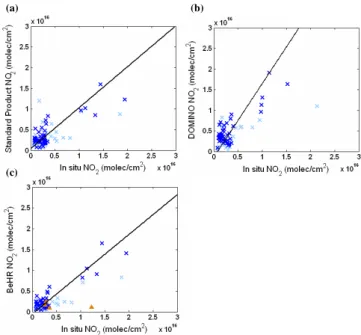
(b)the DOMINO product, and (c)BEHR product versus coinci-dent aircraft-derived column NO2. Observations are over land only. All observations correspond to an OMI cloud fraction of less than 20 %. Dark blue points show where MODIS cloud fraction is 0 %. The black line shows the fit to all data. Fits and correlations are included in Table 3. Orange triangles in(c)show the comparison of the BEHR retrieval and in-situ derived columns determined using the full vertical spiral method in Hains et al. (2010).
The boundary layer and full aircraft spiral validation meth-ods show similar variance between in situ observations and the BEHR retrieval of OMI NO2suggesting that, using our
boundary layer method, we are able to capture the variation of the tropospheric column to within the same certainty as in previous work without requiring observations that span the troposphere at every point. Requiring only points within the boundary layer is an advantage because it both increases the number of data points available for evaluation of the OMI NO2retrieval and increases the spatial coverage of the
sampling. We find that by requiring complete spirals, only
five comparisons are possible (R2=0.26), but by using the boundary layer method described here, we expand the num-ber of comparisons to sixty-eight (R2=0.83).
5 Conclusions
We have produced an improved OMI NO2product (BEHR)
that uses much finer spatial and temporal resolution terrain and profile inputs than the operational products. With the exception of the WRF-Chem profiles, these high resolution inputs are publicly available. We use the GLOBE 1km to-pographical database in order to correct for terrain pressure biases. We find differences of±10 % in terrain pressure, re-sulting in differences of roughly±20 % in the retrieved tro-pospheric NO2 column. We use MODIS albedo at higher
spatial and temporal resolution than the current reflectivity products. The large spatial variability in albedo observed by MODIS, not captured by the coarse operational inputs, re-sults in tropospheric column differences up to±40 %. The spatial and temporal resolution of the NO2profiles were also
improved in the BEHR product (WRF-Chem; 4 km×4 km; monthly) in order to account for both spatial and seasonal variation. Compared with the Standard Product, the BEHR tropospheric NO2 product is roughly 30 % lower for
rela-tively clean regions and 8 % higher for urban regions where anthropogenic emissions account for a majority of the ob-served NO2.
We validate tropospheric NO2 columns from the
Stan-dard, DOMINO, and the BEHR products by comparing the OMI NO2 columns with NO2measurements collected
dur-ing the ARCTAS-CA field campaign. While previous com-parisons of this kind have required observations spanning the troposphere, we have developed a new method that converts boundary layer NO2concentrations to vertical column
den-sities. Our method vastly increases the size of the validation dataset by eliminating the need for full vertical profiles for each comparison. We find excellent agreement between in situ-derived and satellite-observed NO2vertical column
den-sities. We also observe largely improved agreement with the BEHR NO2 product over the operational products. We
in-terpret this to mean that much of the variance in current re-trievals is due not to meteorological or chemical variation, but to the low spatial and temporal resolution of the geo-physical assumptions used, as evidenced by the increase in the correlation coefficient, ranging from 0.65–0.72 in the op-erational products, to 0.83 in the BEHR retrieval. Finally, we show that MODIS cloud observations are a useful tool for filtering cloud contaminated scenes and that their use dra-matically improves agreement between satellite and aircraft observations (e.g. BEHR:R2=0.91).
Acknowledgements. The work presented here was supported by the National Aeronautics and Space Administration grant NNX08AE566 and California Air Resources Board grant 06-328. AEP would like to acknowledge funding by NASA headquarters under the NASA Earth Systems Science Fellowship Program and by NASA grant NAG5-13668. LCV would like to acknowledge funding by NASA headquarters under the NASA Earth Systems Science Fellowship Program grant NESSF09 and by NASA grant NNX08AE566. OMI data used in this effort were acquired as part of the activities of NASA’s Science Mission Directorate, and are archived and distributed by the Goddard Earth Sciences (GES) Data and Information Services Center (DISC). MODIS albedo data are distributed by the Land Processes Distributed Active Archive Center (LP DAAC), located at the US Geological Survey (USGS) Earth Resources Observation and Science (EROS) Center (lpdaac.usgs.gov).
Edited by: P. Monks
References
Acarreta, J. R., De Haan, J. F., and Stammes, P.: Cloud pressure retrieval using the O2-O2absorption band at 477 nm, J. Geophys. Res., 109, D05204, doi:10.1029/2003JD003915, 2004.
Beirle, S., Platt, U., Wenig, M., and Wagner, T.: NOxproduction by lightning estimated with GOME, Adv. Space Res., 34(4), 793– 797, doi:10.1016/j.asr.2003.07.069, 2004.
Beirle, S., Spichtinger, N., Stohl, A., Cummins, K. L., Turner, T., Boccippio, D., Cooper, O. R., Wenig, M., Grzegorski, M., Platt, U., and Wagner, T.: Estimating the NOxproduced by lightning from GOME and NLDN data: a case study in the Gulf of Mexico, Atmos. Chem. Phys., 6, 1075–1089, doi:10.5194/acp-6-1075-2006, 2006.
Beirle, S., Salzmann, M., Lawrence, M. G., and Wagner, T.: Sen-sitivity of satellite observations for freshly produced lightning NOx, Atmos. Chem. Phys., 9, 1077–1094, doi:10.5194/acp-9-1077-2009, 2009.
Bertram, T. H., Heckel, A., Richter, A., Burrows, J., and Cohen, R. C.: Satellite measurements of daily variations in soil NOx emissions, Geophys. Res. Lett., 32, L24812, doi:10.1029/2005GL024640, 2005.
Boersma, K. F., Eskes, H. J., Meijer, E. W., and Kelder, H. M.: Esti-mates of lightning NOxproduction from GOME satellite obser-vations, Atmos. Chem. Phys., 5, 2311–2331, doi:10.5194/acp-5-2311-2005, 2005.
Boersma, K. F., Eskes, H. J., Veefkind, J. P., Brinksma, E. J., van der A, R. J., Sneep, M., van den Oord, G. H. J., Levelt, P. F., Stammes, P., Gleason, J. F., and Bucsela, E. J.: Near-real time retrieval of tropospheric NO2from OMI, Atmos. Chem. Phys., 7, 2103–2118, doi:10.5194/acp-7-2103-2007, 2007.
Boersma, K. F., Jacob, D. J., Trainic, M., Rudich, Y., DeSmedt, I., Dirksen, R., and Eskes, H. J.: Validation of urban NO2 concen-trations and their diurnal and seasonal variations observed from the SCIAMACHY and OMI sensors using in situ surface mea-surements in Israeli cities, Atmos. Chem. Phys., 9, 3867–3879, doi:10.5194/acp-9-3867-2009, 2009.
Bucsela, E. J., Celarier, E. A., Wenig, M. O., Gleason, J. F., Veefkind, J. P., Boersma, K. F., and Brinksma, E. J.: Algorithm
for NO2vertical column retrieval from the ozone monitoring in-strument, IEEE T. Geosci. Remote, 44(5), 1245–1258, 2006. Bucsela, E. J., Perring, A. E., Cohen, R. C., Boersma, K. F.,
Celarier, E. A., Gleason, J. F., Wenig, M. O., Bertram, T. H., Wooldridge, P. J., Dirksen, R., and Veefkind, J. P.: Compari-son of tropospheric NO2from in situ aircraft measurements with near-real-time and standard product data from OMI, J. Geophys. Res., 113, D16S31, doi:10.1029/2007JD008838, 2008. Bucsela, E. J., Pickering, K. E., Huntemann, T. L., Cohen, R. C.,
Perring, A. E., Gleason, J. F., Blakeslee, R. J., Albrecht, R. I., Holzworth, R., Cipriani, J. P., Navano, D. V., Segura, I. M., Her-nandez, A. P., and Laporte-Molina, S.: Lightning-generated NOx seen by OMI during NASA’s TC4 experiment, J. Geophys. Res., 115, D00J10, doi:10.1029/2009JD013118, 2010.
Celarier, E. A., Brinksma, E. J., Gleason, J. F., Veefkind, J. P., Cede, A., Herman, J. R., Ionov, D., Goutail, F., Pommereau, J. P., Lam-bert, J. C., van Roozendael, M., Pinardi, G., Wittrock, F., Schon-hardt, A., Richter, A., Ibrahim, O. W., Wagner, T., Bojkov, B., Mount, G., Spinei, E., Chen, C. M., Pongetti, T. J., Sander, S. P., Bucsela, E. J., Wenig, M. O., Swart, D. P. J., Volten, H., Kroon, M., and Levelt, P. F.: Validation of ozone monitoring instru-ment nitrogen dioxide columns, J. Geophys. Res., 113, D15S15, doi:10.1029/2007JD008908, 2008.
Cleary, P. A., Wooldridge, P. J., and Cohen, R. C.: Laser-induced fluorescence detection of atmospheric NO2using a commercial diode laser and a supersonic expansion, Appl. Optics, 41(33), 6950–6956, 2002.
Franke, K., Richter, A., Bovensmann, H., Eyring, V., J¨ockel, P., Hoor, P., and Burrows, J. P.: Ship emitted NO2 in the Indian Ocean: comparison of model results with satellite data, At-mos. Chem. Phys., 9, 7289–7301, doi:10.5194/acp-9-7289-2009, 2009.
Grell, G. A., Peckham, S. E., Schmitz, S. A., McKeen, A., Frost, G., Skamarock, W. C., and Eder, B.: Fully coupled online chemistry within the WRF model, Atmos. Environ., 39, 6957–6975, 2005. Hains, J. C., Boersma, K. F., Kroon, M., Dirksen, R. J., Cohen, R. C., Perring, A. E., Bucsela, E., Volten, H., Swart, D. P. J., Richter, A., Wittrock, F., Shoenhardt, A., Wagner, T., Ibrahim, O. W., Van Roozendael, M., Pinardi, G., Gleason, J. F., Veefkind, J. P., and Levelt, P.: Testing and improving OMI DOMINO tro-pospheric NO2using observations from the DANDELIONS and INTEX-B validation campaigns, J. Geophys. Res., 115, D05301, doi:10.1029/2009JD012399, 2010.
Hastings, D. A., Dunbar, P. K., Elphingstone, G. M., Bootz, M., Murakami, H., Maruyama, H., Masaharu, H., Holland, P., Payne, J., Bryant, N. A., Logan, T. L., Mullter, J. P., Schreier, G., and MacDonald, J. S.: The Global Land One-kilometer Base Elevation (GLOBE) digital elevation model, Ver 1.0. eds. 1999. National Oceanic and Atmospheric Administration, Na-tional Geophysical Data Center, 325 Broadway, Boulder, Col-orado 80305-3328, USA Digital data base on the World Wide Web, available at: http://www.ngdc.noaa.gov/mgg/topo/globe. html and CD-ROMs, 1999.
Heckel, A., Kim, S.-W., Frost, G. J., Richter, A., Trainer, M., and Burrows, J. P.: Influence of under-sampled a priori data on tro-pospheric NO2satellite retrievals, Atmos. Meas. Tech. Discuss., 4, 1893–1934, doi:10.5194/amtd-4-1893-2011, 2011.
Hudman, R. C., Russell, A. R., Valin, L. C., and Cohen, R. C.: Inter-annual variability in soil nitric oxide emissions over the United
States as viewed from space, Atmos. Chem. Phys., 10, 9943– 9952, doi:10.5194/acp-10-9943-2010, 2010.
Jacob, D. J., Crawford, J. H., Maring, H., Clarke, A. D., Dibb, J. E., Emmons, L. K., Ferrare, R. A., Hostetler, C. A., Russell, P. B., Singh, H. B., Thompson, A. M., Shaw, G. E., McCauley, E., Ped-erson, J. R., and Fisher, J. A.: The Arctic Research of the Com-position of the Troposphere from Aircraft and Satellites (ARC-TAS) mission: design, execution, and first results, Atmos. Chem. Phys., 10, 5191–5212, doi:10.5194/acp-10-5191-2010, 2010. Jaegl´e, L., Steinberger, L., Martin, R. V., and Chance, K.: Global
partitioning of NOxsources using satellite observations: Relative roles of fossil fuel combustion, biomass burning and soil emis-sions, Faraday Discuss., 130, 407-423, 2005.
Kim, S.-W., Heckel, A., McKeen, S. A., Frost, G. J., Hsie, E.-Y., Trainer, M. K., Richter, A., Burrows, J. P., Peckham, S. E., and Grell, G. A.: Satellite-observed U.S. power plant NOxemission reductions and their impact on air quality, Geophys. Res. Lett., 33, L22812, doi:10.1029/2006GL027749, 2006.
Kim, S. W., Heckel, A., Frost, G. J., Richter, A., Gleason, J., Bur-rows, J. P., McKeen, S., Hsie, E. Y., Granier, C., and Trainer, M.: NO2columns in the western United States observed from space and simulated by a regional chemistry model and their im-plications for NOxemissions, J. Geophys. Res., 114, D11301, doi:10.1029/2008JD011343, 2009.
Kleipool, Q. L., Dobber, M. R., de Haan, J. F., and Levelt, P. F.: Earth surface reflectance climatology from 3 years of OMI data, J. Geophys. Res., 113, D18308, doi:10.1029/2008JD010290, 2008.
Koelemeijer, R. B. A., De Haan, J. F., and Stammes, P.: A database of spectral reflectivity in the range 335–772 nm derived from 5.5 years of GOME observations, J. Geophys. Res., 108 D2), 4070, doi:10.1029/2002JD002429, 2003.
Lamsal, L. N., Martin, R. V., van Donkelaar, A., Seinbacher, M., Celarier, E. A., Bucsela, E., Dunlea, E. J., and Pinto, J. P.: Ground-level nitrogen dioxide concentrations inferred from the satellite-borne Ozone Monitoring Instrument, J. Geophys. Res., 113, D16308, doi:10.1029/2007JD009235, 2008.
Lamsal, L. N., Martin, R. V., van Donkelaar, A., Celarier, E. A., Bucsela, E. J., Boersma, K. F., Dirksen, R., Luo, C., and Wang, Y.: Indirect validation of tropospheric nitrogen dioxide retrieved from the OMI satellite instrument: insight into the seasonal vari-ation of nitrogen oxides at northern midlatitudes, J. Geophys. Res., 115, D05302, doi:10.1029/2009JD013351, 2010.
Levelt, P. F., Hilsenrath, E., Leppelmeier, G. W., van den Oord, G. B. J., Bhartia, P. K., Tamminen, J., de Haan, J. F., and Veefkind, J. P.: Science objectives of the Ozone Monitor-ing Instrument, IEEE T. Geosci. Remote, 44, 1199–1208, doi:10.1109/TGRS.2006.872336, 2006.
Lin, J. -T. and McElroy, M. B.: Detection from space of a reduc-tion in anthropogenic emissions of nitrogen oxides during the Chinese economic downturn, Atmos. Chem. Phys. Discuss., 11, 193–223, doi:10.5194/acpd-11-193-2011, 2011.
Martin, R. V., Jacob, D. J., Chance, K., Kurosu, T. P., Palmer, P. I., and Evans, M. J.: Global inventory of nitrogen oxide emis-sions constrained by space-based observations of NO2columns. J. Geophys. Res., 108(D17), 4537, doi:10.1029/2003JD003453, 2003.
Martin, R. V., Sioris, C. E., Chance, K. V., Ryerson, T. B., Bertram, T. H., Wooldridge, P. J., Cohen, R. C., Neuman, J. A.,
son, A., and Flocke, F. M. Evaluation of space-based constraints on nitrogen oxide emissions with regional aircraft measurements over and downwind of eastern North America, J. Geophys. Res., 111, D23S60, doi:10.1029/2006JD007530, 2006.
Martin, R. V., Sauvage, B., Folkins, I., Sioris, C. E., Boone, C., Bernath, P., Ziemke, J.: Space-based constraints on the produc-tion of nitric oxide by lightning, J. Geophys. Res., 112, D09309, doi:10.1029/2006JD007831, 2007.
Mebust, A. K., Russell, A. R., Hudman, R. C., Valin, L. C., and Cohen, R. C.: Characterization of wildfire NOx emissions us-ing MODIS fire radiative power and OMI tropospheric NO2 columns, Atmos. Chem. Phys., 11, 5839–5851, doi:10.5194/acp-11-5839-2011, 2011.
Mijling, B., van der A, R. J., Boersma, K. F., Van Roozendael, M., De Smedt, I., and Kelder, H. M.: Reductions in NO2detected from space during the 2008 Beijing Olympic Games, Geophys. Res. Lett., 36, L13801, doi:10.1029/2009GL038943, 2009. Richter, A., Burrows, J. P., N¨uß, H., Granier, C, and Niemeier, U.:
Increase in tropospheric nitrogen dioxide over China observed from space, Nature, 437, 129–132, doi:10.1038/nature04092, 2005.
Russell, A. R., Valin, L. C., Buscela, E. J., Wenig, M. O., and Co-hen, R. C.: Space-based constraints on spatial and temporal pat-terns in NOxemissions in California, 2005–2008, Environ. Sci. Technol., 44, 3607–3615, 2010.
Schaub, D., Brunner, D., Boersma, K. F., Keller, J., Folini, D., Buchmann, B., Berresheim, H., and Staehelin, J.: SCIAMACHY tropospheric NO2over Switzerland: estimates of NOxlifetimes and impact of the complex Alpine topography on the retrieval, Atmos. Chem. Phys., 7, 5971–5987, doi:10.5194/acp-7-5971-2007, 2007
Stockwell, W. R., Middleton, P., Chang, J. S., and Tang, X.: The second generation regional acid deposition model chemical mechanism for regional air quality modeling, J. Geophys. Res., 95(D10), 16343–16367, doi:10.1029/JD095iD10p16343, 1990. Thornton, J. A., Wooldridge, P. J., and Cohen, R. C.:Atmospheric
NO2: In situ laser-induced fluorescence detection at parts per trillion mixing ratios, Anal. Chem., 72, 528–539, 2000. Valin, L. C., Russell, A. R., Bucsela, E. J., Veefkind, J. P., and
Co-hen, R. C.: Observation of slant column NO2using the super-zoom mode of AURA-OMI, Atmos. Meas. Tech. Discuss., 4, 1989-2005, doi:10.5194/amtd-4-1989-2011, 2011.
Zhou, Y., Brunner, D., Spurr, R. J. D., Boersma, K. F., Sneep, M., Popp, C., and Buchmann, B.: Accounting for surface re-flectance anisotropy in satellite retrievals of tropospheric NO2, Atmos. Meas. Tech., 3, 1185–1203, doi:10.5194/amt-3-1185-2010, 2010.