Abstract— This paper deals with the effect of the Single-Input
Multiple-Output spatial diversity on the OFDM mobile radio signal propagating in an urban channel. From measurements performed in Rio de Janeiro city, Brazil, by using two receiving antennas at diversity, the calculated capacity presented an improvement when compared to the individual one.
Index Terms— delay spread, OFDM , SIMO, spatial diversity, urban channel.
I. INTRODUCTION
Over the last years, the OFDM (Orthogonal Frequency Division Multiplexing) technique has
received special attention to the mobile radio communication in the cellular systems [1-3]. Since the
available bandwidth is divided into narrower bands, each one experimenting flat fading, this technique
presents robustness against time-varying frequency-selective fading. Therefore, such technique offers
advantages considering its ability in dealing with high-data-rate transmissions over dispersive
channels with low equalization complexity [3]. It is also an efficient solution to operate in
Non-Line-Of-Sight (NLOS) conditions, normally subject to multipath fading, because it uses cyclic prefix (CP)
in order to avoid intersymbol interference. However, the mobility demanded by the users degrades the
received signal, worsening it due to the increasing speed which leads a Doppler shift that
desynchronizes the OFDM subcarriers, consequently, causing intercarrier interference [4].
There have been some solutions to improve final user’s delivered signal. Among them is the spatial
diversity which is most referred in several studies and it has been used in the reception of the OFDM
signal. Ali et al. deals with simulations of blind estimation techniques that exploit the receive antenna
diversity [5]; Yagishita et al. [6] studies the effects of diversity in the receiving antenna using
Faster-than-Nyquist (FTN) signaling in a multipath fading channel; Kim et al. [7] analyzes the
macro-diversity in LTE-Advanced. However, most of results presented in those studies were obtained from
simulations. In this context, this paper provides experimental results for the capacity obtained in a
2.48 GHz band using the spatial diversity in a SIMO (Single-Input Multiple-Output) system. Two
branches were used in the reception of a 40 MHz-OFDM signal in the 2.48 MHz band. In order to
accomplish it, an urban channel was sounded and the signals from both branches of diversity were
Experimental Evaluation of the Mobile Radio
Channel Capacity in the 2.48 GHz Band
Uwe R. Villanueva and Gláucio L. Siqueira
Pontifical Catholic University of Rio de Janeiro CETUC/PUC-Rio, Rio de Janeiro, Brazil [email protected] and [email protected]
Leni J. Matos and Pedro V. G. Castellanos
Fluminense Federal University, Niterói, Rio de Janeiro, Brazil,[email protected] and [email protected]
Leonardo H. Gonsioroski
simultaneously and independently obtained and processed off-line. The capacity per band (in bps/Hz)
of each branch was calculated and compared to the SIMO capacity.
For such purpose, this paper consists of five additional sections. Section II describes the
specifications of the system and the environment sounded in the measurements, in addition to the
OFDM signal transmitted to the channel; Section III provides a brief summary of the channel function
and the capacity calculation for SISO (Single-Input Single-Output) and SIMO systems; Section IV
presents the results, and Section V provides the conclusion.
II. MEASUREMENT ENVIRONMENT AND SYSTEM SPECIFICATIONS
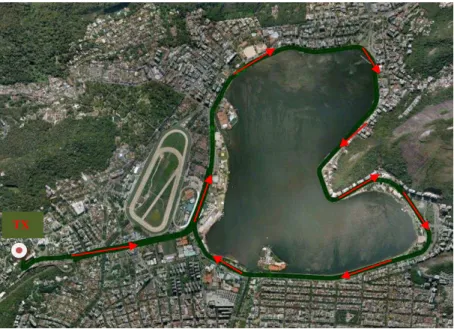
Fig. 1 presents the sounded area where measurements were carried out which covers Gávea, Leblon
and Lagoa surroundings in Rio de Janeiro. The transmitting station was installed at Kennedy building
located at PUC-Rio University, [8]. The sounded area was characterized as an urban area and the
arrows show the sense of the movement during the sounding of the channel.
The transmission setup includes a vector signal generator, a power amplifier and a vertically
polarized sector antenna fixed on the geographical coordinates 22.978976oS/ 3.232598oW. The
antenna was placed on the top of a 49 m high building. The receiving equipment was installed inside a
moving vehicle, at an average speed of 65 km/h. Two omnidirectional antennas and two branches of
reception and a Garmin GPS (Global Positioning System) were mounted on its top. The reception
setup for the wideband channel sounder was employed according to Gonsioroski [9] using the
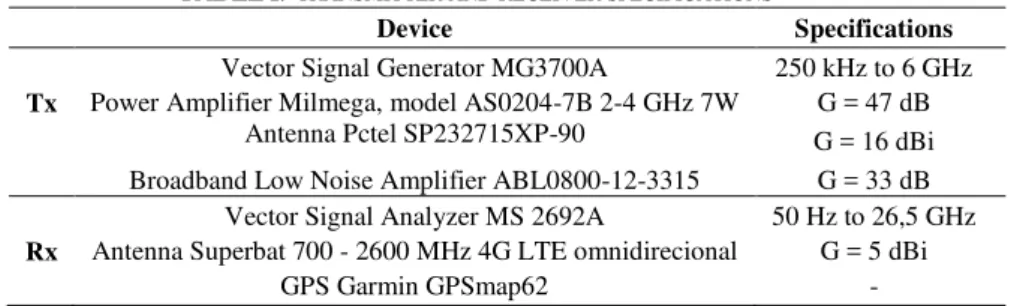
multicarrier technique, however, two branches of diversity were here used. Table I provides the main
specifications of the transmission (TX) and the reception (RX) system.
TABLEI. TRANSMITTER AND RECEIVER SPECIFICATIONS
Device Specifications
Vector Signal Generator MG3700A 250 kHz to 6 GHz Tx Power Amplifier Milmega, model AS0204-7B 2-4 GHz 7W G = 47 dB
Antenna Pctel SP232715XP-90 G = 16 dBi
Broadband Low Noise Amplifier ABL0800-12-3315 G = 33 dB Vector Signal Analyzer MS 2692A 50 Hz to 26,5 GHz Rx Antenna Superbat 700 - 2600 MHz 4G LTE omnidirecional G = 5 dBi
GPS Garmin GPSmap62 -
Fig. 2 illustrates the RX setup that operates with two identical antennas separated by 0.50 m distance
(d), placed on the roof top of a van. Inside the van, the reception system for each antenna was
separated and each one consisted of one low noise amplifier (LNA), a vector signal analyzer and a
dedicated computer. The analyzer collected the samples in quadrature, in a 100 Msamples per second
rate. The spacing used between the antennas certifies the decorrelation between the received signals (s
and s') from both branches of diversity. The verification was possible by calculating the correlation
between them through the Pearson correlation coefficient [10], defined as:
(1)
with si and si' representing the samples of the signals in each antenna and s and s' representing the
arithmetic means of s and s', respectively. The calculated value was C = 0,0061, i.e., the correlation
between the signals received from the antennas is equal to 0,61% indicating a negligible correlation,
which confirms that 0,50 m guarantees good decorrelation.
5 dBi omnidirectional antenna
(INSIDE THE CAR)
4
Fig.2. Diversity reception system.
III.TRANSMITTED SIGNALS AND PROCESSING
A. OFDM Transmitted Signal
Table II shows the main characteristics of the OFDM signal that was generated in MATLAB
software. The spectral efficiency of this signal is assured by the orthogonality of the subcarriers,
which are linearly independent. Like occurred in Gonsioroski [9], the OFDM signal was modulated
33 dBi LNA ABL0800-12-3315
Vector Signal Analyzer MS2692A
33 dBi LNA ABL0800-12-3315
Vector Signal Analyzer MS2692A
Laptop
by a pseudo-noise (PN) sequence of 2047-bits length. The number of OFDM samples (NFFT = 2048)
was increased by 1/16 x NFFT , which corresponds to the cyclic prefix interval inserted between the
OFDM symbols to accommodate the time dispersion of the signal that arrives at the receiver. Via
network cable, the modulated signal was conducted to the vector signal generator, which sent the
signal on the 2.48 GHz carrier to the power amplifier, followed by the antenna and for radiating and
sounding the channel. Such sequence helped to identify the OFDM symbols in the off-line processing
because of its correlation property [11].
TABLE II. MAIN PARAMETERS OF THE OFDM TEST SIGNALS
Parameter Value Unit
Bandwidth 40 MHz
Size of the FFT 2048 Samples
Sampling Factor 2 -
Sampling Rate 100x106 Samples/second Number of Carriers 1600 Carriers
Cyclic Prefix 1/16 Samples
B. Channel response
In order to determine the capacity of the experimental channel, the channel gain must be calculated
in each diversity branch. For that purpose, the data acquired from the measurements were saved in I
(In-phase) and Q (Quadrature) components, therefore, the samples are complex values. From them,
the mean power of each OFDM symbol (S) was calculated.
The mobility of the receiver leads to a time variant channel and its impulsive response is shown in
the time/delay domain, i.e., h (t ,), which means the response in a t instant of an impulse sent
seconds before [12]. For that reason, the mobility results, in different responses, during the same
channel monitoring time. As far as the WSSUS (Wide Sense Stationary Uncorrelated Scattering)
condition is concerned, the channel can be represented by a unique h (t,) random function.
In the sequel, the received data were convolved with a filter matched to the transmitted signal in
order to provide the channel impulse response as can be demonstrated as follows.
Supposing that s(t) corresponds to the signal transmitted through a channel and that s'(t,) refers to
the signal that arrives at the reception as a sum of N multipath of the transmitted signal, whose
amplitudes are represented as ai , delays as i e phase as i, i.e.:
, (2)
disregarding the modulation, and taking Ci = ai e ji
in (2), the received signal is:
The matched filter is defined as:
(4)
Therefore, the signal after the matched filter is:
(5)
Convolving (3) and (4) and substituting in (5):
(6)
(7)
If s(t,) = (t,) is an impulsive signal at the input of the channel, the impulsive response is the
output of the channel, i.e.:
(8)
Comparing this identity to (3), the impulsive response is:
(9)
As s(t, ) = (t,), thus s(t - i, )= (t - i,), which is substituted in (9), obtaining:
(10)
Substituting s(t,) = (t,) in (5), the autocorrelation Rs (t - i ,) can be simplified to ( t - i, ) and
we conclude that the output of the matched filter in (5) corresponds to the transfer function of the
channel in (10) when an impulsive input is used. In short, with a transmitted signal as similar as an
impulse it will be possible achieve the transfer function of a channel, if the received signal passes
through a matched filter. Therefore, the absolute value of the power delay profiles (PDPs) for the
sounded channel [12] can be calculated as:
(11)
and Ph (t,) represents the complex power of all multipath that arrive at the receiver antenna in each
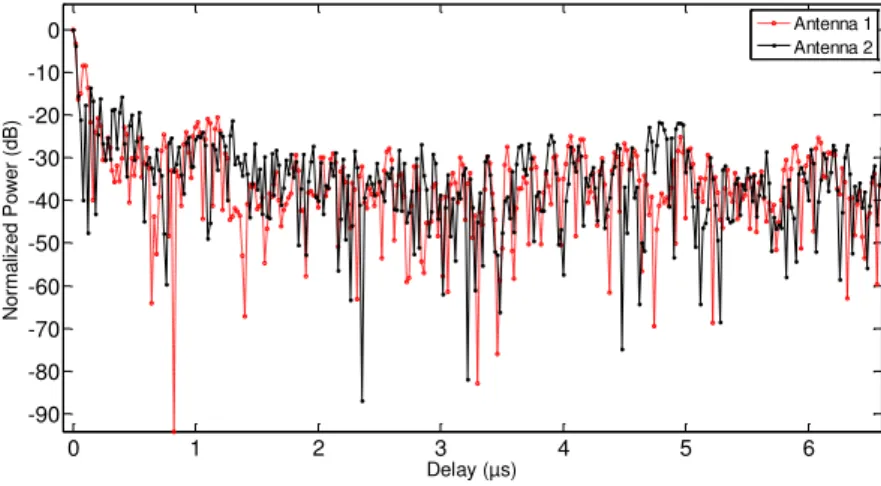
time instant. Fig. 3 exemplifies two PDPs obtained at the same time in the RX antennas, showing
different multipath receptions from different branches of diversity. PDPs and GPS positions were
saved in files. Through the profiles obtained, it was possible to observe and analyze the dispersiveness
of the channel. The variation of RMS (Root Mean Square) delay spread [12] calculation is
demonstrated in Table III for each diversity link named L1 (related to antenna 1) and L2 (related to
parameters had a large variation and just one PDP was not able to represent the channel. In this case,
the time-variant channel does not allow us to consider stationarity, which can only be applied in small
intervals of the measured path [12]. Consequently, the channel gain is a variable.
0 1 2 3 4 5 6
-90 -80 -70 -60 -50 -40 -30 -20 -10 0
Delay (µs)
N
o
rma
lize
d
Po
w
e
r
(d
B)
Antenna 1 Antenna 2
Fig. 3. PDPs of two diversity branches.
According the results, the time dispersion along all path varies around 2 microseconds, from
hundreds of nanoseconds until some microseconds, which lead us to conclude that the channel
behaves as urban one at most of the time, and varies between less dense to more dense [8], [12].
TABLE III. TEMPORAL DISPERSION PARAMETERS.
Antenna Link RMS Delay Spread (s) 1 L1 0.172 - 4.438 2 L2 0.223 - 4.253
The mean noise power (PN) in each OFDM symbol was also calculated as [13]:
(12)
in which:
(13)
and RBW is the band of the resolution filter used in the spectrum analyzer, NBW is the equivalent
band of noise spectrum, BS is the band of the transmitted symbol (40 MHz), n is the number of the
noise samples inside the band of 40 MHz and Pi is the power of each noise sample. Such samples
were obtained along the route without turning on the transmitter, only acquiring noise samples and
saving them for post processing. The measured noise of the channel was - 141 dBm/Hz. In the 2.48
GHz band the ambient noise floor was limited by the noise floor [14] of the measurement system and
it was not possible to acquire measurements in the 1250-2700 m range. By using the dfittool function
of Matlab, the amplitude samples of the noise presented a better adjustment to the Gaussian
statistics, therefore, allowing us to use the most largely equations found in literature for calculating
C. Capacity in SISO and SIMO systems
If compared to a SISO, either SIMO or MISO (Multiple-Input Single-Output) systems can provide
significant improvement in communication quality (bit error rate - BER) as well as in capacity, by
using multiple antennas to provide space diversity. The expressions needed to calculate capacity in
bps will be provided in the following paragraph.
For an out of memory system, the maximum capacity of a wideband SISO system in a Gaussian
channel is writtenby [15]:
) (14)
in which is the mean signal-to-noise ratio (SNR = S/PN) at the receiving antenna and h(t, ) is the
complex channel gain.
The same process occurs in memoryless wideband SIMO system, in which each reception channel
is independent from the other, if is a constant mean in the environment of a Gaussian noise, the
maximum channel capacity, in bps, is calculated from:
(15)
in which hi is the channel gain related to each branch of diversity, therefore, |hi(t, )| 2
means the
absolute value of the power delay profile and n is the number of receiver antennas.
In a random time variant channel, the maximum capacity, due to the diversity in a SIMO receiver, is calculated from [14]:
(16)
with H meaning the N x 1 channel gain, HH is the transposed matrix of H, and N is the number of
receiver antennas. In this test two diversity branches were used, therefore:
(17)
in which H11 and H22 represent the channel gains on the diversity branches TX-RX1 and TX-RX2,
respectively.
IV. RESULTS
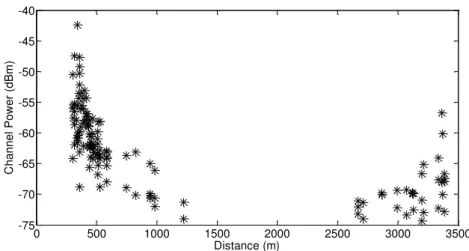
Fig. 4 depicts the OFDM power levels signal received along the whole route. Those values were
obtained in the marked distances associated to different time instants. In most cases, they decreased
up to 1250 meters. LOS and NLOS links appear throughout that distance. From approximately 1250
to 2700 m, the received power level remained below the spectrum analyzer threshold. When distance
reached 2700 m length, peaks and valleys of power were detected. In the final distances high values
were observed and they occurred due to the contribution of water reflections and the LOS link since
km distances were considered were considered for diversity gain calculation.
0 500 1000 1500 2000 2500 3000 3500
-75 -70 -65 -60 -55 -50 -45 -40
Distance (m)
C
han
nel
Pow
er
(dBm
)
Fig. 4. Power level of the received signal along the whole route.
Neither ( SNR) nor the channel gain, h(t, ), remainedconstant in the entire sounded route in
Fig. 1. Consequently, equations (14) and (17) were calculated for each power delay profile obtained
related to received OFDM symbol. Different capacities per band are depicted in Fig. 5 for both
diversity branches, confirming that the capacity proportionally increased with the SNR.
-100 -5 0 5 10 15 20 25 30
0.5 1 1.5 2 2.5
Signal to Noise Ratio (dB)
N
o
rma
lize
d
C
a
p
a
ci
ty
b
p
s/
H
z
Antenna 1 Antenna 2
Fig. 5 - Capacity/band versus SNR for both diversity branches.
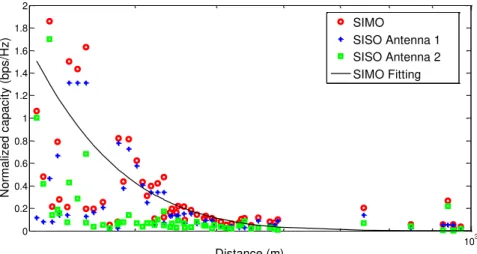
Fig. 6 shows capacities decreasing while transmitter distance increases. The curve shows the SIMO
values capacity adjustment, which resulted in a capacity gain as the application of spatial diversity
was used. However, the capacity gain is better performed in smaller distances since the mean signal
power decreases with distance and strongly affects the capacity calculus, whereas the mean noise
signal practically remains the same.
The results are compacted in Table IV in which improvement on capacity can be observed as well
103 0
0.2 0.4 0.6 0.8 1 1.2 1.4 1.6 1.8 2
Distance (m)
N
orm
aliz
ed
c
apa
c
it
y
(bp
s
/H
z
)
SIMO
SISO Antenna 1 SISO Antenna 2 SIMO Fitting
Fig. 6. Experimental capacity/band.
TABLE IV. EXPERIMENTAL CAPACITY
Capacity/band bps/Hz Transmission rate (Mbps) SISO - Branch 1 0.003 to 1.3 0.12 to 52 SISO - Branch 2 0.007 to 1.7 0.28 to 68 SIMO - Branches 1 and 2 0.100 to 1.86 4.00 to 74.4
V. CONCLUSIONS
It is essential to study the channel behavior in urban areas for implementing LTE technology and
reaching a good system planning, searching for the transmission rate possible in this kind of channel.
Such rate is low in this environment typically urban, in general, and the diversity technique is one of
the possible solutions to increase it.
In order to evaluate the experimental results of the 1 x 2 SIMO system, measurements on the 2.48
GHz band were carried out in an outdoor channel. OFDM symbols of 40 MHz were transmitted and
the channel response was calculated. With two omnidirectional antennas in the reception side, I and Q
samples of the wideband signal were acquired independently at both diversity branches. By matched
filtering of the complex signal measured, the power delay profiles were determined. The results for
the RMS delay spread are typical of a urban environment with values from not overcoming 4 s. Such
results permit maximum transmission rates that vary from hundreds of kbps to some Mbps [17]. It is
worth to say that these are raw rates with no equalization or codification applied.
T
he noise power and the signal power of the OFDM were calculated for obtaining thesignal-to-noise ratio. Finally, the channel capacity was calculated for each reception branch and also combined
for providing the total capacity of the SIMO system. On the branch 1 of diversity, the rate varied from
0.12 to 52 Mbps while its varied from 0.28 to 68 Mbps on the branch 2. Accordingly, the transmission
rate using the 1 x 2 SIMO system without other resources as equalization or codification has
presented a better transmission rate, yielding rates varying from 4 to 74.40 Mbps, depending on the
ones of 1.24 Mbps for the antenna 1 and 9.26 Mbps for the antenna 2. Thus, the spatial diversity
improved the mean transmission rate. These results are not so good as those obtained in indoor
channels [18], in which there is more contribution of multipath, in general, and they have used MIMO
instead of SIMO. However, they are inside the range simulated by Cueto et al. [16] in which mean
values of throughput ranged from 0.025 to 2.85 bps/Hz for a 40 MHz OFDM transmitted in
modulations increasingly robust, varying from QPSK with 1/8 code rate to 64 QAM with 3/4 code
rate.
In future works, 1 x 2 SIMO system will be experimentally tested, including other urban channels,
in order to verify the improvement in the spectral efficiency on this kind of channel. Moreover, 1 x 3
SIMO will be tested and comparisons will be made with 2 x 2 MIMO.
ACKNOWLEDGEMENT
Author thanks CAPES for the scholarship provided.
REFERENCES
[1] J. P. Niu, D. Lee, X. Ren, G. Li, and T. Su, "Scheduling Exploiting Frequency and Multi-User Diversity in LTE Downlink Systems", IEEE Trans. on Wireless Communications, vol. 12(4), pp. 1843-1849, April 2013.
[2] J. G. Andrews, A. Ghosh, and R. Muhamed, Fundamentals of WiMAX: Understanding Broadband Wireless Networking, Prentice Hall, 2007.
[3] Y. G. Li and G. L. Stuber, Orthogonal Frequency Division Multiplexing for Wireless Communications, Springer, 2006. [4] Y. G. Li and L. J. Cimini, "Bounds on the interchannel interference of OFDM in time-varying impairments", IEEE
Trans. on Communications, vol. 49, no. 3, pp. 401-404, March 2001.
[5] H. Ali, A. Doucet, and Y. Hua, "Blind SOS subspace channel estimation and equalization techniques exploiting spatial diversity in OFDM systems", Digital Signal Processing, Springer, vol. 14, no. 2, pp. 171-202, March 2004.
[6] K. Yagishita, Y. Kakishima, and M. Sawahashi,, "Effects of antenna receiver diversity with Faster-than-Nyquist signaling using OFDM/OQAM in multipath fading channel", International Symposium on Wireless Personal Multimedia Communications (WPMC), 2014, pp. 351-355, Sep. 2014.
[7] G. B. Kim, J. Lee, Jac, and S. J. Hong, "Analysis of Macro-Diversity in LTE-Advanced", KSII Trans. on Internet and Information Systems, vol.5(9), pp.1596-1612, Sep.2011
[8] U. R. Villanueva, G. L. Siqueira, L. J. Matos, L. H. Gonsioroski and P. V. G. Castellanos, "Propagation Channel Characterization in the 2.48 GHz Frequency Band in an Urban Area", in IMOC'15, PE, Brazil, 2015, pp. 1-5.
[9] L. H. Gonsioroski, L. da Silva Mello, C. R. Ron, and L. J. Matos. (2015, vol. 14). Characterization of a Mobile Urban Radio Channel with an Improved Multicarrier Sounding Technique, Journal of Microwaves, Optoelectronics and Electromagnetic Applications [Online], SI-158-SI-167.Available: http://www.jmoe.org/index.php/jmoe/article/view/ 517.
[10]J. Benesty et al., Noise Reduction in Speech Processing, Springer-Verlag Berlin Heidlberg, 2009.
[11]M. Goresky and A. Klapper, "Pseudonoise Sequences Based on Algebraic Feedback Shift Registers", IEEE Trans. on Information Theory, vol. 52, no. 4, April 2006, pp. 1649-1662.
[12]J. D. Parsons, The Mobile Radio Propagation Channel, John Wiley & Sons, 2nd. Ed., 2000. [13]C. Rauscher,Fundamental of Spectrum Analysis, Rohde & Schwarz,Germany, 2001.
[14]R. Leck, Results of Ambient RF Environment and Noise Floor Measurements Taken in the U.S. in 2004 and 2005,
Commission for Basic Systems Steering Group on Radio Frequency Coordination, 1-18 March 2016.
[15]D. Tse and P. Viswanath, Fundamentals of Wireless Communication, USA, Cambridge University Press, 2005. [16]D. Y. N. Cueto, L. A. R. Silva Mello, and C. V. R. Ron, "Comparison of Coverage and Capacity of LTE-Advanced
Networks at 700 MHz and 2.6 GHz", IMOC 2013, RJ, Brazil, 2013, pp. 1-5.
[17] T. S. Rappaport, Wireless Communications–Principles and Practice, Prentice Hall, 1996.