The Quartz Crystal Microbalance: a Tool
for Probing Viscous/Viscoelastic
Properties of Thin Films
Mario Alb erto Tenan
Centro de Ci^encias Exatas e de Tecnologia Universidade de Mogi das Cruzes 08780-911 Mogi das Cruzes, SP, Brazil
and
David Mendes Soares
Instituto de Fsica `Gleb Wataghin' Universidade Estadual de Campinas, Unicamp
13083-970 Campinas, SP, Brazil
Received29Octob er,1998
Techniques based upon the electrical response of the quartz crystal microbalance (QCM) have been widely used in laboratories as routine tools. In this article we present and discuss applications of the QCM (or its variant, the electrochemical quartz crystal microbalance, EQCM ) to the viscoelastic characterization of lms. It is pointed out that correlations between the motion of quartz crystal and contacting lms and overlayers as well as the inuence of the electronic circuit on the electric state of the whole system are of fundamental importance in interpreting the results.
I Introduction
Techniques based upon the frequency response of a quartz crystal resonator have been widely used to in-vestigate thin lms properties. As a matter of fact, a wealth of physicochemical information on a variety of systems has been obtained in recent years. Good ex-amples are provided by Refs. [1-5]
Devices which comprise a thin AT-cut quartz crystal plate acted on harmonically by an electronic driver are very sensitive to deposition or accumulation of surface mass. Although sensitivity is not restricted to mass changes, this kind of apparatuses is known as quartz crystal microbalance, or QCM for short.
In the late 1950s, Sauerbrey[6] pioneered the quan-titative description of the QCM behavior. Taking into account the physical nature of the motion of the crys-tal resonator, he was able to predict the resonant fre-quency decrease caused by a thin overlayer. Sauerbrey's
investi-gate uids properties.
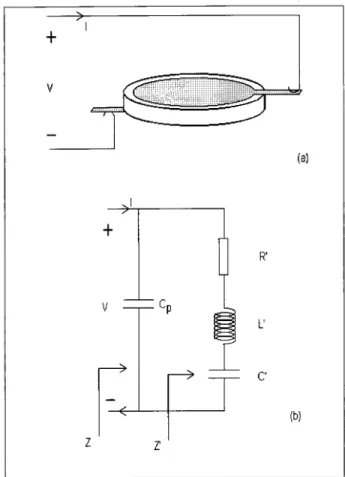
Impedance/admittance analysis, i. e. the record of the spectrum of electrical impedance/admittance of the compound resonator (crystal plus viscous/viscoelastic media) as a function of the exciting frequency, has changed the focus of study from the physical behavior of the system to its electrical behavior. To this pur-pose methods based on the Butterworth-van Dyke cir-cuit [22] has been used quite eectively. Basically, the equivalent circuit consists of two branches. One branch contains a simple capacitor to take account of the over-all capacitive eects due to (i) the parover-allel electrodes de-posited on the crystal surfaces and (ii) those introduced by external electrical connections. The other branch consists of a series connection of an inductance, a ca-pacitance and a resistance. These components in the series branch (motional arm) of the equivalent circuit are determined by the physical properties of the quartz and of the loading layers, in particular, the series re-sistance can be interpreted as a measure of mechanical losses in the compound resonator. Based on this equiv-alent circuit, many researchers have investigated the properties of gases [23], liquids [24-29], interfaces [30], viscoelastic media [31, 32] and sensors [33].
Another electrical analogue description of a lay-ered compound resonator's behavior models the sys-tem as a transmission line[34]. Many authors have taken this kind of approach to relate the observed impedance/admittance spectra to overlayer and inter-face properties [9,35-39].
Although the electrical studies could give valuable contributions to the investigation of lm's properties, they can often mask the physical insight into the de-tailed nature of the loading mechanisms [40, 41]. Mod-els which take into account the correlations between the motion of the quartz and overlayer, as well as the inu-ence of the electronic circuit on the electrical state of the whole system are of fundamental importance in in-terpreting the results obtained with the help of a QCM [42].
II The Quartz Crystal
Mi-crobalance
The QCM consists basically of an AT-cut piezoelec-tric quartz crystal disc with metallic electrode lms deposited on its faces (Fig. 1). One face is exposed to the active medium. A driver circuit applies an ac signal to the electrodes, causing the crystal to
oscil-late in a shear mode, at a given resonance frequency
f
r es. The quartz crystal microbalance has been
rou-tinely used for the determination of mass changes in air or in vacuum (metal-vapor deposition). Measured res-onance frequency shifts, f
r es, are converted into mass
changes by the well-known Sauerbrey equation[6]. The resonant mechanical oscillations are basically xed by the crystal thickness, whereas the damping depends on the characteristics of the mounting and the surround-ing medium [32]. The use of the QCM in a liquid medium together with electrochemical techniques in-creased enormously the possibilities of this tool. For this kind of application the microbalance is called the electrochemical quartz crystal microbalance, EQCM. The face in contact with the electrolyte constitutes the working electrode in an electrochemical cell, Fig. 2.
Figure 1. (a) Quartz crystal disk with gold electrode lms. (b) Equivalent circuit.
that the series-resonant mode depends on the \mass factor" L
0 and the \spring constant factor" C
0 of the
crystal [42]. At this frequency inductor (capacitance
L
0) and capacitor (capacitance C
0) are series-resonant
and the crystal impedance is essentially resistive (re-sistance R
0). On the other hand, the parallel-resonant
mode depends on the mass factor L
0 and on the
ca-pacitance C
P of the electrodes having the crystal as a
dielectric. At this frequency the terminal impedance of the crystal is resistive and very high (resistance>>R
0).
To take account of resonances at overtones otherRLC
series arms should be added in parallel to the R 0
L 0
C 0
branch of Fig. 1.
Figure 2. Schematic of an EQCM device. RE: reference elec-trode, CE: counter electrode and WE: working electrode.
Most QCMs are driven by known oscillator circuits (Pierce, Collpits, Hartley etc.)[43]. Those circuits allow only the monitoring of the resonant frequency changes for low damping media. In a liquid medium, they can be forced to oscillate, but mass change measurements must be correctly interpreted by taking into account the viscous/viscoelastic properties of the medium as shown in Ref. [44].
A nonconventional driver was proposed by Soares [32] for EQCM applications when damping must be taken into consideration during the experiment. It con-sists of a controlled gain voltage amplier with posi-tive feedback. The voltage gain being determined by a potentiometer. By increasing the potentiometer re-sistance P just to the start of oscillations, the
ampli-er oscillates in the sampli-eries-resonant mode withP =R 0
thus allowing the monitoring of both the resonant fre-quency changes, f
r es, and R
0 values. Consequently,
the power of the modied EQCM [32] resides in its abil-ity of making measurements of viscoelastic properties of lms (for example, polymer lms and sol-gel phase transformations [39,45,46].
One of the rst applications of this setup was to
show that f
r es depends on R
0. This dependence
being related to C
P and to the phase angle added by
the driver. Measurements of f
r es, with corrections
for R
0 were published in Ref.[44], and an
applica-tion of the modied EQCM for the electrodeposiapplica-tion of polypirrole lms can be found in Ref.[47]. It should be stressed that the same dependence should be taken into account when using the conventional oscillator cir-cuits cited above. The main diculty is that they do not give the value ofR
0, and the corrections for f
r es
measurements become impossible.
Conventional use of the EQCM was done for study-ing double layer structure changes at gold electrodes when no viscoelastic eects were detected. Species in the outer and inner Helmholtz layer, ion solva-tion and ion pair formasolva-tion, adsorbed ions, etc., were responsible for the measured frequency shifts[48]. Also the electrodeposition and stripping of CdTe were investigated[49].
III Physical Model
The aim of this section is to present the main points of the model with which one can relate the electrical properties of the resonator to the mechanical proper-ties of the contacting media. Consider a thin trans-ducer plate of thicknessd
q with electroded major faces
(each of area A) normal to the y-direction (see Fig.
3). If its lateral dimensions are large compared with thickness, the plate can be considered to be laterally innite in extent. Moreover, for an AT-cut quartz plate one deals with purely thickness-shear propagat-ing waves[50], i.e. owpropagat-ing to the piezoelectric properties and crystalline orientation of the quartz, the applica-tion of a voltage between the electrodes results in a shear deformation of the plate. The crystal can be electrically excited into a number of resonant modes (harmonics), each corresponding to a unique standing shear wave pattern across the thickness of the crystal plate (y-direction). One of the resonator's face (y= 0)
contacts a viscoelastic lm of thickness d
f immersed
in rather thick layer of a Newtonian liquid, whereas the opposite face (y =,d
q) makes contact with air. The
Figure 3. Compound resonator geometry.
The semi-innite layer of Newtonian liquid is char-acterized by its density
land viscosity
l, and the
vis-coelastic lm by its density
f, shear storage modulus G
0
f and viscosity
f. For quartz we consider the
follow-ing parameters: density
q, shear modulus c
66,
piezo-electric constante
26and dielectric constant at constant
strain"
22. To take account of dissipation in the quartz
plate a phenomenologicalviscosity
q[9] can also be
con-sidered (its value should be chosen such as to set the quality factor of the unloaded resonator to10
5 [41]).
The behavior of the compound resonator is de-scribed in terms of the shear displacement in the x
-direction,u
x, which obeys the wave equation @ 2 u x @t 2 = G @ 2 u x @y 2 ; (1)
where stands for the quartz density (wave
propagat-ing in the quartz plate) or the lm density (wave prop-agating in the lm), andG, the complex shear
modu-lus, is given by G c 66+ e 2 26 " 22 + i !
q (wave in the
quartz plate) orGG f+
i !
f (wave in the lm).
In these denitions, the symbol ! represents the
an-gular frequency of the propagating wave. It should be stressed that the shear modulusGfor the quartz plate
as dened above comprises the contributions of both the mechanical and electrical properties of the crystal: To derive Eq. (1) for the displacementu
xin the quartz
one must take into account the constitutive equations for the piezoelectric material. Those constitutive equa-tions interrelate the electric and the mechanical vari-ables [51].
On the other hand, in the liquid or in air, descrip-tion is made appropriately in terms of the uid velocity,
v
x, which obeys the Navier-Stokes equation [52] @v x @t = @ 2 v x @ 2 y ; (2)
with() representing density (viscosity) in each uid.
The solutions of Eq. (1) are obtained for shear waves having a harmonic time-dependence (e
i !t) and
shaped as the superposition of waves travelling in op-posite directions. Since the Newtonian uid layers (liq-uid and air) are very thick, solutions of Eq.(2), with the same time-dependence e
i!t, describe
perturba-tions that vanish for large jy j and represent an energy
outow. The solution of the set of Eqs. (1) - (2) for the shear displacementu
xand velocity v
xcan be
deter-mined univocally by imposing the following boundary conditions: (i) vanishing velocity at an innite distance from the plate, (ii) continuity of velocity at any inter-face (no-slip condition), (iii)continuity of shear stress across the liquid layer/viscoelastic lm interface and (iv) Newton's equation for each electrode which is as-sumed to be a rigid lm of negligible thickness. As a further condition, (v) the electric potential dierence across the crystal faces must be equal to the oscillating voltage applied to the electrodes. The current result-ing from the application of the voltage can be deter-mined by the time derivative of the electric displace-ment, which in turn is related to the mechanical vari-ables of the transducer[50]. From a knowledge of the current, the electrical behavior of the compound res-onator under impedance/admittance analysis can be derived. It should be stressed that the analysis is purely physical, without use of any electrical analogues.
Some illustrative results of the model are presented in Figs. 4-6, for which the following typical parame-ters' values were considered: Amplitude of the applied voltage: V
0= 1 V, capacitance of the external
connec-tions: C
ext = 10 pF, 6-MHz crystal plate thickness: d
q = 0
:28 mm, electrodes area: A = 0:28 cm 2, and
viscoelastic lm thickness and density: d f = 1
m and
f =1 g/cm
3, respectively. Each electrode was
consid-ered to have a thickness d
e = 200 nm and a density
e = 19
:3 g/cm
3 (gold). As typical values for density
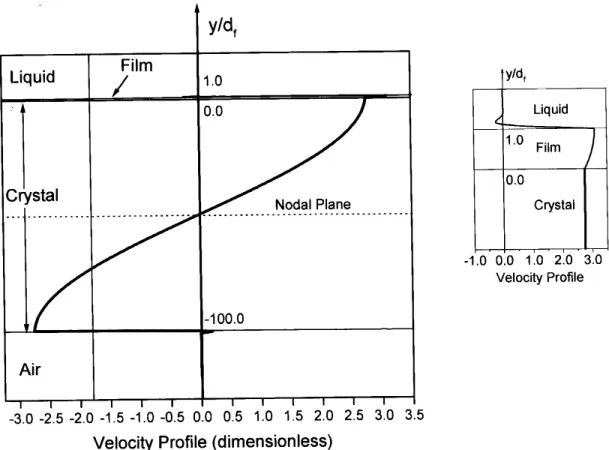
Figure 4. Velocity prole at a time when the disturbance in the quartz plate is a maximum. Inset shows in detail the prole in a small region containing the thin lm.
Figure 5. (a) Susceptance-conductance plots in the resonance region. (b) Admittance phase as a function of the exciting frequency (!0
= 3:28410
7 rad/s). In (a) and (b), the solid lines refer to the total admittance of the compound resonator,
Fig. 4 depicts the shear wave in the compound res-onator. The wave is described by the velocity prole at a time when the quartz disturbance is a maximum. In its fundamental mode the crystal plate oscillates back and forth relative to a nodal plane located in the middle region of the plate (dashed line in Fig. 4). A damped shear wave is radiated into the liquid contacting the lm and also into the air layer making contact with the opposite crystal face. Inset in Fig. 4 details the wave prole in a small region containing the lm.
Model prediction for the electrical behavior of the loaded crystal can be seen in Figs. 5a and 5b. The parametric circle (solid line) in Fig. 5a was obtained by calculating the conductance (real part of the ad-mittance) and the susceptance (imaginary part of the admittance) as functions of the oscillating angular fre-quency !. The resulting admittance locus is typical of
an electric network containing a capacitance connected in parallel with a R
0
L 0
C
0 series branch [53]. For
ad-ditional information on the oscillator admittance the reader is referred to the solid line in Fig. 5b, which is a graph of the admittance phase as a function of!.
If the contributions of the parallel capacitances (external capacitance and electrodes capacitance) are subtracted from the total admittance one obtains the dashed lines in Figs. 5a and 5b. Those curves corre-spond to the admittance of a RLC series connection.
The dashed line in Fig. 5b favors this interpretation: at low frequencies the phase angle tends to +900, which
corresponds to a capacitive admittance, and in the op-posite limit the phase angle approaches -900, indicating
an inductive behavior.
In Fig. 5b three frequencies should be distinguished, namely those at which the admittance phases are zero. At the lowest one (!m) the conductance is a maximum
(1/R
0 in Fig. 5a). In terms of the equivalent circuit
description !m is the frequency at which the motional
arm resonates, representing a resonance intrinsic to the mechanical properties of the compound oscillator. The other two frequencies (!s and !p) correspond to the
frequencies at which the susceptance is zero. The sus-ceptance rst vanishes at frequency!s, which is slightly
higher than!m. At frequency!sthe admittance
mag-nitude is virtually a maximum and for this reason it is usually called the \series-resonant " frequency. The sus-ceptance also vanishes at frequency !p, for which the
admittance magnitude and thus the current are very small, analogous to a parallel resonance [9].
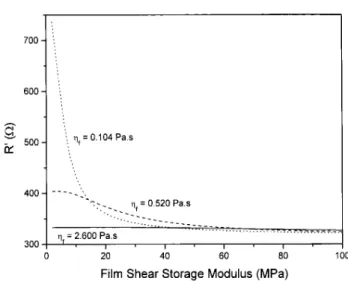
Finally, Fig. 6 illustrates the inuence of the
me-chanical properties of the viscoelastic lm on the elec-trical behavior of the resonator. That gure shows the motional arm resistance R
0 as a function of the lm
shear storage modulus G 0
f for dierent values of the
lm viscosityf. Film thickness and density are xed
at 1.0m and 1.0 g/cm
3, respectively.
Figure 6. Plots of resistance R
0 as a function of the shear
storage modulus G 0
f, for dierent lm viscosities.
The behavior of the viscoelastic lm is quite com-plex, and depends on the interplay between the mate-rial's mechanical properties, the shear wavelength and the lm thickness. At higher values of the storage shear modulus (G
0
f above80 MPa) the resistance becomes
practically independent of the lm viscosity; its value (320 ) is close to that due to the Newtonian liquid
overlayer[42]. This behavior is consistent with that of a rigid lm that oscillates in phase with the crystal sur-face. Energy is thus dissipated almost entirely in the contacting liquid medium. Friction within the lm con-tributes very little to the resulting resistance. On the other hand, for 2 MPa.G
0
f .10 MPa friction within
the lm becomes dominant. In this range of values for G
0
f the resistance decreases as the lm viscosity
increases and approaches a limiting value of 320
peculiar to a rigid lm in contact with the Newtonian liquid. The prediction that thin lms of low viscosity increase considerably the resistance R
0is in qualitative
IV The EQCM as a Sensor
for Viscoelastic Changes in
Thin Films
As previously discussed, changes of the viscoelas-tic properties of the quartz contacting phases (liq-uid and/or lm) cause changes of both, L
0 and R
0
[46,53,54]. Furthermore, it was shown[25] that changes of the surface morphology of rigid lms can also lead to changes ofR
0
A convenient way to monitor the measured pa-rameters changes during an experiment is to use the impedance plane Z = R+ i X, where X =
2 f r es
L
0 [46]. The relationship 2 L
0 f
r es = f
r es L
0 [42] allows us to use resonant frequency
changes instead of the parameter change L
0 in the
imaginary axis of the impedance plane. SinceR 0causes
an additional frequency shift, results of frequency mea-surements can not be related straightforwardly to mass changes. The eect depends on the type of the driver used [32]. Thus it is necessary to obtain previously the calibration curve of the EQCM in the Z-plane. This can be done by plotting the observed f
r es and R
0
for known Newtonian uids (air as a reference sys-tem, water, and aqueous sucrose solutions, for exam-ple). As 4L
0 f
r es
=R = 1, a 45
0-slope line is
ob-tained in the impedance plane[42]. The dierence be-tween the measured values and the expected 450-slope
line constitutes the calibrating curve (circle). To re-move the driver contribution any frequency measure-ment should be subtracted from the calibrating circle ordinates. Deviations from the 450-slope line represent
the non-Newtonian properties of the uid overlayers. A thin viscoelastic lm in contact with a liquid aects the crystal through its acoustical impedance
Z
A (ratio of shear stress to surface velocity) at the
crystal/lm interface. The corresponding electrical impedance can be calculated by: Z =Z
A =
2, where is
the crystal electromechanical constant [42]. As shown in Ref. [55], the EQCM impedance change is given approximately by the sum of the acoustic impedances
Z
F (lm impedance) and Z
L (liquid layer impedance),
each multiplied by a term representing phase shift and attenuation in the corresponding layer. This holds in the following cases: (i) when jZ
L
j << jZ
F
j, i. e. the
lm rigidity is much higher than that of the solution layer; (ii) when the lm is rigid or (iii) very thin.
The conditions given above were fullled in a recent experiment for monitoring a sol-gel phase change from
aqueous silicates (Si(OH)4) [56]. Two processes were observed in sequence. First occurred the formation of a thin rigid layer (mass: 2 g) and then a gradual
in-crease of R
0 and
X (R= 75 and X = 38 )
indicating a viscoelastic non-Newtonian behavior of the solution adjacent to the silica lm. As the processes observed were not simultaneous, the additivity of the impedances allowed us to identify the contributions of the processes taking place within a forming lm and those in the solution overlayer.
Finally, it is worth mentioning a technique which gives directly the crystal parameter values [57]. It uses a voltage controlled oscillator to sweep the frequency of the current applied to the crystal. By tting the result-ing potential, the parameters are calculated allowresult-ing to make impedance plots of the experiments in real time. This method works as an impedance analyzer. It is a powerful technique but much more expensive than the modied EQCM. It is a recent development and till now not widely used.
V Concluding Remarks
QCM and EQCM have been widely used to investi-gate properties of liquids or lms immersed in liquids. Techniques based on this kind of apparatus have re-vealed to be valuable tools for investigations of prob-lems such as dispersion in colloidal lms, conductive uids, conducting-polymer lms, protein multilayers, phase transitions in liquid crystals, and sol-gel tran-sitions. The key point of the preceding Sections is that caution must be exercised when interpreting the results. Many of the EQCM responses in a variety of situations have yet to be studied and claried. To this purpose an EQCM should be able to measure the two parameters: f
r esand R
0
:
VI Acknowledgments
Financial support provided by FAPESP, CNPq and FAEP/OMEC are acknowledged.
References
[1] J. S. Gordon and D. C. Johnson, J. Electroanal. Chem.
365, 267 (1994).
[3] G. Inselt and J. Bacskai, Electrochim. Acta , 647 (1992).
[4] V. Tsionsky L. Daikhin and E. Gileadi, J. Electrochem. Soc.L233, 142 (1995).
[5] G. Hayward, Anal. Chim. Acta264, 23 (1992).
[6] G. Sauerbrey, Z. Phys.155, 206 (1959).
[7] J. G. Miller and D. I. Bolef, J. Appl. Phys. 39, 5815
(1968).
[8] C. Lu and O. Lewis, J. Appl. Phys.43, 4385 (1972).
[9] C. E. Reed, K. K. Kanazawa and J. H. Kaufman, J. Appl. Phys.68, 1993 (1990).
[10] T. Nomura and A. Minemura, Nippon Kagaku Kaishi
1980, 1621 (1980).
[11] P. L. Konash and G. J. Bastiaans, Anal. Chem. 52,
1929 (1980).
[12] H. E. Hager, Chem. Engin. Commun.43, 25 (1986).
[13] F. Eggers and Th. Funck, J. Phys. E20, 523 (1987).
[14] J. Krim and A. Widom, Phys. Rev. B38, 12184 (1988).
[15] Yong-gui Dong, Guan-ping Feng and Cheng-qun Gui, Sens. Actuat.13-14, 551 (1993).
[16] H. Muramatsu, X. Ye and T. Ataka, J. Electroanal. Chem.347, 247 (1993).
[17] J. S. Graham and D. R. Rosseinsky, J. Chem. Soc. , Faraday Trans.90, 3657 (1994).
[18] S. Bruckenstein, M. Michalski, A. Fensore, Z. Li and A. R. Hillman, Anal. Chem.66, 1847 (1994).
[19] H. Daifuku, T. Kawagoe, N. Yamamoto, T. Ohsaka and N. Oyama, J. Electroanal. Chem.274, 313 (1989).
[20] J. Rickert, A. Brecht and W. Gopel, Anal. Chem.69,
1441 (1997).
[21] Y. Okahata and H. Ebato, Anal. Chem. 61, 2185
(1989).
[22] K. S. Van Dyke, Proc. IRE16,742 (1928).
[23] M. Rodahl, F. Hook, A. Krozer, P. Brzezinski and B.Kasemo, Rev. Sci. Instrum.66, 3924 (1995).
[24] Ref. 18 kanazawa- H. Muramatsu, E. Tamiya and I. Karube, Anal. Chem.60, 2142 (1988).
[25] R. Beck, U. Pitterman and K. G. Weil, Ber. Bunsenges. Phys. Chem.92, 1363 (1988).
[26] C. Barnes, Sens. Actuat.30, 197 (1992).
[27] Z. Lin, C. M. Yip, I. S. Joseph and M. D. Ward, Anal. Chem.65, 1546 (1993).
[28] M. Yang M. Thompson, Anal. Chem.65, 1158 (1993).
[29] Z. Shana and F. Josse, Anal. Chem.66, 1955 (1994).
[30] M. Yang, M. Thompson and W. C. Duncan-Hewitt, Langmuir9, 802 (1993).
[31] T. Okajima, H. Sacurai, N. Oyama, K. Tokuda and T. Oshaka, Electrochim. Acta6, 747 (1993).
[32] D. M. Soares, Meas. Sci. Technol.4, 549 (1993).
[33] J. Wang, M. D. Ward R. C. Ebersole and R. P. Foss, Anal. Chem.65, 2553 (1993).
[34] E. Benes, J. Appl. Phys.56, 608 (1984).
[35] T. Nakamoto and T. Moriizumi, Japan. J. Appl. Phys.
29, 963 (1990).
[36] D. Johannsmann, K. Mathauer, G. Wegner and W. Knoll, Phys. Rev. B46, 7808 (1992).
[37] F. Josse, Z. Shana, C. E. Radtke and D. T. Haworth, IEEE Trans. UFFC37, 359 (1990).
[38] R. Lucklum, C. Behling, R. W. Cernosek and S. J. Martin, J. Appl. Phys. D30, 346 (1997).
[39] H. L. Bandey, A. R. Hillman, M. J. Brown and S. J. Martin, Faraday Discuss.107, 105 (1997).
[40] G. Hayward and M. N. Jackson, IEEE Trans. UFFC
33, 41 (1986).
[41] K. K. Kanazawa, Faraday Discuss. 107, 77 (1997).
[42] D. M. Soares, M. A. Tenan and S. Wasle, Electrochim. Acta 44, 263 (1998).
[43] R. J. Matthys,Crystal Oscillator Circuits, John-Wiley & Sons, New York, 1984.
[44] C. Frubose, K. Doblhofer and D. M. Soares, Ber. Bun-senges. Phys. Chem.97, 475 (1993).
[45] D. M. Soares, C. A. Bertran and G. P. Thim, Proc. 45th Annual Meeting - International Society of Elec-trochemistry, p. VII-116, Porto, Portugal (1994). [46] E. J. Calvo, R. Etchenique, P. N. Bartlett, K. Singhal
and C. Santamaria, Faraday Discuss.107,141 (1997).
[47] D. M. Soares, W. Kautek, C. Frubose and Doblhofer, Ber. Bunsenges. Phys. Chem.98, 219 (1994).
[48] W. Kautek, M. Sahre and D. M. Soares, Ber. Bunsen-ges. Phys. Chem.99, 667 (1995).
[49] J. G. N. Matias, J. F. Juliao, D. M. Soares and A. Gorenstein, J. Electroanal. Chem.431, 163 (1997).
[50] Physical Acoustics - Principles and Methods, edited by W. P. Mason, Vol. I - Part A, Academic Press, New York, 1964.
[51] M. A. Tenan and D. M. Soares, to be published. [52] G. K. Batchelor, An Introduction to Fluid Dynamics,
Cambridge University Press, Cambridge, 1967. [53] D. A. Buttry and M. D. Ward, Chem. Rev. 92, 1355
(1992).
[54] R. Beck, U. Pitterman and K. G. Weil, J. Electrochem. Soc.132, 453 (1992).
[55] V. E. Gransta and S. J. Martin, J. Appl. Phys. 75,
1319 (1994).
[56] P. T. Lima, C. A. Bertran and D. M. Soares, 49th An-nual Meetring - International Society of Electrochem-istry, p. 181, Kytakyushu, Japan (1998).