BioOne sees sustainable scholarly publishing as an inherently collaborative enterprise connecting authors, nonprofit publishers, academic institutions, research libraries, and research funders in the common goal of maximizing access to critical research.
Sampling Plan for
Diaphania
spp. (Lepidoptera: Pyralidae) and
for Hymenopteran Parasitoids on Cucumber
Author(s): Leandro Bacci, Marcelo C. Picanço, Marcelo F. Moura, Terezinha M.
C. Della Lucia, and Altair A. Semeão
Source: Journal of Economic Entomology, 99(6):2177-2184.
Published By: Entomological Society of America
https://doi.org/10.1603/0022-0493-99.6.2177
URL:
http://www.bioone.org/doi/full/10.1603/0022-0493-99.6.2177
BioOne (
www.bioone.org
) is a nonprofit, online aggregation of core research in the
biological, ecological, and environmental sciences. BioOne provides a sustainable online
platform for over 170 journals and books published by nonprofit societies, associations,
museums, institutions, and presses.
Your use of this PDF, the BioOne Web site, and all posted and associated content
indicates your acceptance of BioOne’s Terms of Use, available at
www.bioone.org/page/
terms_of_use
.
Sampling Plan for
Diaphania
spp. (Lepidoptera: Pyralidae) and for
Hymenopteran Parasitoids on Cucumber
LEANDRO BACCI,1
MARCELO C. PICANC¸ O, MARCELO F. MOURA, TEREZINHA M. C. DELLA LUCIA,ANDALTAIR A. SEMEA˜ O
Departamento de Biologia Animal, Universidade Federal de Vic¸osa, 36571-000 Vic¸osa, Minas Gerais State, Brazil
J. Econ. Entomol. 99(6): 2177Ð2184 (2006)
ABSTRACT The objective of this work was to determine the best technique, sampling unit, and the number of samples to compose a conventional sampling plan for the cucurbit borers,Diaphaniaspp. (Lepidoptera: Pyralidae), and for hymenopteran parasitoids on cucumber. This research was carried out in 10 commercial cucumber crops Þelds from July to December 2000 in Tocantins, Minas Gerais State, Brazil (21⬚11⬘15⬙S; 42⬚03⬘45⬙W; altitude 363 m). The sampling methods studied were beating on a tray, direct counting of insects on the lower leaf surface, and whole leaf collection. Three sampling units also were studied: leaves from a branch located in the apical, median, or basal third of the canopy. The best sampling systems, which included the best technique and sampling unit, were determined based on the relative variance and the economic precision of the sampling. Once the best sampling systems were established, the numbers of samples to compose the conventional sampling plans were determined. The more suitable sampling system for the larvae ofDiaphaniaspp. in cucumber plants was beating a leaf of the median third of the canopy on a plastic tray. One leaf must be sampled for every 50 plants in a crop. The more suitable sampling system for hymenopteran parasitoids in cucumber plants was to directly count the adults on one leaf of the median third of the canopy. One leaf must be sampled for every 74 plants in a crop.
KEY WORDS Cucumis sativus, cucurbit borers, natural enemy, decision making
Cucurbit borers,Diaphaniaspp. (Lepidoptera: Pyrali-dae), are considered important pests in the south-western United States, in Central and South America, and in the Caribbean Islands (Smith et al. 1994; Gon-ring et al. 2003a,b). In cucumber crops,Diaphaniaspp. are considered as key pests and may cause up to 100% yield losses of this vegetable (Picanc¸o et al. 2000).
Diaphaniaspecies attack leaves as well as fruits at different intensities.Diaphania hyalinata(L.) prefers leaves, whereas Diaphania nitidalis (Stoll) favors leaves during its three Þrst instars but fruit as older instars (Sorensen and Baker 1983). The attack on leaves decreases productivity because of a reduction of the photosynthetic area of the plant. In addition, the attack on fruit makes it inappropriate for market (So-rensen and Baker 1983).
Hymenopteran parasitoids are important agents of natural biological control of cucurbit borers, para-sitizing their eggs, larvae, and pupae.D. nitidaliseggs are parasitized by Trichogramma pretiosum Riley (Hymenoptera: Trichogrammatidae) and the larvae byApantelessp.,Meteorussp., andHypomicrogastersp. (Hymenoptera: Braconidae) (Gonring et al. 2003b).
D. hyalinataalso is parasitized by the pupal parasitoid
Polycyrtussp. (Hymenoptera: Ichneumonidae)
(Gon-ring et al. 2003a), in addition to the other species. Although natural biological control of these pests is important, their control has been carried out mainly through successive insecticide applications.
Besides the economic damage, excessive use of insecticides also may contaminate water, air, and soil and interfere with the atmosphere and human health. A way of averting this situation is through the adop-tion of integrated pest management (IPM), in which a phytophagous insect is only considered a pest when it causes economical damage. In this system, the densities of the pest and its natural enemies are mon-itored and then compared with decision-making in-dices for pest control decisions (Pedigo 1988, Dent 2000, Picanc¸o et al. 2000).
The sampling of pests and natural enemies can be carried out following a sequential or conventional plan (Sterling et al. 1983). The conventional sampling plan has a Þxed number of samples, uses Þxed proceedings of sampling, and requires more time than the sequen-tial plan. The conventional plan represents the inisequen-tial point of generation of IPM programs for determining essential parameters to decision making, such as the best sampling unit and the sampling method that will be used for determining the economical damage level. In addition, conventional plans are used as patterns for
1Corresponding author, e-mail: [email protected].
validation of sequential plans (Pedigo and Zeiss 1996, Gusma˜o et al. 2005).
The sampling technique that best estimates the in-sect density should consider precision, cost, and sta-tistical distribution of data to make possible a control decision making that is efÞcient and low cost (Pedigo 1988). Among the sampling techniques used to deter-mine the densities of insects in vegetable leaves are beating leaf on white plastic tray (Pedigo 1988, Gus-ma˜o et al. 2005), direct counting of insects (Gusma˜o et al. 2005), and whole leaf collection (Moura et al. 2003). However, the efÞciency of these techniques for sampling ofDiaphania spp. and natural enemies in cucumber crops is not known.
In a sampling plan for Diaphania spp., the pest should be evaluated before it starts boring the fruit, because cucumber plants have low recovery capacity from this injury. Monitoring for adults ofDiaphania
spp. by light and pheromone traps was not found to be efÞcient (Valles et al. 1991). Evaluation of larvae on leaves is one of the ways of generating a plan with these characteristics. The leaves also can be used for sampling hymenopteran parasitoids (Miranda et al. 1998). Thus, the objective of this work was to deter-mine the best technique, sampling unit, and the num-ber of samples to constitute a conventional sampling plan for cucumber borers,Diaphaniaspp., and their hymenopteran parasitoids in cucumber.
Materials and Methods
This work was conducted from July to December 2000 in Tocantins, Minas Gerais State, Brazil (21⬚11⬘15⬙ S; 42⬚03⬘45⬙ W; altitude 363 m), in 10 1.0-ha commercial cucumber crops. The plants were conducted with a stem and spacing of 1.0 by 0.5 m, under local procedures of cultivation, irrigation, fer-tilization, and weed control. Pests and diseases were not controlled. The densities ofDiaphaniaspp. larvae and of adults hymenopteran parasitoids were evalu-ated.
The experimental design was in randomized blocks with 10 replications (plots or plantations) in a factorial scheme 3 by 3 (techniques⫻sampling unit). In each plot, we collected 1,650 samples from 200 plants (nine samples per plant in 150 plants and six samples per plant in 50 plants). On each sample date, 100 plants were evaluated in one plot. A grid pattern was used to collect samples, and the Þrst plant of the southeast-ern quadrant of the Þeld was evaluated. There was a similar distance between sampled plants; 5 m between plants in a row and 5 m between plant rows. Samples were collected from the entire cucumber plantation to avoid bias in the choice of the sampling place.
Technique and Sampling Unit. Three sampling techniques were used: beating the leaf on white plastic tray (BLPT) (35 cm in length by 30 cm in width by 5 cm in depth), direct counting of insects (DC) on the abaxial leaf surface, and whole leaf collection (WLC). The sampling units consisted of taking a leaf from either the apical, median, or basal third of the canopy (Moura et al. 2003). BecauseDiaphaniaspp. larvae as
well as hymenopteran parasitoids occur initially on leaves, leaves were selected for sampling (Miranda et al. 1998).
Beating leaves on a tray consisted of placing a tray under a particular leaf and shaking it rapidly, causing the insects present on the leaf to fall to the tray where they were counted. In the technique of direct count-ing, the leaf was turned carefully so as not to disturb the insects, and insects found on the abaxial surface of the leaf were counted. In the technique of whole leaf collection, the leaf was quickly enclosed by the plastic bag, cut, and the bag was sealed. The bags with the leaves were taken to the laboratory where the live insects were counted. Each sampling method used different plants. Disturbance to surrounding plants also was minimized (Moura et al. 2003).
The time spent for taking each sample and moving from sample to sample was recorded and used to calculate the cost. Average and standard deviation of densities were calculated for each sampling method, and these data were used to calculate the relative variance according to the formula of Pedigo et al. (1982):
RV⫽关100⫻S共X兲兴
X [1]
whereRVis relative variance (%),S(X)⫽standard deviation, and (X)⫽average.
Relative variance measures the variability of sam-pling data. The best methods are those with low values for this characteristic. Data of sampling costs and rel-ative variance (RV) were used to calculate the eco-nomic precision (EP) of sampling methods by using the expression of Kogan and Herzog (1980):
EP⫽ 100
关RV⫻Sc兴 [2]
whereScis sampling cost (US$ per sample). TheScwas calculated through equation
Sci⫽Fci⫹关Mc⫻ti兴 [3] whereSciis the sampling cost for theisampling sys-tem,Fcis the Þxed cost of materials for theisampling system,Mcis the man power cost per second, andtiis the time spent in seconds for the evaluation of a sample in theisampling system added to the average of the time spent in seconds to move from sample to sample (40.97 s). For the WLC technique, the time spent in seconds for the evaluation of a sample in the laboratory was added. Each material had its unit cost calculated, considering the use of durable materials (surveyorÕs table, tray, pencil, and eraser) for one planting period (16 wk) in eight plots. TheMcwas calculated, considering wages paid per hour to one pair of samplers in Brazil (US$6.82). (This amount is equivalent to 5 and 2 times the salary in Brazil [US$155.97] paid for an appraiser and a recorder, respectively.) One dollar is equivalent to 2.244 Reais. The best sampling methods have economic preci-sion with high values.EPwas not calculated for the sampling systems with RV higher than 25%, which
would lead to a low precision of estimates according to Southwood (1978). Values of relative variance, time, cost, and economic precision were subjected to the LillieforsÕ normality test (P ⫽ 0.01) (PROC TESTE-LF; SAEG Software 2001) and analysis of variance (ANOVA) (PROC ANOVAG, SAEG Soft-ware 2001), whereas means of sampling methods were compared by the ScottÐKnott test (P⬍ 0.05) (PROC TESTE-MD, SAEG Software 2001).
Determination of Number of Samples of the Con-ventional Sampling Plan.Once the best sampling sys-tems were established, the numbers of samples to compose the conventional sampling plans were de-termined. Initially the b coefÞcient of the Taylor power law was calculated. This coefÞcient indicates the theoretical frequency distribution to which the data will possibly Þt. If b⬎1, it indicates that the data tend to Þt a negative binomial frequency distribu-tion; b ⫽ 1 indicates that the data Þt a Poisson distribution, and b⬍1 indicates the data Þt a pos-itive binomial distribution (Navas et al. 1994, Doane et al. 2000).
The Taylor power law was obtained by calculating the linear regression between the data of average and variance transformed into natural logarithms, through equation:
Ln S2⫽Lna⫹bLnm [4]
where S2is data variance; a is Taylor coefÞcient, or
sampling factor;bis coefÞcient b of Taylor, or index of aggregation;mis average of the population; and the value of a is the antilogarithm of the intercept and b is the inclination of the straight line.
The estimated results from the theoretical fre-quency distribution models indicated by Taylor power law were tested against the observed frequencies by using a chi-square goodness-of-Þt test (Ludwig and Reynolds 1988). Such procedure was carried out using the ENSTAT software (Pedigo and Zeiss 1996).
Once the adjustment of the sampling data to a the-oretical distribution of frequency forDiaphaniaspp. and hymenopteran parasitoids (negative binomial dis-tribution for both) was obtained, a method to deter-mine the necessary number of samples in the estimate of the populations of these insects was selected, in accordance to the equation of Young and Young (1998):
NA⫽ 1
C2
冉
1
⫹
1
k冊 [5]
where NA is the number of samples, C is level of precision,is population average, andkis parameter of the negative binomial distribution.
For the selection of the level of precision to be used in the sampling plan, thekpartials(kp) of each planta-tion were calculated following the equaplanta-tion
kˆ⫽ x 2
S2⫺x [6]
wherekˆ is parameter of negative binomial distribu-tion,S2is variance of sampling data, andx⫽sample
average.
Thekpartialsdata of each plantation were used to
calculate the numbers of samples, which were sub-mitted to the analysis of regression as a function of the precision levels of 5, 10, 15, 20, and 25% atP⬍
0.05, selecting the level of precision where the num-ber of samples presented less variation (Gusma˜o et al. 2005).
The parameter of common aggregation kcommon
(kc) of the data of the plantation that adjusted to the pattern of negative binomial distribution was deter-mined according to the method of Bliss and Owen (1958).
The ease of use was adopted as the criterion for the selection of the number of samples to be used in the sampling plan. The goal was to use a minimum number of samples without compromising the use of the nec-essary labor to other important practical activities, such as fertilization, irrigation, control of diseases and weeds, staking, and harvesting (Pedigo 1988).
A sampling plan can be considered practicable if the time spent by a pair of samplers (an appraiser and a recorder) in the collection of samples in a plantation is not greater than to 1 h. Thus, considering that it would take one more hour for visiting different plan-tations and for processing of the data, it would be possible for this pair to sample up to four plantations per day (Gusma˜o et al. 2005).
Results
Technique and Sampling Unit.SigniÞcant differ-ences (P⬍0.05) were detected among the sampling systems composed by the sampling technique and the canopy position in the sampled densities of larvae of
Diaphaniaspp. (F⫽4.54, df⫽72,P⫽0.00017) and adult hymenopteran parasitoids (F⫽7.78, df⫽72,P⬍
0.00001). The greater densities ofDiaphaniaspp. were detected by BLPT of the median and basal thirds of the canopy and by WLC of the apical, median, and basal thirds. However, greater densities of hymenopteran parasitoids were detected by DC of insects in the median third of the canopy (Table 1).
SigniÞcant differences (P⬍0.05) were found in the
RVof the samplings ofDiaphaniaspp. (F⫽10.12, df⫽
71,P⬍0.00001) and of hymenopteran parasitoids (F⫽
5.40, df⫽69,P⫽0.00004) as functions of the sampling systems. The sampling systems with relative variances
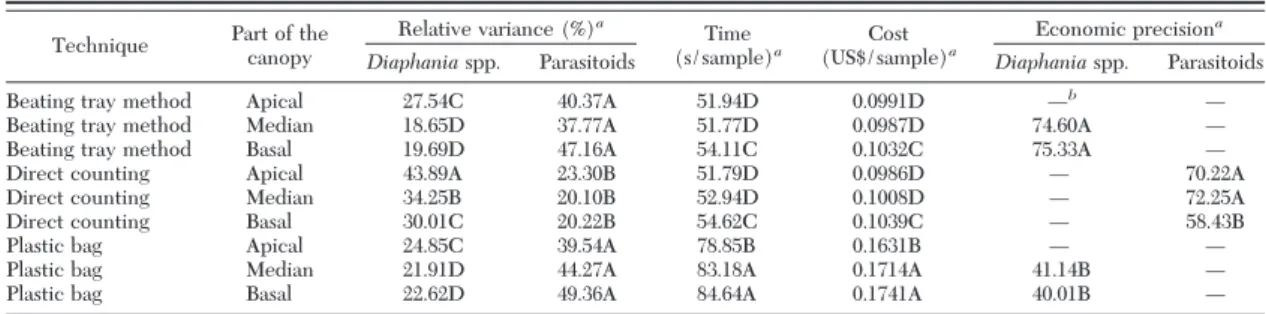
⬍25% (Southwood 1978) forDiaphaniaspp. were as follows: BLPT of the median (RV⫽18.65) and basal thirds (RV⫽19.69) of the canopy and the WLC of the apical (RV⫽24.85), median (RV⫽21.91), and basal (RV⫽22.62) thirds of the canopy. During the sam-pling hymenopteran parasitoids, the lesser relative variances were found in the DC of the apical (RV⫽
23.30), median (RV⫽20.10), and basal thirds (RV⫽
20.22) of the canopy (Table 2).
SigniÞcant effect (P⬍0.05) of the sampling system was veriÞed on the time (F⫽352.27, df⫽529,P⬍
0.00001) of sampling ofDiaphaniaspp. and hymenop-teran parasitoids. The sampling systems with reduced time and cost per sample were BLPT and DC on leaf of apical (51.94 s, US$0.0991; 51.79 s, US$0.0986) and median thirds (51.77 s, US$ 0.0987; 52.94 s, US$ 0.1008) of the canopy (Table 2).
SigniÞcant differences (P⬍0.05) were detected in the sampling systems in the economic precisions (EP) of the samplings ofDiaphaniaspp. (F⫽28.61, df⫽27,
P⬍0.00001) and hymenopteran parasitoids (F⫽4.57, df ⫽ 18, P ⫽ 0.02480). The sampling systems with greater economic precisions for sampling of Diapha-niaspp. were BLPT of the median (EP⫽74.60) and basal (EP⫽75.33) thirds of the canopy. However, in the sampling of hymenopteran parasitoids, the greater economic precisions were found in the DC of the apical (EP⫽70.22) and median (EP⫽72.25) thirds of the canopy (Table 2).
Therefore, based on the economic precision, the best sampling systems forDiaphaniaspp. were BLPT of the median or basal third of the canopy. The most accurate sampling systems for the hymenopteran parasitoids were the DC of the apical or median third of the canopy.
Determination of Number of Samples to Compose the Conventional Sampling Plan.The coefÞcient b of the Taylor power law for sampling ofDiaphaniaspp. by BLPT of the median (b⫽1.21) and basal (b⫽1.15) thirds and for sampling hymenopteran parasitoids by
the DC of the apical (b⫽1.10) and median (b⫽1.16) third were not⬍1 (Fig. 1). This Þnding indicates that the Þeld data tend to adjust to the Poisson distribution (if b⫽1) or negative binomial distribution (if b⬎1) (Taylor 1961).
Densities ofDiaphaniaspp. sampled by BLPT of the median third Þt the negative binomial distribution in Þve of the six plantations tested and Þt the Poisson distribution in only two plantations. The densities of
Diaphaniaspp. sampled by BLPT of basal third also Þt the negative binomial distribution in the six tested plantations, but these data Þt the Poisson distribution in only one plantation (Table 3).
Densities of hymenopteran parasitoids sampled by their DC of the apical and median thirds Þt the neg-ative binomial distribution in the six tested plantations and adjusted to the Poisson distribution in only two plantations (Table 4).
As the sample distribution ofDiaphaniaspp. and their hymenopteran parasitoids Þtted the negative binomial distribution, the number of samples re-quired for the sampling plan was estimated based on this distribution model.
The number of samples needed to estimate Dia-phaniaspp. by BLPT of the median and basal thirds and their hymenopteran parasitoids by DC of the apical and median thirds stabilized at 20% of precision (Fig. 2), which indicated that the practicable number of samples was given by this precision level. Table 1. Densities ofDiaphaniaspp. and their hymenopteran parasitoids (meanⴞSD) as a function of the sampling technique and of the leaf location in the canopy in 10 cucumber crops (Tocantins, Minas Gerais, Brazil)
Technique Third of the
canopy
No. samples
Insects/samplea
Diaphaniaspp. Parasitoids
Beating tray method Apical 2,000 0.484⫾0.019B 0.109⫾0.003C
Beating tray method Median 2,000 0.722⫾0.025A 0.099⫾0.003C
Beating tray method Basal 2,000 0.776⫾0.027A 0.070⫾0.001C
Direct counting Apical 2,000 0.163⫾0.006B 0.411⫾0.010B
Direct counting Median 2,000 0.151⫾0.005B 0.567⫾0.011A
Direct counting Basal 2,000 0.194⫾0.006B 0.345⫾0.005B
Plastic bag Apical 1,500 0.730⫾0.031A 0.178⫾0.006C
Plastic bag Median 1,500 0.855⫾0.029A 0.133⫾0.003C
Plastic bag Basal 1,500 0.925⫾0.032A 0.166⫾0.008C
aValues in each column followed by the same letter do not differ among themselves by the ScottÐKnott test (P⬍0.05).
Table 2. Relative variance, time, cost, and economic precision of samplings ofDiaphaniaspp. (Lepidoptera: Pyralidae) and their hymenopteran parasitoids as function of the sampling technique and the leaf location in the canopy in 10 cucumber crops (Tocantins, Minas Gerais, Brazil)
Technique Part of the canopy
Relative variance (%)a
Time
(s/sample)a (US$/sample)Cost a
Economic precisiona
Diaphaniaspp. Parasitoids Diaphaniaspp. Parasitoids
Beating tray method Apical 27.54C 40.37A 51.94D 0.0991D Ñb Ñ
Beating tray method Median 18.65D 37.77A 51.77D 0.0987D 74.60A Ñ
Beating tray method Basal 19.69D 47.16A 54.11C 0.1032C 75.33A Ñ
Direct counting Apical 43.89A 23.30B 51.79D 0.0986D Ñ 70.22A
Direct counting Median 34.25B 20.10B 52.94D 0.1008D Ñ 72.25A
Direct counting Basal 30.01C 20.22B 54.62C 0.1039C Ñ 58.43B
Plastic bag Apical 24.85C 39.54A 78.85B 0.1631B Ñ Ñ
Plastic bag Median 21.91D 44.27A 83.18A 0.1714A 41.14B Ñ
Plastic bag Basal 22.62D 49.36A 84.64A 0.1741A 40.01B Ñ
aValues in each column followed by the same letter do not differ between themselves by the ScottÐKnott test (P⬍0.05). bThese values were not determined because their relative variance was higher than 25%.
The two most accurate systems for the sampling of
Diaphaniaspp. (BLPT of the median and basal thirds) had common aggregation parameters (kcommon) of
1.5969 and 1.9670, respectively (P⬍0.05). The same occurred with hymenopteran parasitoids by DC of the apical (kcommon ⫽ 1.5890) and median (kcommon ⫽
0.8335) thirds (Table 5).
The numbers of necessary samples for sampling
Diaphaniaspp. by BLPT of the median and basal thirds of the canopy were of 50 and 44 samples per planta-tion; time spent was 43.14 and 39.41 min per sampling, with a cost of US$ 4.94 and 4.51 per sampling, respec-tively. The necessary number of samples for sam-pling of adults hymenopteran parasitoids by DC of the apical and median thirds of the canopy were 77 and 74 samples per plantation, with times of 66.46 and 65.29 min per sampling and a cost of US$17.03 and 16.73 per sampling, respectively (Table 5).
Discussion
Technique and Sampling Unit.The observation of greater densities ofDiaphaniaspp. by BLPT of the
median and basal thirds and by WLC of the apical, median, and basal thirds occurred possibly because these techniques allow better visualization of the Þrst, second, and third instars. The green color of the larvae contrasts with the white color of the tray. Better vi-sualization of the green larvae in leaves was provided by the evaluation of leaves under artiÞcial light in laboratory obtained by the technique of WLC than by direct counting of the larvae in the Þeld.
The observation of greater densities of larvae of
Diaphania spp. on leaves of the median and basal
Fig. 1. Natural logarithm of the variance (Ln S2) as
func-tion of natural logarithm of the average numbers (Ln X) of larvae ofDiaphaniaspp. by beating leaf of cucumber of the median (1A) and basal (1B) third of the canopy and adult hymenopteran parasitoids by direct counting on leaf of the apical (1C) and median (1D) third of the canopy on leaves of cucumber plants. Tocantins, Minas Gerais, Brazil.
Table 3. Chi-square test (2) between observed and expected frequencies by Poisson and negative binomial distributions of the densities ofDiaphaniaspp. sampled by beating leaf of cucumber in the apical and basal thirds of the canopy (Tocantins, Minas Gerais, Brazil)
Plantationa
Tray in the median third
Tray in the basal third
2 df 2 df
Poisson distribution
1 12.43* 2 18.25* 2
2 14.25* 2 21.44* 2
3 1.85NS 1 5.36NS 2
4 170.89* 7 157.51* 7
5 27.41* 2 14.11* 1
6 3.16NS 1 3.86* 1
Negative binomial distribution
1 5.54NS 3 2.17NS 4
2 0.32NS 3 2.47ns 3
3 10.44* 1 1.52NS 1
4 14.88NS 14 13.64NS 13
5 5.43NS 5 3.65NS 4
6 1.13NS 1 0.07NS 1
*SigniÞcant at 5% probability; NS, nonsigniÞcant at 5% probability.
aIt was not possible to determine the statistical distributions of the
data from plantations 7 to10 because the number of degrees of free-dom provided by analyzing these data was zero.
Table 4. Chi-square test (2) between observed and expected frequencies by Poisson and negative binomial distributions of the densities of hymenopteran parasitoids sampled by direct counting on leaf of cucumber in the apical and median thirds of the canopy (Tocantins, Minas Gerais, Brazil)
Plantationa
Direct counting on the apical
third
Direct counting in the median
third
2 df 2 df
Poisson distribution
1 7.62* 1 62.13* 2
2 4.28* 1 1.33NS 1
3 26.46* 3 33.09* 3
4 5.61* 1 5.99* 1
6 0.85NS 1 8.14* 2
9 0.33NS 1 4.51NS 2
Negative binomial distribution
1 3.14NS 3 10.55NS 6
2 0.19NS 1 2.51NS 2
3 1.65NS 6 7.35NS 7
4 2.84NS 1 1.68NS 2
6 0.14NS 1 0.28NS 2
9 3.01NS 2 3.80NS 3
*SigniÞcant at 5% probability; NS, nonsigniÞcant at 5% probability.
aIt was not possible to determine the statistical distributions of the
thirds of the canopy was possibly because these leaves possess greater area, besides being older, and there-fore they were exposed longer to the insects. More-over, the median and basal leaves are closer to the fruit, facilitating the dispersal of the larvae (third in-stars) to the fruit (Sorensen and Baker 1983). Mor-phological and chemical characteristics such as higher density of nonglandular trichomes and glandular trichomes associated with leaves of the apical third of the canopy also may inßuence the lower level of at-tack. Nonglandular trichomes exert mechanical
inßu-ence on the oviposition, and glandular trichomes exert their effect through chemical substances (Antoˆnio et al. 2002).
The greatest densities of hymenopteran parasitoids were observed when the technique of DC of the median third of the canopy was used, perhaps be-cause of the high ßight dispersion of the hymenop-teran parasitoids caused by manipulation when beat-ing a leaf on the tray or by collectbeat-ing it. In addition, WLC caused the death of insects, which adhered to the plastic bag in condensed water caused by leaf transpiration. These insects were not counted.
The lower relative variances found in sampling
Diaphania spp. by BLPT of the median and basal thirds of the canopy and by WLC of the three thirds of the canopy were because of the high densities of larvae in these samplings (relative variance is in-versely proportional to the densities) (Pedigo 1988). The same relationship occurred with the hymenop-teran parasitoids, which showed the lowest relative variances in the systems with greater densities.
The fastest samplings had lower costs because they used less labor, the main component of the sam-pling cost (97%). BLPT and DC of insects needed less time than WLC forDiaphaniaspp. and hymenopteran parasitoid sampling because more operations (e.g., sacking, leaf collection, fastening of plastic bag, leaf removal from the plastic bag, and evaluation) were necessary in the leaf-collecting system than in the other systems. The sampling systems of BLPT and DC in the basal third of the canopy were more time-consuming than in the other two thirds, because for sampling in the basal third, the sampler had to bend down to evaluate the plants.
The most suitable systems for samplingDiaphania
spp. were BLPT of the median or basal third of the canopy, because these systems combined high preci-sion, rapidity, and low cost. Although the systems that had used plastic bags had less relative variances, they had not been adjusted to the sampling ofDiaphania
spp., because they were slow and had high cost. The more suitable systems for sampling hymenop-teran parasitoids were the DC of the apical or median third of the canopy, because they combined high pre-cision, rapidity, and low cost.
Determination of Number of Samples to Compose the Conventional Sampling Plan.The adjustment of the selected data of the systems for sampling
Diapha-Fig. 2. Number of samples to compose the sampling system as function of the precision level of the sampling of
Diaphaniaspp. by beating leaf of cucumber of the median (2A) and basal (2B) third of the canopy and hymenopteran parasitoids by direct counting on leaf of the apical (2C) and median (2D) third of the canopy on leaves of cucumber plants. Tocantins, Minas Gerais, Brazil. Data are mean⫾SD.
Table 5. Residual degrees of freedom, F-test,kcommon, number of samples, time (minutes per sampling), and cost (US$ per sampling)
of the sampling system ofDiaphaniaspp. and of hymenopteran parasitoids on cucumber crop (Tocantins, Minas Gerais, Brazil)
Sampling system Residual
df
F
kcommon
No. samples
Time (min)
Cost (US$) Inclination Intercept
Diaphaniaspp.
Tray in the median third 6 9.22* 0.081NS 1.5969 50 43.14 4.94
Tray in the basal third 6 16.09* 0.082NS 1.9670 44 39.41 4.51
Hymenopteran parasitoids
Direct counting on the apical third 7 22.69* 0.020NS 1.5890 77 66.46 17.03
Direct counting on the median third 7 6.55* 0.001NS 0.8335 74 65.29 16.73
*SigniÞcant at 5% probability; NS, nonsigniÞcant at 5% probability.
niaspp. and hymenopteran parasitoids to the negative binomial distribution, in many of the plantations is because of the high frequency of samples with ex-treme densities (low or high). This results in obtaining variances greater than the average; the larger the quo-tient between variance and average, the higher are the values of parameter kof the negative binomial distribution (Taylor 1984). This relationship also was observed in the present work. Negative binomial dis-tributions were observed in the sampling of other lepidopterans, such as Spodoptera frugiperda (J.E. Smith) (Noctuidae) (Mitchell and Fuxa 1987), Pseu-daletia unipuncta (Stoetzel) (Noctuidae) (Coggin and Dively 1982), andLeucoptera coffeella (Lyoneti-idae) (Vilacorta and Tornero 1982).
Young and Young (1998) mentioned that different populations present distinct values of the parameterk
of the negative binomial distribution, thus resulting in different numbers of samples for each population. However, the selected systems for the economic pre-cisionskcommon included variances that occurred in
the populations of the different plantations. This makes possible the determination of a sampling strat-egy that is adjusted to many plantations. The objective was reached in this work; it was possible to Þnd a
kcommonfor the more adequate sampling systems for
Diaphaniaspp. and their hymenopteran parasitoids. The sampling plans forDiaphaniaspp. and hyme-nopteran parasitoids can be considered useful accord-ing to the criteria described by Pedigo (1988), because these plans allow the collection, processing of the data (1.53 and 2.16 min) and control decision making in 1 d, besides being of low cost. Therefore, the adoption of such sampling plans in the culture of the cucumber might bring great beneÞts to the vegetable growers in reducing cost of control, preserving agroecosystems, and protecting human health.
Acknowledgments
This study was Þnanced by the Conselho Nacional de Desenvolvimento Cientõ´Þco e Tecnolo´gico and Fundaça˜o de Amparo a`Pesquisa do Estado de Minas Gerais.
References Cited
Antoˆnio, A. C., M. C. Picanc¸o, A.H.R. Gonring, A. A. Semea˜o, L. M. Gontijo, and L. G. Sobrinho. 2002.Oviposic¸a˜o de
Diaphania hyalinataL. (Lepidoptera: Pyralidae) afetada pela face foliar e tricomas. Acta Sci. 24: 359 Ð362.
Bliss, C. L., and A.R.G. Owens. 1958. Negative binomial distributions with a common k. Biometrika 45: 37Ð58.
Coggin, D. L., and G. P. Dively. 1982. Sequential sampling plan for the armyworm in Maryland small grains. Environ. Entomol. 11: 169 Ð172.
Dent, D. 2000. Insect pest management, 2nd ed. CAB Pub-lishing, Wallingford, United Kingdom.
Doane, J. F., M. K. Mukerji, and O. Olfert. 2000. Sampling distribution and sequential sampling for subterranean stages of orange wheat blossom midge,Sitodiplosis mosel-lana(Ge´hin) (Diptera: Cecidomyidae) in spring wheat. Crop Prot. 19: 427Ð 434.
Gonring, A.H.R., M. C. Picanc¸o, R.N.C. Guedes, and E. M. Silva. 2003a. Natural biological control and key
mortality factors ofDiaphania hyalinataL. (Lepidoptera: Pyralidae) in cucumber. Biocontrol Sci. Technol. 13: 361Ð 366.
Gonring, A.H.R., M. C. Picanc¸o, J. C. Zanuncio, and A. A. Semea˜o. 2003b.Natural biological control and key mortality factors of the pickleworm,Diaphania nitidalis
Stoll (Lepidoptera: Pyralidae), in cucumber. Biol. Agric. Hortic. 20: 365Ð380.
Gusma˜o, M. R., M. C. Picanc¸o, J. C. Zanuncio, D.J.H. Silva, and J.A.F. Barrigossi. 2005. Standardised sampling plan forBemisia tabaci(Homoptera: Aleyrodidae) in outdoor tomatoes. Sci. Hortic. 103: 403Ð 412.
Kogan, M., and D. C. Herzog. 1980. Sampling methods in soybean entomology. Springer, New York.
Ludwig, J. A., and J. F. Reynolds. 1988.Statistical ecology: a primer on methods and computing. Wiley, New York.
Miranda, M.M.M., M. Picanc¸o, J. C. Zanuncio, and R.N.C. Guedes. 1998. Sampling and non-action levels for predators and parasitoids of virus vectors and leaf miners of tomato in Brazil. Med. Fac. Landbouww. Univ. Gent. 63: 519 Ð523.
Mitchell, F. L., and J. R. Fuxa. 1987. Distribution, abun-dance, and sampling of fall armyworm (Lepidoptera: Noctuidae) in south-central Louisiana corn Þelds. Envi-ron. Entomol. 16: 453Ð 458.
Moura, M. F., M. C. Picanc¸o, E. M. Silva, R.N.C. Guedes, and J. L. Pereira. 2003. Plano de amostragem do bio´tipo B de
Bemisia tabacina cultura do pepino. Pesqu. Agropecu. Bras. 38: 1Ð7.
Navas, V.E.S., J. E. Funderburd, T. P. Mack, R. J. Beshear, and S. M. Olson. 1994. Aggregation indices and sample size curves for binomial sampling of ßower-inhabiting Frank-liniella species (Thysanoptera: Thripidae) on tomato. J. Econ. Entomol. 87: 1622Ð1626.
Pedigo, L. P. 1988.Entomology and pest management. Mac-millan, New York.
Pedigo, L. P., G. D. Butin, and E. J. Bechinski. 1982. Flush-ing technique and sequential-count plan for green clo-verworm (Lepidoptera: Noctuidae) months in soybeans. Environ. Entomol. 11: 1223Ð1228.
Pedigo, L. P., and M. R. Zeiss. 1996. Analyses in insect ecol-ogy and management. Iowa State University Press, Ames, IA.
Picanc¸o, M. C., M. R. Gusma˜o, and T. L. Galvan. 2000.
Manejo integrado de pragas de hortalic¸as, pp. 275Ð324.In
L. Zambolim [ed.], Manejo integrado de doenc¸as, pragas e ervas daninhas. Suprema, Vic¸osa, Minas Gerais, Brasil.
SAEG Software. 2001. SAEG Ana´lises estatõ´sticas no SAEG. Guia do usua´rio, versa˜o 8. UFV, Vic¸osa, Brazil.
Smith, H. A., J. L. Capineira, J. E. Pen˜a, and B. Limbo-Terhaar. 1994. Parasitism of pickleworm and melon-worm (Lepidoptera: Pyralidae) by Cardiochiles di-aphaniae(Hymenoptera: Braconidae). Biol. Control 23: 1283Ð1293.
Sorensen, K. A., and J. R. Baker. 1983. Insect and related pests of vegetables, some important, common, and po-tential pest in the southeastern United States, Report AG-295. The North Carolina Agricultural Extension Ser-vice, University of North Carolina, Raleigh, NC.
Southwood, T.R.E. 1978. Ecological methods, with particu-lar reference to the study of insect populations, 2nd ed. Chapman & Hall, London, United Kingdom.
Sterling, W. L., E. Bleicher, and F.M.M. Jesus. 1983. Um programa de manejo integrado para Insects do algodoeiro no nordeste do Brasil usando amostragem sequ¨encial. An. Soc. Entomol. Bras. 12: 85Ð98.
Taylor, L. R. 1984. Assessing and interpreting the spatial distribution of insects populations. Annu. Rev. Entomol. 29: 231Ð257.
Valles, S. M., J. L. Capinera, and P.E.A. Teal. 1991. Evalu-ation of pheromone trap design, height, and efÞciency for capture of maleDiaphania nitidalis.(Lepidoptera: Pyralidae) in a Þeld cage. Environ. Entomol. 20: 1274 Ð 1278.
Vilacorta, A., and M.T.T. Tornero. 1982. Plano de amostra-gem sequ¨encial de dano causado porPerileucoptera cof-feellano Parana´. Pesqu. Agropecu. Bras. 17: 1249 Ð1260.
Young, L. J., and J. H. Young. 1998. Statistical ecology: a population perspective. Kluwer Academic Publishers, Boston, MA.
Received 30 May 2006; accepted 20 July 2006.