Working Paper CEsA CSG 172/2018
GROWTH AND
DEBT IN
ANGOLA AT
PROVINCIAL
LEVEL
César Fernando REIS
Jelson SERAFIM
Abstract
This paper analyses GDP growth and public debt at the provincial level in Angola from 2004-2015, using a spatial model. First a SAC -Spatial autocorrelation model panel is estimated. Later, a robust test is adopted estimating the Hans-Philips linear spatial dynamic model. Finally, a spatial 3sls model is estimated taking into account the possibility endogeneity of regional spatial autocorrelation. The three models give similar results revealing that in Angola public expenditure increase GDP growth but debt decrease it.
WORKING PAPER
CEsA neither confirms nor informs any opinions expressed by the authors in this document.
CEsAis a research Centre that belongs to CSG/Research in Social Sciences and Management that is hosted by the Lisbon School of Economics and Management of the University of Lisbon an institution dedicated to teaching and research founded in 1911. In 2015, CSG was object of the international evaluation process of R&D units carried out by the Portuguese national funding agency for science, research and technology (FCT - Foundation for Science and Technology) having been ranked as “Excellent”.
Founded in 1983, it is a private institution without lucrative purposes, whose research team is composed of ISEG faculty, full time research fellows and faculty from other higher education institutions. It is dedicated to the study of economic, social and cultural development in developing countries in Africa, Asia and Latin America, although it places particular emphasis on the study of African Portuguese-speaking countries, China and Pacific Asia, as well as Brazil and other Mercosur countries. Additionally, CEsA also promotes research on any other theoretical or applied topic in development studies, including globalization and economic integration, in other regions generally or across several regions.
From a methodological point of view, CEsA has always sought to foster a multidisciplinary approach to the phenomenon of development, and a permanent interconnection between the theoretical and applied aspects of research. Besides, the centre pays particular attention to the organization and expansion of research supporting bibliographic resources, the acquisition of databases and publication exchange with other research centres.
AUTHORS
César Fernando ReisFaculdade de Economia Universidade Mandume Ya Ndemufayo, Rua Dr. António Agostinho Neto nº 86, C.P. 201, Lubango, Angola, Tel: +244923518837.
Email: nandoreis33@yahoo.com.br
Jelson Serafim
Faculdade de Economia Universidade Mandume Ya Ndemufayo, Rua Dr. António Agostinho Neto nº 86, C.P. 201, Lubango, Angola, Tel: +244926069288.
CONTENTS
INTRODUCTION ... 4
1. THE CONTEXTUAL SETTING ... 5
2. THE LITERATURE SURVEY ... 8
3. METHODOLOGY ... 10
4. THEORETICAL BACKGROUND AND HYPOTHESES ... 11
5. DATA AND RESULTS ... 12
6. DISCUSSION AND CONCLUSION ... 15
INTRODUCTION
The relationship between growth and debt has attracted some research in past, (Eberhardt and Presbitero, 2015, Panizza and Presbitero, 2014, Kourtellos et al., 2013; Checherita-Westphal and Rother, 2012). This hypothesis has been tested for development countries and evidence from Africa countries restricted (Mistry, 1991; Ussain and Gunter, 2005; Mohamed, 2013; Owusu-Nantwi and Erickson, 2016). Reinhart and Rogoff (2010) find that growth rates fall in advanced and emerging market economies when the public debt-to-GDP ratio exceeds 90 percent and that high debt levels are correlated with higher inflation only in emerging markets. The Weak Government Hypothesis states that government fragmentation leads to higher public deficits and debt. This relation can be explained by government inaction, common pool problems or the strategic use of debt that arise in coalition governments (Ashworth, Geys and Heyndels, 2005). Therefore, this paper analyzes the relationship between debt and growth in Angola provinces from 2004-2015, using a spatial model. The spatial model is adequate in the present context as the focus are at regional level (Zhao, Tong and Qiao, 2002; chakravorty, 2003; Haddad, 2008; Barros, Faria and Araujo Jr., 2014) The SAC- Spatial autocorrelation model is adequate when the spatial autocorrelation is intense as it is in Angola context. The motivation for the present research is the following, first, growth at regional level is usually lower than at national level, revealing heterogeneity among Angola provinces that justifies the investigation between growth and debt. Second, regional public expenditure is taken into account since it is a component of the growth and debt. Third, regional public debt is not published in Angola and the access to it needs a ministry of finance accordance. This restricted access signifies that it is a political issue and therefore it may hide some political issues. Therefore, the use of it in and growth debt paper is curious. Additional, the Angola regional provinces are managed by MPLA- Movimento popular de Libertação de Angola members, the incumbent government, signifying that there is a centrality of power that increases the regional spatial correlation. Finally, a robust test is implemented
estimating two alternative models and investigating if the results do not change with the estimated model.
This paper is organized as follows. After this introduction, the contextual setting is described, followed by the literature survey. Then the methodology is presented followed by the theoretical background. Finally, the data and results are presented followed by the conclusion and discussion section.
1. THE CONTEXTUAL SETTING
The territory of the Republic of Angola is situated on the west coast of southern Africa, south of the equator, between the Parallels 4 and 18, being limited to North By Congo Brazzaville and Democratic Republic of Congo, East and For Zambia South Namibia and west hair Atlantic Ocean, still covering the Cabinda Province, located to the north, between the Congo- Brazzaville and the Democratic Republic of Congo. Angola was a formerly Portuguese colonial country that turn independent in 1975. Since then the country developed. The estimated population in 2014 was 24,498,000 inhabitants and an administrative political division comprises 18 provinces with 173 municipalities. From the physical point of view, two main features may characterize the Angolan economy, namely oil and diamonds. Furthermore, the greatness of resources offered by nature and extraordinary variety of conditions and possibilities. In fact, the extent of the territory is associated with enormous energy potential waterborne, a basement that although incompletely inventoried, already reveals realities and significant potential for economic exploitation, abundant fishery resources in nearby waters, favorable proportion of land with agricultural potential, the extraordinary variety of climates, soils, areas and regions susceptible to economic exploitation.
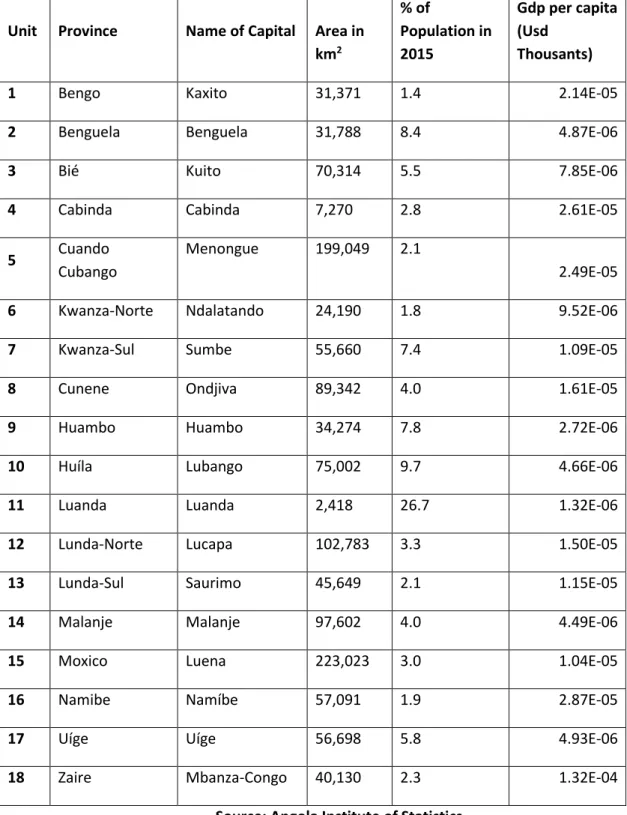
Table 1: Spatial Characteristics of Angola Provinces in 2015
Unit Province Name of Capital Area in km2 % of Population in 2015 Gdp per capita (Usd Thousants)
1 Bengo Kaxito 31,371 1.4 2.14E-05
2 Benguela Benguela 31,788 8.4 4.87E-06
3 Bié Kuito 70,314 5.5 7.85E-06
4 Cabinda Cabinda 7,270 2.8 2.61E-05
5 Cuando
Cubango
Menongue 199,049 2.1
2.49E-05
6 Kwanza-Norte Ndalatando 24,190 1.8 9.52E-06
7 Kwanza-Sul Sumbe 55,660 7.4 1.09E-05
8 Cunene Ondjiva 89,342 4.0 1.61E-05
9 Huambo Huambo 34,274 7.8 2.72E-06
10 Huíla Lubango 75,002 9.7 4.66E-06
11 Luanda Luanda 2,418 26.7 1.32E-06
12 Lunda-Norte Lucapa 102,783 3.3 1.50E-05
13 Lunda-Sul Saurimo 45,649 2.1 1.15E-05
14 Malanje Malanje 97,602 4.0 4.49E-06
15 Moxico Luena 223,023 3.0 1.04E-05
16 Namibe Namíbe 57,091 1.9 2.87E-05
17 Uíge Uíge 56,698 5.8 4.93E-06
18 Zaire Mbanza-Congo 40,130 2.3 1.32E-04
Luanda is the great Angolan city capital, exerting a polarizer devastating effect on the entire national territory and representing an inter- ethnic mosaic and unique cross-cultural in the country. The northern region, considering the provinces of Cabinda and Zaire, explores the current largest natural resource of the country and it is populated by a main ethnic groups (Bakongo ethic group in Zaire). The Central / Eastern region has the producing provinces of diamonds and electricity - two essential resources for their development and the country. The Central / West region can be considered as the great land reserve and the country's fisheries, it presents a huge and recognized potential for the deployment of a very strong agro-industrial sector to meet the needs of the domestic market and export. It can be seen as inter-ethnic area par excellence, since in her breast cohabit, at least eight of all existing ethnic groups in Angola. Finally, the South composed of only two provinces with similar capabilities and skills, but which highlights the Huila which has a great potential in Agriculture and cattle raising.
The Angolan economy has been recently hit hard by the sharp decline in international oil prices and the temporary reduction of production due to permanent lack of planning maintenance of oil fields and a prolonged drought. However, strong macroeconomic policies have helped to ensure an economic growth rate at national level of 4.5 % in 2014, down from 6.8 % recorded in 2013. During 2015/16, Angola continued to suffer the significant effects of lower oil prices. It is expected that the decline in oil prices lead to significant cuts in public spending with consequent slowdown of the GDP growth rate to 3.8% in 2015. However, it is expected that growth will pick up to 4.2 % in 2016.
Regarding Public debt, although public debt of Angola and external debt are growing, they remain sustainable with a low risk of debt. However, we anticipate a rise in the external debt level at national level (25% of GDP) and domestic debt (11.6 % of GDP) due to the need for larger loans to cover budget deficits set in the medium term. In this context, it is expected that the total public debt will reach 35.5 % in 2015 and to rise to 40.3 % in 2016. According to the latest available version of the Bulletin of the Public Debt of the Ministry of Finance, multilateral debt and bilateral represents about 62 % of the external debt, and commercial sources represent just fewer than 30%.
2. THE LITERATURE SURVEY
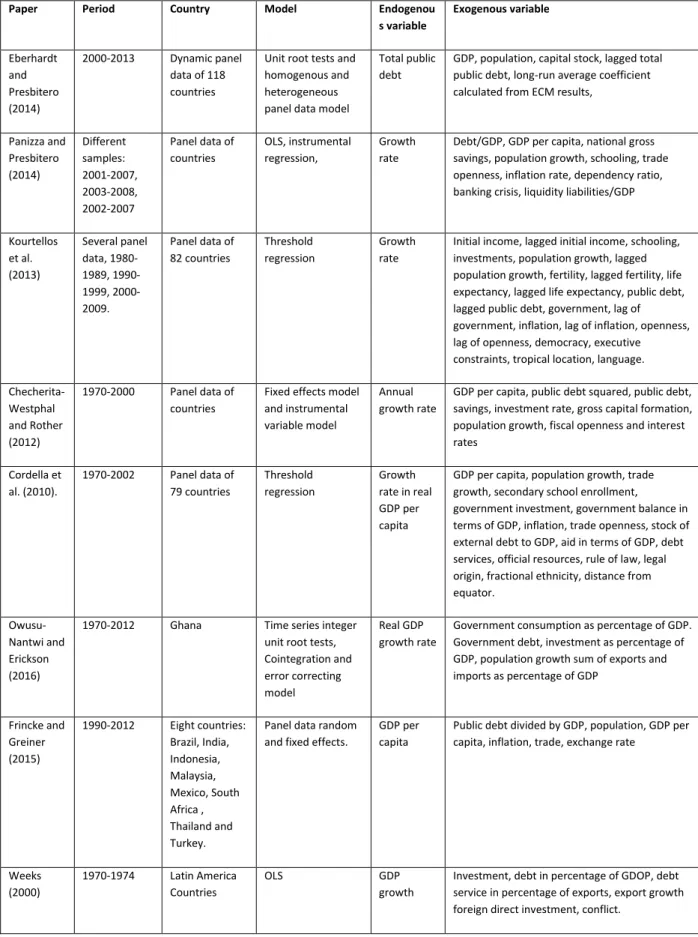
The literature about the debt-growth nexus focuses on several issues. Firstly, the negative relationship between growth and debt identified by the elder literature (Modigliani, 1961; Diamond, 1965; Blanchard, 1985). This result is supported by the fact that the debt has to be paid off either through future reductions in public spending or through distortionary taxation, with inevitable negative effects on growth. Therefore, in the long run, the effect of debt on growth is negative. The second question is whether the long-run relationship between growth and debt is the same in each country, or whether there are significant differences in the debt–growth nexus across countries (Temple, 1999). The conclusion is supported by different production characteristics makes this relationship specific to each country. The third issue is whether the relationship between debt and growth is a non-linear or a threshold relationship. This modeling element encourages the adoption of non-linear panel data models (Eberhardt and Presbitero, 2015) and threshold models (Kumar and Woo, 2010; Checherita-Westphal and Greenlaw et al., 2013). Recent publications on this topic include Eberhardt and Presbitero (2015), Panizza and Presbitero (2014), Kourtellos et al. (2013), Checherita-Westphal and Rother (2012) and Cordella et al. (2010).
Table 2: Literature survey models and variables.
Paper Period Country Model Endogenou s variable Exogenous variable Eberhardt and Presbitero (2014) 2000-2013 Dynamic panel data of 118 countries
Unit root tests and homogenous and heterogeneous panel data model
Total public debt
GDP, population, capital stock, lagged total public debt, long-run average coefficient calculated from ECM results,
Panizza and Presbitero (2014) Different samples: 2001-2007, 2003-2008, 2002-2007 Panel data of countries OLS, instrumental regression, Growth rate
Debt/GDP, GDP per capita, national gross savings, population growth, schooling, trade openness, inflation rate, dependency ratio, banking crisis, liquidity liabilities/GDP
Kourtellos et al. (2013) Several panel data, 1980-1989, 1990-1999, 2000-2009. Panel data of 82 countries Threshold regression Growth rate
Initial income, lagged initial income, schooling, investments, population growth, lagged population growth, fertility, lagged fertility, life expectancy, lagged life expectancy, public debt, lagged public debt, government, lag of government, inflation, lag of inflation, openness, lag of openness, democracy, executive constraints, tropical location, language. Checherita-Westphal and Rother (2012) 1970-2000 Panel data of countries
Fixed effects model and instrumental variable model
Annual growth rate
GDP per capita, public debt squared, public debt, savings, investment rate, gross capital formation, population growth, fiscal openness and interest rates Cordella et al. (2010). 1970-2002 Panel data of 79 countries Threshold regression Growth rate in real GDP per capita
GDP per capita, population growth, trade growth, secondary school enrollment, government investment, government balance in terms of GDP, inflation, trade openness, stock of external debt to GDP, aid in terms of GDP, debt services, official resources, rule of law, legal origin, fractional ethnicity, distance from equator.
Owusu-Nantwi and Erickson (2016)
1970-2012 Ghana Time series integer
unit root tests, Cointegration and error correcting model
Real GDP growth rate
Government consumption as percentage of GDP. Government debt, investment as percentage of GDP, population growth sum of exports and imports as percentage of GDP Frincke and Greiner (2015) 1990-2012 Eight countries: Brazil, India, Indonesia, Malaysia, Mexico, South Africa , Thailand and Turkey.
Panel data random and fixed effects.
GDP per capita
Public debt divided by GDP, population, GDP per capita, inflation, trade, exchange rate
Weeks (2000) 1970-1974 Latin America Countries OLS GDP growth
Investment, debt in percentage of GDOP, debt service in percentage of exports, export growth foreign direct investment, conflict.
From this revision it is verified that the endogenous variable is GDP growth is the main endogenous variable, and some papers the GDP. The exogenous variables include debt and public expenditure and GDP per capita.
3. METHODOLOGY
The spatial regression model displayed below relates to the migration variable, with covariates explaining internal migration, based on the literature survey and taking into account the spatial dependence between the observation locations (Anselin, 1988). Therefore, in spatial models, the observations from one location tend to have similar values to those of nearby locations (LeSage, 2005). This paper adopts the panel data SAC panel – spatial autoregressive model, which has the following specification:
(1) 𝑌𝑡= 𝜌𝑊𝑌𝑡+ 𝑥𝑡𝛽 + 𝑢𝑖+ 𝑣𝑡
(2) 𝑉 = 𝜆𝑀𝑣𝑡+ 𝜀𝑡
This model combines the spatial model SAR - Spatial auto-regression model, proposed by Anselin (1988) with the spatial effect in the error term that is a (spillover effect) between the Angola provinces. The model used is a linear regression, with Y being the endogenous variable for measuring GDP growth at location I, in year t, and X is the vector of covariates. W is a spatial-weighting matrix which parameterizes the distance between neighborhood regions. W is the spatial lag of the error term, and Μ is the spatial lag of the covariates (Barros, Farias and Araujo Jr., 2012; Barros, Santos and Wake, 2016). Based on previous research (Barros, 2014), the random effects and fixed effects models are estimated, and a Hausman test selects the best fit. The random effects model signifies that all provinces are similar and homogenous. The fixed effects model signifies that there are specificities in Angola provinces. Furthermore, as a robust test, an endogenous effect Hans-Philips linear spatial dynamic model allowing for
𝑌𝑖𝑡 = 𝜌𝑌𝑖𝑡 + 𝑥𝑖𝑡𝛽 + 𝜆𝑊𝑦𝑖𝑡+ 𝑣𝑖𝑡
4. THEORETICAL BACKGROUND AND HYPOTHESES
The theoretical background of this paper is based on the macroeconomic theory that relates GDP growth to debt. This theory is well-established and states that debt has to be paid off through future reductions in public spending or through distortionary taxation, with negative effects on growth. Therefore, although some initial growth may be observed, it ends up being compensated by taxes in order to fund the increased expenditure (Blanchard, 1985).
Hypothesis 1: (Persistence). GDP growth is a persistent activity in developing
countries (Panizza and Presbitero, 2014T). Hypothesis 1 states that the GDP lagged effect is positive, which means that a positive spatial autocorrelation exists when high values are correlated with high neighbouring values, based on the neighbour’s spatial position, and over time, Kourtellos et al. (2013).
Hypothesis 2: (Trend). GDP growth over time should increase in an economy
dynamic. Hypothesis 2 states that the trend is for an increasing number of GDP over the period.
Hypothesis 3: (Squared Trend). GDP growth over time should increase at a
decrease rate in an economy dynamic. Hypothesis 3 states that the square trend is for a decreasing effect on GDP over the period.
Hypothesis 4: (Population). Population affect the GDP growth in any area.
Hypothesis 4 states that population positively affects Angola’s GDP, Eberhardt and Presbitero (2014).
Hypothesis 5: (Public expenditure). Public expenditure affects the GDP growth
positively because the higher the public expenditure the higher GDP, Cordella et al. (2010). T t N i Mu c vit i it it, 1,..., ; 1,...,
Hypothesis 6: (Public debt). Public debt affects the GDP growth negatively
because the higher the public debt the higher taxes to pay it, Panizza and Presbitero (2014).
Hypothesis 7: (GDP per capita). GDP per capita affect the GDP growth positively
because the higher the higher the old GDP per capita the higher the new GDP, Checherita-Westphal and Rother (2012).
Hypothesis 8: (Public employees). Public employees affect the GDP growth
positively because the higher public employees the higher public expenditure a therefore the higher old GDP. Based on Wagner’s law (Wagner, 1911), it is possible that public employment in Angola and public expenditures are endogenous due to simultaneous reverse
5. DATA AND RESULTS
The data set was obtained from the Angola Statistical Institute and was supplemented with data from Angola public expenditure and public debt obtained in the ministry of finance, the equation to be estimated is as follows:
(3)𝐺𝐷𝑃𝑔𝑟𝑜𝑤𝑡ℎ𝑖𝑡 = 𝑐𝑜𝑛𝑠𝑡𝑎𝑛𝑡𝑖𝑡+ 𝛽1𝑙𝑜𝑔𝐺𝐷𝑃𝑖𝑡+ 𝛽2𝑡𝑟𝑒𝑛𝑑 + 𝛽3𝑆𝑞𝑡𝑟𝑒𝑛𝑑 +
𝛽4𝑙𝑜𝑔𝑃𝑜𝑝𝑢𝑙𝑎𝑡𝑖𝑜𝑛𝑖𝑡+ 𝛽5𝑙𝑜𝑔𝑝𝑢𝑏𝑙𝑖𝑐 𝑒𝑥𝑝𝑒𝑛𝑑𝑖𝑡𝑢𝑟𝑒𝑖𝑡+ 𝛽6𝑙𝑜𝑔𝑝𝑢𝑏𝑙𝑖𝑐𝑑𝑒𝑏𝑡𝑖𝑡+
𝛽7𝑙𝑜𝑔𝐺𝐷𝑃𝑝𝑒𝑟𝑐𝑎𝑝𝑖𝑡𝑎𝑖𝑡+ 𝛽8𝑙𝑜𝑔𝑝𝑢𝑏𝑙𝑖𝑐𝑒𝑚𝑝𝑙𝑦𝑒𝑒𝑠𝑖𝑡
In spatial models, the first step is to observe if there are spatial correlations between the variables. The Global Moran’s I statistic is traditionally used to test spatial autocorrelation. In the present case, it is 1.0012 with a P-value >z (12.110) and statistically significant at 0.000, revealing that there are spatial autocorrelations between the variables of Angola provinces (Anselin, 1988). These results enable us to accept that there is spatial autocorrelation present in the estimated models. Table 3
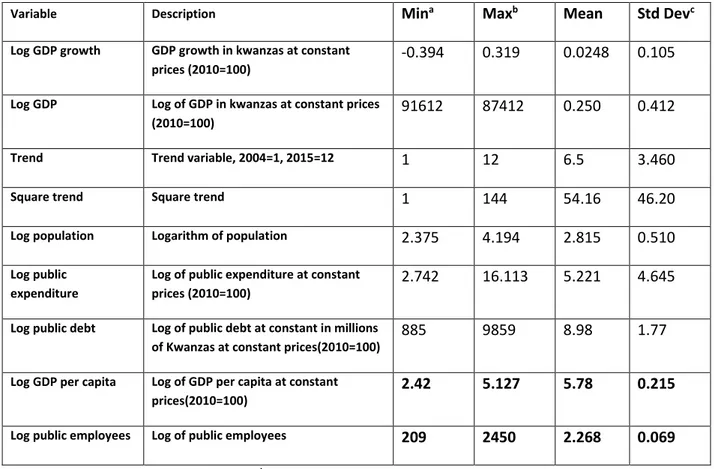
Table 3: Characterization of the Variables: 2004-2014
Variable Description Mina Maxb Mean Std Devc
Log GDP growth GDP growth in kwanzas at constant
prices (2010=100)
-0.394 0.319 0.0248 0.105
Log GDP Log of GDP in kwanzas at constant prices
(2010=100)
91612 87412 0.250 0.412
Trend Trend variable, 2004=1, 2015=12 1 12 6.5 3.460
Square trend Square trend 1 144 54.16 46.20
Log population Logarithm of population 2.375 4.194 2.815 0.510
Log public expenditure
Log of public expenditure at constant prices (2010=100)
2.742 16.113 5.221 4.645
Log public debt Log of public debt at constant in millions
of Kwanzas at constant prices(2010=100)
885 9859 8.98 1.77
Log GDP per capita Log of GDP per capita at constant
prices(2010=100)
2.42 5.127 5.78 0.215
Log public employees Log of public employees 209 2450 2.268 0.069
a Min – Minimum; b Max – Maximum; c Std Dev – Standard Deviation
Three models are estimated with the aim of describing the robustness of the results. Firstly, the traditional spatial model, the Spatial Auto-regression Model (SAC). Second, the spatial Hans-Pillips linear spatial dynamic model is used, which takes into account the dynamic trend in GDP. Finally, the 3SLS spatial model is adopted to investigate possible causes of endogeneity.
Table 4: Estimation results of the Spatial model (endogenous variable: GDP growth rate)
SAC Spatial auto-regression model (fixed effects)
Hans Phillips Dynamic Spatial Model
3SLS spatial model
(3.833) (0.308)
PIB lagged one period ________ 0.793*
(0.166) _________ w1y_logpib ________ 0.0082 (0.008) -0.0004 (0.0002) w1y_Time ________ _________ 0.000038 (0.0000) Trend 0.212 * (0.027) 0.264* (0.020) 0.2061* (0.0157) Square trend -0.010 * (0.002) -0.014* (0.001) -0.008* (0.001) Log population 10.033* (1.08) 0.651 (0.418) 0.3500** (0.187)
Log public expenditure 0.722*
(0.079)
0.2104* (0.060)
0.06016 (0.034)
Log public debt -0.042*
(0.008)
-0.0191 (0.014)
-0.0508* (0.013)
Log GDP per capita 0.361*
(0.037)
0.139* (0.024)
0.021 (0.016)
Log public employees 0.552*
(0.437) 1.477 (1.680) 0.048 (0.183) Sample size 216 216 216 Overall R2 0.9689 0.9124 0.9009 Rho value 7.359* (1.639) 0.582 (2.024) 0.513 (1.218) Lambda value 21.509* (1.489) ______ _____
Note: T statistic below the parameters: ** statistically significant at 1%; *statistically significant at 5%
6. DISCUSSION AND CONCLUSION
This paper analyses the relationship between growth and public debt at the regional level for Angola. From a theoretical perspective, public expenditure and public debt do not increase GDP growth because the debt has to be paid off through future reductions in public spending or distortionary taxation, with negative effects on growth. However, in the context of Angola, the contrary result may appear. Based on the present research, it is shown that public expenditure increase GDP but public debt decrease GDP, validating previous research (Kumar and Woo, 2010; Checherita-Westphal and Greenlaw et al., 2013) with a spatial model and a focus on provinces, and not on countries. Furthermore, GDP per capita also increases GDP and public employees increase also.
This result enables to accept hypothesis namely Hypothesis 1is accepted since spatial persistence is revealed in the spatial models estimated. Hypothesis 2 is also accepted since the trend increases GDP and hypothesis 3 is also accepted because square trend decreases GDP. Hypothesis 4 is also accepted because population increase GDP. The main hypothesis, hypothesis 5 is accepted since public expenditure increases GDP and hypothesis 6 is also accepted since public debt decrease GDP. Finally hypothesis 7 is accepted because GDP per capita increase GDP and hypothesis 8 is accepted as public employees increase GDP.
The policy implication of the present research is that Angola needs a regional GDP growth policy that enables the country to adequately use the public debt in period of crisis at the regional level but to decrease it during periods of growth. With the regional economy being based on traditional agriculture. In this context public expenditure should controlled adequately. More research is needed to confirm these results.
BIBLIOGRAPHY
Anselin, L. (1988). Spatial Econometrics: Methods and Models. Boston: Kluwer Academic Publishers.
Ashworth, J.; Geys, B. and Heyndels, B. (2005) Government Weakness and Local Public Debt Development in Flemish Municipalities. Tax and Public Finance 12(4), 395-422.
Barros, Mandlaze and Chivangue (2016). Hiding poverty at the donors’ request: inequality and deprivation in Mozambique. Mimeo.
Barros, C.P., Faria, J.R. & Araújo Jr., A. F. (2012). Brazilian Land Tenure Conflicts: a Spatial Analysis. Journal of International Development, 26, 409-421.
Barros, C.P., Wanke, P. and Figueiredo, O. (2015). Peasants' Poverty and Inequality in Angola. Social Indicators Research. (forthcoming).
Barros, C.P. (2014). Airports and Tourism in Mozambique. Tourism Management, 41, 76-82.
Barros, C.P.; Faria, J.R. and Araujo Jr, A.F. (2014)BRAZILIAN LAND TENURE CONFLICTS: A SPATIAL
ANALYSIS. Journal of International Development, 6, 4, 409–421,
Blanchard, Olivier J. (1985). Debt, deficits, and finite horizons. Journal of Political Economy, 93 (2), 223–247.
Chakravorty, S. (2003) capital source and the location of insdustrial investment: A tale of divergence from post-reform India. Journal of International Development, 15, 365-383 Checherita-Westphal, Cristina and Rother, Philipp (2012). The impact of high government debt
on economic growth and its channels: an empirical investigation for the euro area. European Economic Review, 56 (7), 1392–1405.
Cordella, Tito; Ricci, Luca Antonio and Ruiz-Arranz, Marta, (2010). Debt overhang or debt irrelevance? IMF Staff Papers, 57 (1), 1–24.
Diamond, Peter A. (1965). National debt in a neoclassical growth model. American Economic Review, 55 (5), 1126–1150.
Dreger, Christian and Reimers, Hans-Eggert (2013). Does euro area membership affect the relation between GDP growth and public debt? Journal of Macroeconomics, 38 (PB),
Eberhardt, M. and Presbitero, A. (2015) Public debt and growth: Heterogeneity and non-linearity. Journal of International Economics, 97, 45–58.
Elmendorf, Douglas W. and Mankiw, Gregory N. (1999). Government debt. In Taylor, J.B. and Woodford, M. (eds.), Handbook of Macroeconomics. Elsevier, pp. 1615–1669. (Chapter 25).
Frincke, B. and and Greiner, A. (2015) Piblic Debt and the economic growth in emerging market economies. South African Journal of Economics, 83, 3, 537-370.
Greenlaw, David; Hamilton, James; Hooper, Peter and Mishkin, Frederic S. (2013). Crunch time: fiscal crises and the role of monetary policy. Proceedings of the U.S. Monetary Policy Forum 2013.
Haddad, M.A. (2008) Bolsa familia and the needy: is allocation contributing to equity in Brazil. Journal of International Development, 20, 654-669.
Kourtellos, Andros; Stengos, Thanasis and Tan, Chih Ming (2013). The effect of public debt on growth in multiple regimes. Journal of Macroeconomics, 38, 35–43.
Kumar, Manmohan S. and Woo, Jaejoon, (2010). Public debt and growth. IMF Working Papers 10/174. International Monetary Fund.
LeSage, J. (2005). Spatial Econometrics, in The Encyclopedia of Social Measurement, volume 3, edited by Kimberly Kempf-Leonard. Netherlands: Elsevier: 613-619.
Mohamed, B. M. (2013) Assessing the Short- and Long-run Real Effects of Public External Debt: The Case of Tunisia. African Development Review, 25, 4, 587–606
Modigliani, Franco (1961). Long-run implications of alternative fiscal policies and the burden of the national debt. Economic Journal, 730–755.
Mistry, P.S. (1991) African Debt Revisited: Procrastination or Progress?. African Development Review, 3, 2, 99–148,
Panizza, Ugo and Presbitero, Andrea F., (2014). Public debt and economic growth: is there a causal effect? Journal of Macroeconomics, 41, 21–41.
Perez-Moreno, S. (2016). Revisiting the growth-poverty relationship: A medium-term causality approach. South African Journal of Economics, (forthcoming).
Reinhart, C.M. and Rogoff, K.S. (2010) Growth in a Time of Debt. American Economic Review: Papers & Proceedings 100 (May 2010): 573–578
Temple, Jonathan (1999). The new growth evidence. Journal of Economic Literature, 37 (1), 112– 156.
Ussain, N. and Gunter, B. G. (2005) External Shocks and the HIPC Initiative: Impacts on Growth and Poverty in Africa. African Development Review, 17, 3, 461–492
Weeks, J. (2000) Latin America and the ‘high performing Asian economies’: growth and debt. Journal of International development, 12, 5, 625–654,
Owusu-Nantwi, V. and Erickson, C. (2016) Public Debt and Economic Growth in Ghana. African Development Review, 28, 1, 8268-12174
Wagner, A. 1911. Staat in nationalökonomischer Hinsicht. In Handwörterbuch der
Staatswissenschaften. 3rd ed., Book VII. Jena: Lexis. 743-745.
Weeks, J. (2000) Latin America and the High performing Asian economies: Growth and Debt. Journal of International Development, 12, 652-654.
Zhao, S. X.; Tong, C.S. P. and Qiao, J. (2002) China's WTO accession, state enterprise reform, and spatial economic restructuring. Journal of Interrnational Development, 14, 4, 413–433