Article
Printed in Brazil - ©2016 Sociedade Brasileira de Química 0103 - 5053 $6.00+0.00
*e-mail: [email protected]
Easy Method for Removal of Cyanogens from Cassava Leaves with Retention of
Vitamins and Omega-3 Fatty Acids
Iasmine G. Pereira,a Julianna M. Vagula,b Denis F. Marchi,a Carlos E. Barão,a Gleice R. S. Almeida,a Jesuí V. Visentainer,c Swami A. Maruyamac and Oscar O. Santos Júnior*,a
aInstituto Federal de Educação, Ciência e Tecnologia do Paraná, R. José Felipe Tequinha 1400,
87703-630 Paranavaí-PR, Brazil
bDepartamento de Pós-Graduação em Ciência dos Alimentos and cDepartamento de Química,
Universidade Estadual de Maringá, Av. Colombo 5790, 87020-900 Maringá-PR, Brazil
Currently there is a crescent interest regarding the use of vegetable by-products for food fortification, in order to improve its nutritional quality. Cassava leaves are suitable as nutritional additives, however their cyanide content must be reduced to below 10 mg kg-1 of dry product.
Thus, it was developed a method in drying laboratory oven which is able to reduce 99.85% of cyanide present in manioc leaves (from 35 mg kg-1 to 0.05 mg kg-1) while being 509% faster than
the traditional method, and without substantial loss of omega-3 fatty acids and β-carotene.
Keywords: cyanide, fatty acids, biofortification, proteins
Introduction
Cassava is a relevant vegetable in many countries of the south hemisphere, due to its high nutritional content, low production costs and adaptability to different edaphoclimatic conditions. The combination of these factors makes cassava an ideal crop for countries with intermediate/low GDP (gross domestic product). In this context, the African continent is the greatest manioc producer.1
Brazil occupies the second position regarding cassava production ranking with 26 million tons, while most of the big/medium manioc processing industries are located in southern Brazil. Paraná state leads the regional production (around 70%).2
Usually, only cassava roots are commercialized, while their aerial parts (leaves) are discarded as agricultural residues. However, manioc leaves possess high percentages of nutrients like proteins,3 fibers,4 omega-3 fatty acids,
vitamins 5 and minerals.6
In Brazil, a “multimistura” - a dietary supplement, composed of several ingredients and powdered cassava leaves, specially used by children and pregnant women to avert malnutrition - is produced since 1988.7
Although cassava leaves are a source of valuable nutrients, they also have toxicity due to cyanogenic
glucosides (which can cause cyanide poisoning, with symptoms of headache, nausea, dizziness, diarrhea and vomiting, sometimes leading to death) and antinutritional factors (high fibre content, tannins, polyphenols and phytic acid) which reduce nutrient bioavailability, uptake and digestibility. Eventually they may have more or less intense toxic effects depending on the processing.8,9
In this context, the response surface methodology (RSM) is very useful for optimizing such processing methods, because it allows to evaluate the individual influence of reaction factors over the desired response, and to research if exist negative or positive interactions between such factors, always aiming to obtain a mathematical model which describes the chemical process in question.10
Therefore, the objective of this study is to optimize, through RSM, the drying process of cassava leaves in laboratory oven with air circulation in order to eliminate cyanogenic glucosides while maintaining the contents of vitamins and omega-3 fatty acids.
Experimental
Sampling
the chemistry laboratory from Paraná Federal Institute (also located in Paranavaí). For each drying experiment (according to experimental design), approximately 100 g of leaves were weighed, crushed and placed in a laboratory oven with air circulation.
Chemical reagents
The reference standards: β-carotene, methyl tricosanoate and a fatty acid methyl esters (FAME) standard mix (189-19), all with purity > 99%, were acquired from Sigma-Aldrich (São Paulo, Brazil). The reagents: methanol, n-hexane, sulfuric acid, solution of 14% boron trifluoride
(BF3) in methanol, ammonium chloride and sodium
hydroxide were of analytical grade.
Total cyanide content determination
Total cyanide content in samples was determined (in triplicate) through the method described by Egan et al.11
A weighed amount of cyanogenic sample was placed in a small flat-bottomed glass or clear plastic vial (about 25 mm diameter × 50 mm high), followed by a known amount of buffer solution and a known amount of linamarase. A yellow strip of filter paper (previously prepared by dipping filter paper in a solution of moist picric acid, 0.5%, m/v, in 2.5%, m/v, sodium carbonate, allowing the paper to dry in air and then cutting to the required size) was suspended above the cyanogenic sample and the vial immediately tightly stoppered. The vials were normally placed in an oven at 30 oC overnight and the change in colour from yellow to
orange to brown was observed. The shade of colour was compared with that of a colour chart to obtain the amount of cyanogen present. The paper was immersed in water for about 30 min and the absorbance measured at 510 nm against a similarly prepared blank developed in the absence of cyanogen. By means of a standard curve of absorbance vs. HCN content (µg) it was possible to obtain a semi quantitative measure of the amount of cyanogen present.
Moisture, ash and crude protein
All analyses were accomplished in three replicates. The moisture, ash and crude protein contents were determined using AOAC Official Methods 930.15, 942.05, and 960.52, respectively.12
Total lipid extraction
The amounts of total lipids in samples were determined through the gravimetric method proposed by Bligh and
Dyer.13 Determinations were achieved in triplicate.
Transesterification of total lipids
Transesterification of fatty acids from total lipids were
executed according to Maia and Rodriguez-Amaya.14
Approximately 500 µL of a methyl tricosanoate (23:0) solution (internal standard at 1 mg mL-1 in 2-methylheptane)
were added along with lipid sample (25 mg) to a screw-capped glass tube. After homogenization, the 2-methylheptane was removed through flowing of gaseous N2. Then, 4 mL of a methanolic NaOH solution
(0.5 mol L-1) were added. The entire system is double-boiled
at 100 oC during 5 min, and cooled to room temperature.
With complete cooling, 5 mL of an esterifying solution were added and the tube and once again double-boiled to 100 oC for 5 min and cooled with running water to
room temperature. Immediately after this step, 5 mL of a saturated NaCl solution were added to the tube, followed by vigorously shaking for 30 s and, finally, 2 mL of 2-methylheptane were added with subsequent shaking for another 30 s. The esterified sample was left to rest in a fridge, until separation of phases. The supernatant were removed and taken for chromatographic analysis.
Chromatographic analyses
FAME were separated in a gas chromatograph from Thermo, model 3300 (Madison, USA), equipped with a flame ionization detector, automatic injector and a capillary column of fused silica CP-7420 SELECT-FAME (100% bonded cyanopropyl, 100 m × 0.25 mm, 0.39 µm). Injector and column temperatures were 230 and 240 oC,
respectively. Initially, the column temperature was maintained at 165 °C for 18 minutes. Then, it was raised to 235 °C, at a rate of 4 °C min-1. Total chromatographic
run time was 32.5 min. The flow rates for the carrier (H2),
auxiliary (N2) and detector flame (H2 and synthetic air)
gases were 1.2 mL min-1, 30 mL min-1, 30 mL min-1 and
300 mL min-1, respectively. Sample split ratio was 1/80. For
identification, FAME retention times were compared with the commercial. Retention times and peak area percentages were automatically processed through the Chromquest 5.0 software (Madison, USA). Fatty acids were quantified in mg g-1 of total lipids through internal standard calibration,
using methyl tricosanoate as internal standard.15
Extraction of β-carotene
cassava leaf sample were weighed and placed in a test tube. Then, it was added 80 mL of cold acetone with subsequent grinding with the aid of a micro grinder.
The obtained extracts were filtered in a Buchner funnel with vacuum. The extraction with acetone was repeated until residue became colorless. The filtrate was slowly transferred to a separator funnel, to which 80 mL of cold petroleum ether were added. The pigments present in acetone were transferred to petroleum ether. The acetone was discarded, and the petroleum ether fraction in the separatory funnel was washed with water (six times) to remove all acetone. Approximately 1 g of anhydrous sodium sulfate was added in the mixture to remove residual water. The extract was transferred to a round bottom flask and evaporated in a rotary evaporator at 35 °C until dryness. The pigments were dissolved in 10 mL of methanol, transferred to a amber glass flask, sealed and stored at –5 °C until analysis of β-carotene (executed in a maximum time of 24 h after extraction).
Separation and quantification of β-carotene
Determination of β-carotene was achieved in a
Chromaster liquid chromatograph (Hitachi, Kyoto, Japan) equipped with degasser, quaternary pump , autosampler set to 20 µL and diode array detector (DAD) set to 450 nm.17
For chromatographic separation a reverse phase C18 column (250 × 4.6 mm, 5 µm) was used. The
mobile phase used for β-carotene separation was
composed of 70% acetonitrile and 30% methanol at a flow rate of 1.5 mL min-1. Identification was made
by means of retention times, absorption spectra and co-chromatography when necessary. Quantification was performed through external standard curve with 6 points, all performed in triplicate. The concentrations of standards for curve preparation were 0, 5, 10, 50, 150, and 250 mg mL-1. Calibration curves were also used to
evaluate the linearity range. All samples and mobile phase were filtered through a 0.45 µm membrane (Millipore JBR61022 and HAWP04700, Bedford, MA).
Experimental design
The influences of independent variables (Table 1) in function of total cyanide were evaluated through the employment of a central composite rotary design, applicable to RSM, with five levels and two variables, totalizing 11 experiments, being: four factorial points, four axial points and three central points. The chosen intervals and variables were previously defined by bibliographic research. Only two variables were needed for optimization, time and temperature.
Statistical analysis
The experimental results were analyzed through a response surface methodology generated by the Design-Expert 7.1 software (Stat-Ease Inc., St. Louis, USA). The response was adjusted to the factors through multiple regressions. Model fit quality was evaluated by variance analysis and determination coefficients. The quadratic model was adjusted with the following equation 1:
Y = β0 + Ʃiβi χi + Ʃi βii χi2 + ƩƩi<1 βij χi χj + Ɛ (1)
where Y = response factor (reactional yield of FAME in mg g-1 of total lipids); χ
i = factor i (time); χj = factor j
(temperature), β0 = intercept; βi = first order coefficient of
the model; βii = quadratic coefficient of i factor; βij = linear
coefficient of the model for interaction between i and j factors; ε = experimental error attributed to Y.
Results and Discussion
Cassava leaves characterization
The results of moisture, ash, crude protein, total lipids and fatty acids (g per 100 g) from in natura cassava leaves are described in Table 2.
Table 1. Factorial design
Assay Aa / oC Bb / h X
Ac XB
1 40.00 33.00 –1 –1
2 75.00 33.00 1 –1
3 40.00 50.00 –1 1
4 75.00 50.00 1 1
5 32.75 41.50 –2 0
6 82.25 41.50 2 0
7 57.50 29.48 0 –2
8 57.50 53.52 0 2
9 57.50 41.50 0 0
10 57.50 41.50 0 0
11 57.50 41.50 0 0
aA = temperature; bB = time; cX = codified values.
Table 2. Proximate analysis of in natura cassava leaf sample, “fécula branca” variety
Component g per 100 g of sample
Moisture 67.20 ± 1.22
Ash 6.82 ± 0.02
Crude proteins 23.70 ± 0.42
From results shown in Table 2, in natura cassava leaf proved to be a food rich in proteins, possessing 23.70% of this constituent. This result is close to that described by Achidi et al,18 where it is described that cassava leaves
have protein contents greater than 20%. According to Oguntimein,19 the concentration of essential amino acids
in cassava leaf is similar to the ones reported in chicken egg, and greater than what is stablished for spinach leaves. It is noteworthy that the chemical composition of cassava aerial part is significantly influenced by variety,20 The total concentration of cyanide in in natura
cassava leaf was 35.0 mg kg-1. This value may vary to
reach 100 mg kg-1 according to genetic, ecological and
physiological factors.21
Analysis of fatty acids
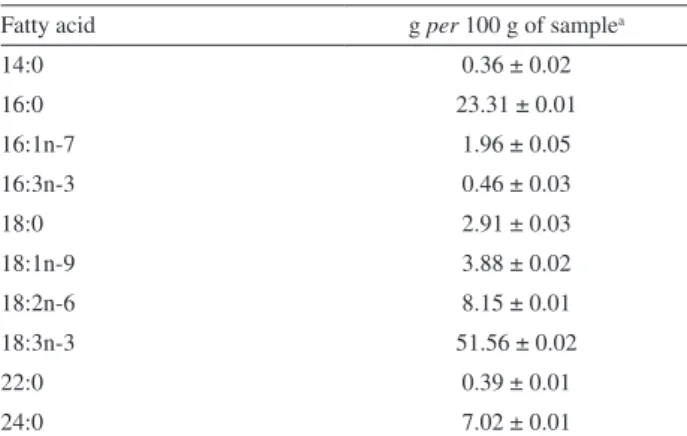
After esterification of total lipids from cassava leaf, the amounts of fatty acids in samples were determined. These percentages are shown in Table 3.
Analyzing the results shown in Table 3, it can be verified the presence of 10 fatty acids, with fatty acids of the omega-3 family being the predominant, showing a total percentage of 59.03 g per 100 g (58.57 ± 0.46), while linolenic acid (18:3n-3) is the main acid with 58.57 g per 100 g. Close results were found by Silva,22 in
which linolenic acid was also the major acid regarding all
analyzed varieties, ranging from 30.01 to 37.40 g per 100 g. These values are much higher than those described by Martin et al,23 for watercress, lettuce and cabbage, whose
values are 1.8, 0.9 and 1.8 g per 100 g, respectively. This demonstrates that cassava leaves can be used in food formulations as a source of omega-3.
Development of the regression model
The results for the experimental design for total cyanide content may be observed at Table 4.
Table 4. Total cyanide content and analysis of variance (ANOVA) for the response surface linear model
Assay A / °C B / h XA XB
Total cyanide / (mg kg-1 of sample)
1 40.00 33.00 –1 –1 3.41
2 75.00 33.00 1 –1 0.05
3 40.00 50.00 –1 1 3.33
4 75.00 50.00 1 1 0
5 32.75 41.50 –2 0 3.20
6 82.25 41.50 2 0 0
7 57.50 29.48 0 –2 2.85
8 57.50 53.52 0 2 1.18
9 57.50 41.50 0 0 1.68
10 57.50 41.50 0 0 1.33
11 57.50 41.50 0 0 1.25
Source Sum of squares DFa Mean square Fb-values p-values
Model 16.50 2 8.25 37.70 < 0.0001
A 15.72 1 15.72 71.85 < 0.0001
B 0.78 1 0.78 3.55 0.0964
Residual 1.75 8 0.22 – –
Lack of fit 1.65 6 0.27 5.25 0.1687
Pure error 0.10 2 0.052 – –
Total correlation 18.25 10 – – –
aDF = degrees of freedom; bF = F-value.
Table 3. Content of fatty acids (mg per 100 g) in dried cassava leaf, “fécula branca” variety
Fatty acid g per 100 g of samplea
14:0 0.36 ± 0.02
16:0 23.31 ± 0.01
16:1n-7 1.96 ± 0.05
16:3n-3 0.46 ± 0.03
18:0 2.91 ± 0.03
18:1n-9 3.88 ± 0.02
18:2n-6 8.15 ± 0.01
18:3n-3 51.56 ± 0.02
22:0 0.39 ± 0.01
24:0 7.02 ± 0.01
The total cyanide response were applied to multiple regression analysis and, among the models which were indicated by Design-Expert 7.1 software (linear, two factor interaction, 2FI, polynomial quadratic and cubic), the linear one were selected as the most adequate because it possesses a high significance order.24 Thus, the total
cyanide model which were adjusted based in the actual values in function of the studied variables, is shown in the equation 2.
Y = 7.79 – 0.08X1 – 0.037 X2 (2)
where Y = response factor (total cyanide in mg kg-1 of
sample); Xn = independent variables A and B (Table 1).
Positive signal indicates synergic effect in the total cyanide increase and negative signal indicates antagonistic effect, as described by Neto et al.24
The ANOVA results, which were calculated in order to determine: linear model significance, significant effects of each term and their interactions on the obtained responses, are shown in Table 4.
The obtained value for determination coefficient (R2 = 0.9041) indicates that 90.41% of experimental
response variability can be explained by the previously discussed model (eq. 2). Model’s regression F-value (37.70), with p-value < 0.0001, implies that it is significant at 95% trust level. Since p value is employed as a tool to verify the significance of each coefficient e indicate their interaction effects. If a p-value is low, then the corresponding coefficient significance is high.24 In models
terms case, the p-values lower than 0.05 indicates that they are statistically significant at 95% trust level.
The low value which were found for the coefficient of variation (CV = 6.79%) indicated a high precision grade of the experimental values.24 The lack of fit with p-value of
0.1687 indicates that it is not significant, confirming that the model explains very well the experimental data in the chosen interval.
Another form of evaluating model fit efficiency is to verify the graphic of predicted versus observed values for response of interest (Figure 1).
If graphic points are closer to regression line, better the model will be.
Parameters evaluation
Through the previously shown Table 4, it were verified which investigated variables showed significant effect at 95% trust level in the total cyanide in sample. Through Figure 2, it can be verified how these variables influence such total cyanide.
It can be seen in Figure 2 the influence of temperature and drying time on total cyanide concentration from cassava leaf. It can be observed that, with higher temperature and time values, the amount of present cyanide will be lower. The best results were found at 75 °C and 50 h (0 mg cyanide per kg of sample). However, with 33 h at 75 °C 0.05 mg kg-1 of cyanide are obtained, which is below the
maximum value reported by legislation (10 mg kg-1)1 while
reducing drying time by 34%.
The treatment used by catholic organizations to eliminate total cyanide is leaving cassava leaves stored between 25 and 28 °C in fresh air for seven days (168 h).7
This time is 509% higher in relation to the 33 h method from this work.
Severe processing conditions or exhaustive washes for preparation of cassava leaves can lead to large vitamin losses. According to Bradbury and Denton,25 10 min of
cassava leaf boiling in water at 100 °C reduce the vitamin C content of leaves in 60%. In some locations of Congo, sodium bicarbonate is added to boiling water in order to decrease the drawbacks of thermal treatment in leaves.
Figure 1. Predicted vs. actual values plot for total cyanide concentration in dried cassava leaves (“fécula branca” variety).
However, this procedure cannot be used by people with hypertension.26
Optimization of total cyanide and model validation
Through the experiments of Table 4, it may be verified that total cyanide concentration varied from 0.00 to 3.41 mg kg-1 of sample. However, total cyanide
concentration of 0.05 mg kg-1 of sample was obtained in a
temperature of 75 oC and 33 h. This interval was evaluated
in order to determine the optimal conditions to minimize the total cyanide concentration.
These conditions were validated by applying them to three independent experiments. The parameters were: 75 oC and 33 h for temperature and time, respectively, with
predicted total cyanide concentration of 0.057 mg kg-1 of
sample.
The obtained cyanide concentration was 0.053 mg kg-1
of sample. This empirical value is in accordance with the one predicted by the model (CV = 6.49%), demonstrating that this model can be used for prediction of total cyanide concentration in the studied interval.
Quantification of β-carotene
Figure 3 shows the chromatograms obtained for (a) standard of β-carotene and (b) β-carotene extracted from dried cassava leaf.
Using the calibration curve for β-carotene
(y = 33598x – 2576.1; R2 = 0.998), a β-carotene
concentration of 142 mg per 100 g sample was obtained for dried cassava leaf. This value is much higher than the found by Achidi,27 for TMS 30572 variety, between 3.3 to
4.5 mg per 100 g of sample.
Conclusion
Through RSM it was achieved the optimization and validation of a new, fast and efficient method for total cyanide elimination. Total optimized variables were 75 oC and 33 h for elimination of 99.95% of the cyanide
which was originally present in cassava leaf sample. The new method is 509% faster than what is normally used for preparation of cassava leaf flour, and it preserves a great concentration of β-carotene and omega-3 fatty acids.
Acknowledgments
Financial support by Coordenação de Aperfeiçoamento de Pessoal de Nível Superior (CAPES).
References
1. http://www.fao.org/fileadmin/templates/ess/documents/ meetings_and_workshops/AFCAS24/en/3a__Eng_.pdf accessed in January 2016.
2. http://www.agricultura.pr.gov.br/arquivos/File/deral/ Prognosticos/mandiocultura_2013_14.pdf accessed in December 2015.
3. Ngudi, D. D.; Kuo, Y. H.; Lambein, F.; J. Sci. Food Agric. 2003, 83, 529.
4. Awoyinka, A. F.; Abegunde, V. O.; Adewusi, S. R. A.; Plant Foods Hum. Nutr. 1995, 47, 21.
10. Bas, D.; Boyaci, I. H. J.; Food Eng. 2007, 78, 836.
11. Egan, S. V.; Yeoh, H. H.; Bradbury, J. H.; J. Sci. Food Agric. 1998, 76, 39.
12. Cunniff, P.A. Official Methods of Analysis of AOAC International, 16th ed.; Arlington, Association of Analytical
Chemistry, CD-Rom, 1998.
13. Bligh, E. G.; Dyer, W. J.; Can. J. Biochem. Physiol. 1959, 37, 911.
14. Maia, E. L.; Rodriguez-Amaya, D. B.; Rev. Inst. Adolfo Lutz 1993, 53, 27.
15. Visentainer, J. V.; Quim. Nova. 2012, 35, 274.
16. Rodriguez-Amaya, D. B.; Ann. Bot. (Oxford, U. K.) 1976, 40, 615.
17. Batista, M. A.; Acta Scietiarum. Health Sciences 2006, 28, 93. 18. Achidi, U. A.; Ajayi, O. A.; Bokanga, M.; Maziya-Dixon, B.;
Ecol. Food Nutr. 2005, 44, 423.
19. Oguntimein, G. B. In Potential of cassava as livestock feed in Africa; Hahn; L. R. S. K.; Egbunike G. N., eds.; International Institute of Tropical Agriculture: Ibadan, 1988, ch 4.
20. Carvalho, V. D.; Chagas, S. J. R.; Morais, A.R.; Paula, M.B.; Rev. Bras. Mandioca 1989, 8, 25.
21. Fennema, O. R.; Química de los Alimentos, 5th ed.; Acribia:
Zaragoza, 1993.
22. http://www.agais.com/manuscript/ag0505_fornalhas.pdf accessed in January 2016.
23. Martin, C. A.; Almeida, V. V.; Ruiz, M. R.; Visentainer, J. A.; Matsushita, M.; Souza, N. E.; Visentainer, J. V.; Rev.Nutr., Campinas 2006, 19, 761.
24. Neto, B. B.; Scarminio, I. S.; Bruns, R. E.; Como Fazer Experimentos: Pesquissa e Desenvolvimento na Ciência e na
Indústria, 3th ed. Unicamp: Campinas, 2007.
25. Bradbury, J. H.; Denton, I. D.; CCDN News 2010, 15, 2. 26. Achidi, U. A.; Ajayi, O. A.; Bokanga, M.; Maziya-Dixon, B.;
Ecol. Food Nutr. 2005, 44, 423.
27. Achidi, A. U.; Ajayi, O. A.; Maziya-Dixon, B.; Bokanga, M.; J. Food Process. Preserv. 2008, 32, 486.
Submitted: October 23, 2015