UNIVERSIDADE FEDERAL DO CEARÁ CENTRO DE TECNOLOGIA
CURSO DE ENGENHARIA DE PETRÓLEO
LIGIA TORNISIELLO
A MODEL FOR PRELIMINARY DESIGN OF STEEL CATENARY RISERS USING BIO-INSPIRED ALGORITHMS
LIGIA TORNISIELLO
A MODEL FOR PRELIMINARY DESIGN OF STEEL CATENARY RISERS USING BIO-INSPIRED ALGORITHMS
Monography presented in the undergraduate course of Petroleum Engineering of the Centro de Tecnologia of Universidade Federal do Ceará, as a partial requirement for obtaining the title of Bachelor of Petroleum Engineering.
Supervisor: Evandro Parente Junior
Dados Internacionais de Catalogação na Publicação Universidade Federal do Ceará
Biblioteca Universitária
Gerada automaticamente pelo módulo Catalog, mediante os dados fornecidos pelo(a) autor(a)
___________________________________________________________________________ T638m Tornisiello, Ligia.
A model for preliminary design of steel catenary risers using bio-inspired algorithms / Ligia Tornisiello. – 2017.
79 f. : il. color.
Trabalho de Conclusão de Curso (graduação) – Universidade Federal do Ceará, Centro de Tecnologia, Curso de Engenharia de Petróleo, Fortaleza, 2017.
Orientação: Prof. Dr. Evandro Parente Junior.
1. Risers. 2. Otimização. 3. Algoritmos bio-inspirados. I. Título.
CDD 665.5092
To God.
ACKNOWLEDGEMENTS
To my parents, José Nivaldo Tornisiello and Leni Aparecida Sbravatti, who have always believed in my potential and supported me in all decisions during my academic life. I salute you for the confidence, encouragement, for providing me good education and teaching me the value of hardwork. To my brother, Rodrigo, for the friendship.
To my boyfriend, Bruno, for the companionship and motivation throughout these years and for the opportunity of sharing great experiences, from the exchange studies to the leadership of the board of directors of the Society of Petroleum Engineers student chapter at UFC.
To my supervisor, Evandro Parente Junior, for all the knowledge transmitted along the eighteen months of development of the research and for the excellent orientation.
To the professors of the examining board, Antônio Macário Cartaxo de Melo and Pedro Felipe Gadelha Silvino.
To the colleagues of Laboratório de Mecânica Computacional e Visualização (LMCV), in special, Juliana, Elias, Guilherme, Luana and Marina who directly helped me in some stage of the development of this research.
To CNPq and ANP/UFC PRH-31 for the financial support.
To CAPES and the Ministry of Education of Brazil, for the scholarship that I was granted. The experiences lived at Missouri University of Science and Technology and at the University of Texas at Austin were fundamental to improvement in technical knowledge and likewise important to my personal growth and maturity.
ABSTRACT
Risers are tubular structures used in offshore production systems to convey the fluids from the wellhead at the seabed to a floating platform on the sea surface. They can be fabricated with distinct materials, from various grades of steel to titanium and composite materials. Furthermore, these structures can be installed in different configurations, from free-hanging catenary to configurations that include floating elements. Independent of the material and configuration, all risers are subjected to diverse types of loadings, including hydrostatic internal and external pressures, weight and buoyancy, weight of internal fluid, waves, currents, and vessel motion. The design of a riser is very time consuming, since a large number of parameters (e.g. thickness, top angle, and material properties) are involved and tight safety requirements must be met. This leads to the study of tools, such as optimization algorithms, that can speed up the process of elaborating a feasible riser design for certain conditions. Considering that some of the parameters in the design of a riser can assume a discrete set of values, the utilization of mathematical programming algorithms becomes unfeasible. It is then necessary to use metaheuristic algorithms, such as Genetic Algorithm (GA) and Particle Swarm Optimization (PSO). In this context, this work presents a study on the application of bio-inspired algorithms, including GA and PSO, to the design optimization of steel catenary risers. The problem consists of finding the riser material and wall thickness that minimize the riser cost, in conformance with the requirements of technical standards. An inextensible cable model is utilized for riser analysis in the static and quasi-static loading cases. Based on the potential of the association of surrogate models with optimization algorithms, a surrogate model for the prediction of the dynamic amplification factor was developed in this work to be utilized in lieu of dynamic analysis. The main hypotheses that were adopted are presented, along with the description of the methodology employed for the construction of the surrogate model, including the selection of the variables, the design of the experiments, model training and validation. The efficiency of the utilized algorithms in finding an optimum riser design for the specified conditions is confirmed by the obtained numerical results. Assuredly, the main contribution of this work is the development of a model for preliminary design of steel catenary risers that reduces the dependence on the designer’s experience and allows this activity to be conducted within an acceptable execution time.
RESUMO
Risers são estruturas tubulares utilizadas em sistemas de produção de petróleo offshore para transportar os fluidos produzidos da cabeça do poço no solo marinho a uma unidade flutuante no nível do mar. Essas estruturas podem ser fabricadas com diferente materiais, incluindo diversos tipos de aço, titânio e materiais compósitos, e instalados em diversas configurações, desde catenária livre a configurações que incluem elementos flutuantes. Independente do material e configuração, todos os risers estão sujeitos a diversos carregamentos, incluindo pressão hidrostática interna e externa, peso próprio e empuxo, ondas, correntes e movimento da plataforma (offset). O projeto de um riser envolve muitos parâmetros, considerando também aspectos relacionados a segurança. Então, a seleção de um riser com desempenho estrutural aceitável para determinado cenário pode se tornar um processo exaustivo, e, portanto, deve ser tratado como um problema de otimização. A utilização de algoritmos de programação matemática não é viável nesse caso, pois alguns dos parâmetros do design de um riser podem assumir valores discretos. É necessário então utilizar algoritmos metaheuristicos, como Algoritmos Genéticos (AG) e Otimização por Enxame de Partículas (PSO). Nesse contexto, esse trabalho apresenta um estudo da aplicação de algoritmos bio-inspirados, incluindo AG e PSO, para otimização de risers de aço em catenária. O problema consiste em encontrar o material e espessura de parede que minimizam o custo do riser, em conformidade com os requerimentos de normas técnicas. A análise do riser nos casos de carga estáticos e quase-estáticos é feita utilizando um modelo de cabo inextensível. Baseado no potencial de associação de metamodelos e algoritmos de otimização, um metamodelo para previsão do fator de amplificação dinâmica foi elaborado nesse trabalho para substituir as análises dinâmicas. As hipóteses adotadas serão apresentadas, juntamente com a descrição da metodologia para elaboração do metamodelo, incluindo a seleção das variáveis, o projeto de experimentos, treinamento e validação do modelo. A eficiência dos algoritmos em encontrar um projeto ótimo de riser para as condições especificadas é confirmada com os resultados dos exemplos numéricos. Certamente, a maior contribuição desse trabalho foi a elaboração de um modelo para projeto preliminar de riser de aço em catenária que reduz a dependência da experiência do projetista nessa atividade e permite que o pré-dimensionamento seja realizado em um tempo de execução aceitável.
LIST OF FIGURES
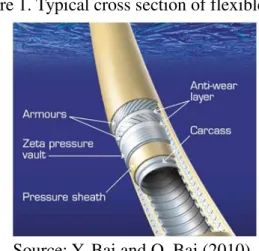
Figure 1 Typical cross section of flexible pipe ... 17
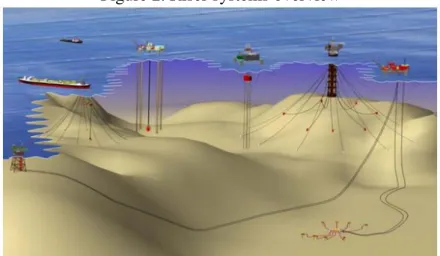
Figure 2 Riser systems overview …... 18
Figure 3 Riser configurations with buoyancy modules ... 18
Figure 4 Buoyant free standing riser ... 19
Figure 5 Free hanging catenary riser ... 19
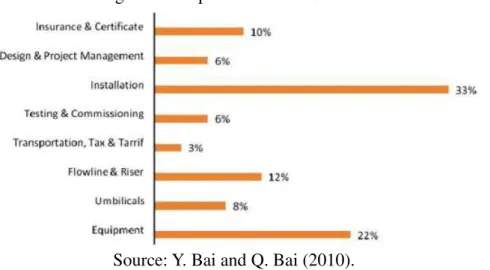
Figure 6 Deepwater subsea CAPEX ... 20
Figure 7 Floater motions ... 21
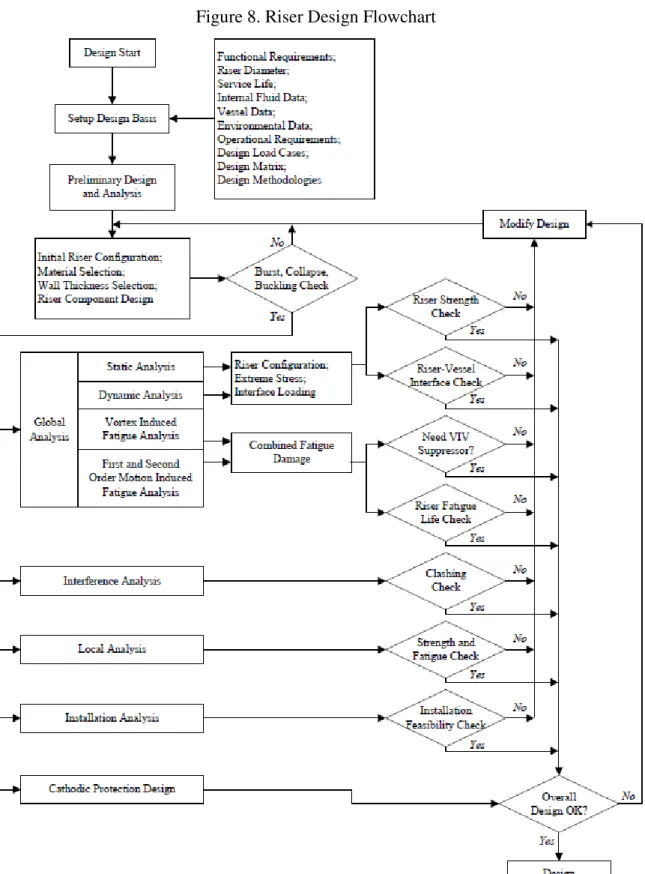
Figure 8 Riser design flowchart ... 23
Figure 9 Genetic algorithm functioning diagram ... 33
Figure 10 Swarm topologies ... 35
Figure 11 Example of encoding for a possible riser design ...………. 39
Figure 12 Riser model in FLEXCOM ……… 41
Figure 13 Metamodelling framework ……… 45
Figure 14 Example of a three-dimensional full factorial sampling ……… 47
Figure 15 Example of a three-dimensional, ten-point LHS ………... 47
Figure 16 Results obtained with the sensitivity study ……… 55
Figure 17 2D projections of the LHS ………. 56
Figure 18 DNV code checking using FLEXCOM – Load cases n°7, 8, 11, 12 …...… 64
Figure 19 DNV code checking using FLEXCOM – Load cases n°13 to 16 …………. 64
LIST OF TABLES
Table 1 Material resistance factor ... 25
Table 2 Safety class resistance factor ... 25
Table 3 Classification of safety classes ... 26
Table 4 Material strength factor ... 26
Table 5 Load effect factor ... 28
Table 6 Model parameters ... 36
Table 7 Data that define a load case ... 36
Table 8 Material encoding ... 38
Table 9 Thickness encoding ... 38
Table 10 Mechanical properties of the materials ... 39
Table 11 Load cases data for comparison of riser analyses results using the inextensible cable model and FLEXCOM ………. 42
Table 12 Current data ……… 42
Table 13 Results for effective tension using the inextensible cable model and FLEXCOM ………... 43
Table 14 Metamodel variables and bounds ……….. 54
Table 15 Dynamic load cases considered in the comparison between dynamic amplification factors predicted by E-RBF and obtained with FLEXCOM for the riser defined in Section 3.2.5 ………. 57
Table 16 Wave data for the load cases considered in the comparison between dynamic amplification factors predicted by E-RBF and obtained with FLEXCOM for the riser defined in Section 3.2.5 ………. 58
Table 18 Comparison of the dynamic amplification factor predicted by the E-RBF
and calculated with FLEXCOM for the riser defined in Section 3.2.5 ……. 58
Table 19 Model parameters – SCR for Scenario 1 ………... 59
Table 20 Load cases – SCR for Scenario 1 ……….. 60
Table 21 Parameters of the optimization algorithms ……… 60
Table 22 Relative cost of the materials – Case 1 ……….. 60
Table 23 Relative cost of the materials – Case 2 ………. 62
Table 24 Current data – Scenario with water depth of 2000 m ……… 63
Table 25 Current data – Scenario with water depth of 2000 m ……… 63
Table 26 Structure of the .opt file ………. 72
LIST OF ABBREVIATIONS AND ACRONYMS
ABS American Bureau of Shipping AFFG Adaptive Fuzzy Fitness Granulation AIS Artificial Immune System
ALS Accidental Limit State ANN Artificial Neural Networks API American Petroleum Institute
ASME American Society of Mechanical Engineers CAPEX Capital Expenditures
DNV Det Noske Veritas
FEED Front-end Engineering Design FEM Finite Element Model
FLS Fatigue Limit State
FPSO Floating Production Storage and Offloading FSHR Free Standing Hybrid Riser
GA Genetic Algorithm
HPHT High Pressure High Temperature IGA Island-based Genetic Algorithm
ISO International Standardization Organisation LFRD Load and Resistance Factor Design
LHS Latin Hypercube Sampling MAE Maximum Absolute Error
MARS Multivariate Adaptive Regression Splines MIGA Multi-island Genetic Algorithm
NLPQL Non-linear Programming by Quadratic Lagrangian NSGA-II Non-dominated Sorting Genetic Algorithm II OOP Object-Oriented Programming
PF Penalty Function
PSO Particle Swarm Optimization RAO Response Amplitude Operator
RMSE Root Mean Squared Error SCR Steel Catenary Riser SLS Serviceability Limit State
SQP Sequential Quadratic Programming SVM Support Vector Machine
LIST OF SYMBOLS
D riser out diameter
Ci relative cost of the material
E Young’s modulus
fo ovality
fu tensile strength
fu,temp temperature derating factor for the tensile strength fy yield strength
fy,temp temperature derating factor for the yield stress g gravity acceleration
h hydrostatic column at the specified riser cross section Li length or the riser segment
MA bending moment from accidental loads Md design bending moment
ME bending moment from environmental loads MF bending moment from functional loads Mk plastic bending moment resistance n number of riser segments
Pb burst resistance
Pc hoop buckling resistance Pd design pressure
Pe external pressure
Pel elastic collapse pressure Pld local internal design pressure Pli local incidental pressure Pmin minimum internal pressure Pp plastic collapse pressure
PPr resistance against buckling propagation Re external radius of the riser segment Ri internal radius of the riser segment
SWL still water level t riser wall thickness
TeA effective tension from accidental loads Ted design effective tension
TeE effective tension from environmental loads TeF effective tension from functional loads Tk plastic axial force resistance
αc parameter accounting for strain hardening and wall thinning αfab fabrication factor
αU material strength factor
γA load effect factor for accidental loads γc buckle propagation factor
γE load effect factor for environmental loads γF load effect factor for functional loads γm material resistance factor
γSC safety class factor
ν Poisson’s ratio
ρint internal fluid density
ρwater water density
Δ offset
β amplification factor
icp current profile index
TABLE OF CONTENTS
1 INTRODUCTION ... 14
2 RISERS ... 16
2.1 Riser types – materials and configurations ... 16
2.2 Design aspects ... 19
2.3 Design codes ... 24
3 RISER OPTIMIZATION ... 29
3.1 Optimization algorithms ... 32
3.1.1 Genetic Algorithms ... 32
3.1.2 Particle Swarm Optimization ... 34
3.2 Definition of the optimization problem ... 35
3.2.1 Model parameters ... 36
3.2.2 Design variables ……….………... 37
3.2.3 Objective function ……….………. 39
3.2.4 Constraints ……….………. 40
3.2.5 Riser analysis ……….………. 40
3.2.6 Implementation ……….……….. 43
4 SURROGATE FOR DYNAMIC AMPLIFICATION FACTOR ... 44
4.1 Surrogate modelling …………..…….……….……….. 44
4.1.1 Surrogate variables and sampling plan ……..……….……….. 45
4.1.2 Choice of surrogate modelling approach ……….. 48
4.1.2.1 Radial basis functions ……….………... 48
4.1.3 Model training and validation ……….……….. 50
4.2 Surrogates in riser design ………...………….………. 51
4.2.1 Surrogate model for the dynamic amplification factor ………. 53
5 NUMERICAL EXAMPLES AND DISCUSSION ……….. 59
6 CONCLUSIONS ... 66
REFERENCES ... 67
1 INTRODUCTION
Risers, which are key elements in offshore production systems, along with other technological innovations, have evolved and enabled the production of oil and gas in deepwater fields. In such environments, riser design is complicated by some critical parameters: thicker walls are required due to high hydrostatic pressure, which results in heavier riser and higher cost; the currents can lead to vortex-induced-vibrations (VIV); design of complementary components of attachment of the riser to the host vessel may be necessary to accommodate movements of the vessel due to wave action; significant heave motions from host platform leads to fatigue damage (RUSWANDI, 2009).
The failure of these structures may represent serious environmental and safety risks; therefore, it is necessary to establish a high degree of reliability for riser design. Design requirements are addressed in standards and recommended practices, such as the ones from Det Norske Veritas (DNV), the American Petroleum Institute (API) and the American Bureau of Shipping (ABS), which provide general guides to design, construction and installation of risers for offshore applications.
Since riser design is performed in many stages and the traditional methodology is based on trial and error, it is considerably dependent on the designer’s experience. Hence, the problem of elaborating a feasible riser for certain scenario may be treated as an optimization problem. Due to the presence of discrete variables (e.g. type of material and thickness), the utilization of gradient based optimization methods (Mathematical Programming) is not suitable. Therefore, the main objective of this work was the elaboration and implementation of a model for preliminary design of steel catenary risers. Based on the literature review, wall thickness and material of the riser (which can be made up of one or more segments) were defined as the optimization variables. Instead of using a structural analysis software, a simplified model for static analyses of risers was adopted in the optimization model. In a comparison study, the results obtained with the inextensible cable model and Finite Element analysis, demonstrated the adequacy and accuracy of this this simplified analysis model.
proved to be adequate for preliminary design of steel catenary risers.
This work is organized as follows. Initially, risers material and configurations are briefly reviewed, and the main stages of riser design and the technical standards and recommended practices are discussed (Chapter 2). The developed optimization model, including the functioning of the chosen algorithms, the model parameters, variables, objective function, constraints, analyses procedure, and its implementation are detailed in Chapter 3.
2 RISERS
The exhaustion of the most profitable and easily accessible resources of oil and gas motivated the industry to focus on exploration and development of new reservoirs located offshore in deep water (from 400 to 1500 m water depth) and ultra-deepwater (water depths of more than 1500 m). In order to make production of oil and gas in such deepwater fields profitable and possible, the industry had to look for technological innovation for the facilities used in the different stages of the production, which should be able to stand the high pressures and low temperatures of these hostile environments. For instance, new platforms, drilling technology, risers and pipelines were developed to comply with the requirements imposed by deepwater fields.
2.1 Riser types – materials and configurations
A riser is a “pipe that connects an offshore floating production structure or a drilling rig to a subsea system either for production purposes such as drilling, production, injection and export or for drilling, completion and workover purposes” (TENARIS, 2017). In respect of materials, there are essentially two kinds of risers, namely flexible risers and rigid risers.
Flexible risers are multiple-layer pipes, with alternate plastic and metallic layers with different structural functions. As illustrated on Figure 1, the flexible riser structure typically contains an internal sheath that acts as internal fluid containment barrier, several tensile steel layers and pressure reinforcement layers, and an external layer that acts as external fluid barrier (CHAKRABARTI, 2005). This combination of sheaths with different properties and functions allow this type of riser to be, at the same time, lightweight, resistant and flexible. However, the cost of flexible risers is usually high.
Figure 1. Typical cross section of flexible pipe
Source: Y. Bai and Q. Bai (2010).
The selection of material grade is a critical stage of the riser design and it should take into consideration the cost, the resistance to corrosion effects, weight requirements and weldability. The choice of the material grade has cost implications on fabrication, installation and operation of the riser. The resistance and cost of fabrication are higher for higher grade steels. However, selecting a higher grade steel may allow a reduction of riser wall thickness, leading to a reduction of weight and tension, and consequently a reduction in riser fabrication cost.
For some of the more sophisticated steels, there are some difficulties in welding the pipe sections, which can delay the installation process and increase the cost of installation of risers made of higher grade steel when compared to lower grade steel riser. Furthermore, depending on the fluid that is going to be conveyed, the riser can be subjected to erosion and corrosion, and the adequate material should be selected in order to assure that such problems do not affect the operation of the riser (BAI, Y.; BAI, Q., 2005).
Risers are one of the most complex aspects of a deepwater production system and they can be installed in different configurations, which range from free catenary to configurations that include floating elements (Figure 2). Riser configuration design is performed according to production requirements and site-specific environmental conditions, such as water depth, host vessel motion characteristics, number and type of risers and mooring layout and environmental data.
particular field (LEFFLER; PATTAROZZI; STERLING, 2003).
Figure 2. Riser systems overview
Source: Y. Bai and Q. Bai (2010).
Figure 3. Riser configurations with buoyancy modules.
Source: Leffler, Pattarozzi and Sterling (2003).
A buoyant free standing riser is a type of hybrid riser that has a vertical section of rigid metal riser connected to a subsea buoy below wave action zone and a flexible line that interconnects the rigid section and the host platform (Figure 4). This characteristic allows this type of riser to accommodate relative motion between floating structure and rigid riser. Free Standing Hybrid Risers (FSHR) are also relatively insensitive to motion induced fatigue (RUSWANDI, 2009).
fatigue issues in the touchdown zone (TDZ).
Figure 4. Buoyant free standing riser
Source: Ruswandi (2009). Figure 5. Free hanging catenary riser
Source: API (1998). 2.2 Design aspects
Figure 6. Deep water subsea CAPEX
Source: Y. Bai and Q. Bai (2010).
Riser design is performed in many stages, which are summarized in Figure 8. Initially, all the data and conditions for the design of a riser system are specified for the setup of the design basis. Applied codes and standards, design criteria, environmental conditions, design loads and safety factors are defined in this document. A design criterion is used to verify if the designed riser is capable of withstanding all loads anticipated over its specified design life.
In a preliminary front-end engineering design (FEED) phase, riser host layout, location, spacing and azimuth are defined. Then, general sizing of the riser is conducted. Internal diameter sizing is a complex stage and it is a function of the production characteristics of each well, such as flow rate, fluid composition and pressure (TANAKA, 2009). Riser wall thickness sizing is performed based on checks for burst, collapse and combined loads criteria, in accordance with technical standards. For SCRs in deepwater fields, thicker walls are required due to high hydrostatic pressure, which results in heavier riser and higher cost.
Material selection will be influenced by reservoir properties (e.g. pressure and temperature), fluid characteristics (e.g. corrosive fluids), weldability, weight requirements, as mentioned before. The characteristic of high-pressure high-temperature (HPHT) wells may result in de-rating of material steel strength and care has to be taken when selecting the material for such cases.
which varies in direction and intensity with depth, acts along the entire riser length. Moreover, current and waves have effect over the platform, resulting in shift in its position, which is referred as offset.
Structural analysis are conducted to check the integrity of the riser under all load combinations. First, static analyses are conducted to determine the equilibrium profile of the riser under the combined effects of self-weight, buoyancy and vessel offset. These analyses are derived for near, mean and far locations of the host platform. Results for effective tension, bending moment, von Mises stress and riser configuration are obtained in the static analysis and used in design code checking. Then, dynamic analyses are conducted to account for the effect of waves over the riser.
Both waves and currents are classified in centenary (100 years), decennial (10 years) and annual (1 year) waves/currents, according to their return periods. The environmental condition is more rigorous for waves and currents with higher return period. The loading cases considered in dynamic analyses are combinations of centenary waves and deccenial currents and vice versa. The risers can be analyzed using regular wave approach, frequency domain random wave approach or time domain wave approach (BAI, Y.; BAI, Q., 2005).
The response amplitude operator (RAO) of the floating facility is an important input for the dynamic analysis, since it describes how the floating facilities respond to the action of the waves. The RAOs depend on the characteristics of the floating facility (e.g. tension leg platforms and semisubmersibles have different sensitivities to waves). Floaters have six degree of freedom: surge, sway, heave, roll, pitch and yaw, as shown in Figure 7 (KONGSBERG, 2017).
Figure 7. Floater motions
Source: Kongsberg (2017).
currents, winds and floater motions (DNV, 2010b). The fatigue life is defined as the number of stress cycles at a particular magnitude required to cause fatigue failure (DNV, 2011) but is commonly expressed in number of years based on the number of occurrence of the stress cycles per year. Traditionally, SCRs are designed for 25 years or more with a safety factor of 10 to cover all the uncertainties (QUEÁU, 2015).
The general procedure for deterministic fatigue analysis reported in DNV RP-C203 (2011) is summarized as follows. First, the entire wave scatter diagram is divided into representative blocks with one associated sea state per block that constitutes the loading and represents all the sea states within this block. The stress range, generated under the action of a sea state, is used along with a S-N curve to determine the number of cycles that would lead to failure under this loading condition and the damage for each sea state is calculated. This procedure is repeated for every selected sea state for the blocks of the wave scatter diagram and then the individual damages are accumulated using the Palmgren-Miner rule to obtain the total damage ratio. Finally, the fatigue life of the riser is calculated as the inverse of the total damage ratio.
Then, interference and clashing analysis is performed to evaluate the potential interference between: different production risers, production riser and drilling riser, riser and mooring lines, riser and umbilicals, riser and offshore installation, riser and any other obstructions. Local analyses are to be conducted in order to check if clashing involving risers may occur and to ensure the integrity of the structures if it occurs (ABS, 2014).
The next step in the riser design comprises an installation analysis. The pipes for steel risers usually arrives in 40-foot (12.2 meters) sections that are butt-welded together or mechanically coupled to form the line and installed by pipeline laying vessels that follow one of the following installation methods: S-lay, J-lay, reel-lay or tow-in (LEFFLER; PATTAROZZI; STERLING, 2003). The installation analysis is conducted to determine limiting conditions for installation procedures and takes into consideration issues such as load capacity and positioning capacity of installation vessel; interference between the riser in installation and other already-installed risers, mooring lines and umbilicals (ABS, 2014).
Figure 8. Riser Design Flowchart
2.3 Design codes
A riser shall be designed to answer the specific needs of a project in accordance with technical standards. The most renowned standards and recommended practices for riser design were elaborated by the American Society of Mechanical Engineers (ASME), Det Norske Veritas (e.g. DNV-OS-F101, DNV-OS-F202, DNV-RP-F204), the International Standardization Organisation (ISO) or the American Petroleum Institute (e.g. API 5L, API RP 2RD) (FROUFE, 2006). These standards are referenced throughout this work.
Two design methods that may be applied in riser design are: Working Stress Design (WSD) and Load and Resistance Factor Design (LFRD). The main difference between these methodologies is that the WSD considers a central safety factor for each limit state to account for uncertainties originated from different causes, while the LFRD separates the influence of uncertainties by means of partial safety factors. Then, the WSD is considered as a more conservative design method, while the LFRD allows a more flexible design with uniform safety level (DNV, 2010a).
This work follows the standards and recommended practices of DNV, which will be discussed herein. According to DNV-OS-F201, the limit states are classified as:
- Serviceability Limit State (SLS) requires that the riser must be able to remain in service and operate properly when subjected to operational loads;
- Ultimate Limit State (ULS) requires that the riser must remain intact and avoid rupture, but not necessary be able to operate;
- Accidental Limit State (ALS) requires that the riser must remain intact and avoid rupture when subjected to accidental loads;
- Fatigue Limit State (FLS) requires that the riser must remain fit to function during its service life due to accumulated excessive fatigue crack growth or damage under cyclic loading. Three major issues that can cause fatigue damage include first order wave loading and associated floater motion, second order floater motion and VIVs due to current.
In ULS, the riser shall be designed against bursting, buckling and combined loading criteria. To avoid bursting (rupture of the pipe wall due to internal overpressure), riser shall be designed to satisfy the following condition at all cross sections:
(1) SC
m b e li
P P P
where Pli is the local incidental pressure, Pe is the external pressure, γm is the material resistance factor that accounts for material and resistance uncertainties (Table 1), γSC is the safety class factor (Table 2), Pb is the burst resistance given by:
(2) where t is the riser wall thickness, D is the riser outer diameter, fy is the yield strength given by:
(3) where SMYS is the specified minimum yield stress at room temperature based on the engineering stress-strain curve, fy,temp is the temperature de-rating factor for the yield stress and αU is the material strength factor (Table 4). The fu is the tensile strength given by:
(4) where SMTS specified minimum tensile strength at room temperature based on the engineering stress-strain curve and fu,temp is the temperature de-rating factor for the tensile strength. Values for the temperature derating factors for yield stress and tensile strength can be found on DNV-OS-F201 (2010), accordingly to riser material and temperature of operation.
The local incidental pressure can be calculated at each riser cross section as:
(5) where Pd is the design pressure (maximum surface pressure during normal operations), ρint is the density of the internal fluid, g is the gravity acceleration, and h is the hydrostatic column at the specified riser cross section.
Table 1. Material resistance factor γm
ULS, ALS 1.15 SLS, FLS 1.00 Source: adapted from DNV (2010a).
Table 2. Safety class resistance factor γSC
Low 1.04
Normal 1.14
High 1.26
Source: adapted from DNV (2010a). 15 . 1 , min 2 3 2 u y b f f t D t P U temp y
y SMYS f
f ( , )
U temp u
u SMTS f
f ( , )
int
1.1
li d
Table 3. Classification of safety classes
Safety class Definition
Low Where failure implies low risk of human injury and minor environmental and economic consequences.
Normal
For conditions where failure implies risk of human injury, significant environmental pollution or very high economic or political consequences.
High For operating conditions where failure implies high risk of human injury, significant environmental pollution or very high economic or political consequences.
Source: adapted from DNV (2010a).
Table 4. Material strength factor αU
Normal 0.96
Supplementary requirement 1.00 Source: adapted from DNV (2010a).
To avoid buckling (rupture of the pipe wall due to external overpressure), riser shall be designed to satisfy the following condition at all cross sections:
(6) where Pmin is a minimum internal pressure, PPr is the resistance against buckling propagation, γc is a factor that assumes the value of 1.0 if no buckle propagation is allowed. The resistance against buckling propagation PPr is given by:
(7) where αfab is a fabrication factor that assumes the value of 0.85 in the worst scenario. If the pipe design is sufficient to meet the above propagation criterion, the system hoop buckling (collapse) criterion is also met.
To guarantee riser integrity under combined loading, the following conditions shall be respected in case of net internal overpressure and net external overpressure, respectively:
(8) (9) SC m c e P P P
Pr min 25Pr 35
D t f
P yfab
d 1 ld e 2 ed 2 ld e 2 1SC m
k b k b
M p p T p p
M p T p
2 2 22 2 min
1
d ed e
SC m SC m
k k c
M T p p
M T p
where Ted is the design effective tension, Tk is the plastic axial force resistance, Md is the design bending moment, Mk is the plastic bending moment resistance, Pld is the local internal design pressure and Pc is the hoop buckling resistance.
The plastic axial force resistance Tk is given by:
(10) and the plastic bending moment resistance Mk is given by
(11) where αc is a parameter accounting for strain hardening and wall thinning given by:
(12) where
The design effective tension Ted is given by:
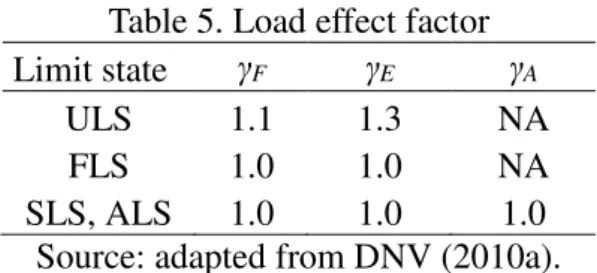
(13) where γF, γE, γA are the load effect factors for functional, environmental and accidental loads respectively (Table 5), TeF, TeE, TeA are the effective tension from functional, environmental and accidental loads, respectively.
The design bending moment Md is given by:
(14) where MF, ME, MA are the bending moment from functional, environmental and accidental loads, respectively.
t t D f
Tk yc( )
2
( )
k y c
M f Dt t
(1 ) u
c y f f
0.4 for <15
0.4 60
for 15< <60 45
0 for >60
h h D q t D q D t t D t ld e 2
for p >p 3
0 else
ld e b h p p p q
ed F eF E eE A eA
T T T T
d F F E E A A
Table 5. Load effect factor Limit state γF γE γA
ULS 1.1 1.3 NA
FLS 1.0 1.0 NA
SLS, ALS 1.0 1.0 1.0
Source: adapted from DNV (2010a).
The hoop buckling resistance Pc is calculated from:
(15) where fo is the ovality, Ppis the plastic collapse pressure and Pel is the elastic collapse pressure. This equation has the following analytical solution (DNV, 2013):
(16) where
The plastic collapse pressure Ppis given by:
(17) The elastic collapse pressure Pel is given by:
(18) where E is the Young’s Modulus and νis the Poisson’s ratio.
t D f p p p p p p
pc el)( c2 p2) c el p 0
(
1 3
c
p y b
2 0 2 2 3 1 3 1 1 3 3
1 2 1
2 27 3
cos
60
2 cos
3 180
el
p el p
el p
b p
D
c p p p f
t
d p p
u b c
v b bc d
v u y u fab y p f D t
p 2
3 RISER OPTIMIZATION
The utilization of optimization procedures in the field of Petroleum Engineering has been increasing recently, such as in the optimization of production operations (WANG, 2003; WANG; FENG; HAYNES, 2015), optimization of waterflooding management (HOROWITZ; AFONSO; MENDOÇA, 2013), optimization of artificial lift systems such as electric submersible pumps (ADHAV; SAMAD; KENYERY, 2015), riser optimization (LARSEN; HANSON, 1999; PINA et al., 2011; VIEIRA; LIMA; JACOB, 2012; SILVA et al., 2013; TANAKA; MARTINS, 2007; DE ANDRADE et al., 2010), and other problems.
The objective of an optimization procedure is to find not only a satisfactory solution, but an optimal solution that minimizes a cost function and respects all safety criteria and fabrication constraints. The optimization algorithms can be deterministic (such as Linear Programming and Sequential Quadratic Programming) or random (such as Genetic Algorithm, Particle Swarm Optimization, and Simulated Annealing). Deterministic algorithms require continuous and differentiable objective and constraint functions in the search domain. However, this is not the case for most of the engineering applications. For these cases, algorithms such as Genetic Algorithm (GA) and Particle Swarm Optimization (PSO), which are included in the class of bio-inspired algorithms, may be utilized.
Larsen and Hanson (1999) developed a methodology for optimization of steel catenary risers considering only static scenarios. The design variables chosen by the authors were the length and thickness of riser segments and the horizontal distance from lower to upper end of the riser at far position. Since the variables were considered as continuous, a Sequential Quadratic Programming (SQP) scheme was adopted. For the global riser analysis, initially an approximated solution is found by catenary theory, and this solution is then applied as starting point for a finite element method. The objective was to minimize the riser total cost and restrictions related to design variables bounds, global geometry (sum of the segments must exceed the length of a straight line between the ends of the riser), minimum riser length in contact with the seafloor, maximum equivalent stress and local buckling capacity are considered. The numerical examples presented by the authors demonstrated the usefulness of optimization tools for the design of catenary risers.
riser segment with distributed floater, lower riser segment and buoy length, buoy diameter and buoy spacing. The objective function is the total cost of the riser. Restrictions of maximum equivalent von Mises stress, maximum angle between riser axis and the vertical direction at the connection with the platform, maximum “built in” angle (dictated by the design of the flex joint), maximum tension at riser top and minimum tension at the riser bottom are considered. For a numerical example considering only static load cases, PSO and some of its variants were tested. As the result of the employed methodology, the authors were able to tailor a PSO algorithm for the design of steel lazy-wave risers and developed a user-friendly optimization tool.
Tanaka and Martins (2007) developed a model for optimization of steel risers for free-hanging catenary and lazy wave configurations considering dynamic loads. For this purpose, it was considered that the riser had three segments and the lengths of these segments were the design variables. The floater thickness of the second segment was also a design variable. Materials, inner and outer diameters of the segments were considered as given. The riser analysis for static problem was based in the direct integration of the differential equations which govern the behavior of the riser without bending stiffness (EI = 0), via a Runge-Kutta method. For dynamic analysis, a finite element model was used. Since simulations of dynamic conditions can slow down the optimization process, only one extreme dynamic condition was considered on the examples illustrated by the authors. The objective function chosen by the authors was the maximum stress amplitude of the dynamic problem solution. This choice of objective function was motivated by the fact that performing actual fatigue calculation during the optimization would be computationally too costly. Then, by minimizing such stress, the authors expect that the fatigue life would be maximized. Based on standard design practices, constraints on minimum tension along the riser, minimum curvature radius and maximum stress were defined. The optimization algorithm chosen by the authors was GA.
this methodology, the authors confirmed that such optimization technique reduces the effort of generating preliminary steel lazy wave riser configurations that meet design code criteria.
In this work, an optimization model for SCRs was developed. This chapter will discuss the details of the developed optimization model, including the functioning of GA and PSO, and the model parameters, variables, objective function, constraints and analyses procedure, and its implementation.
3.1 Optimization algorithms
3.1.1 Genetic Algorithms
The Genetic Algorithms, first studied by John Holland in the 1970’s, is based on
the ideas of natural selection proposed by Darwin and genetic heritance proposed by Mendel (ARORA, 2012). According to Darwin’s theory, the individuals that are most adapted to the environment have greater chances of transmitting their genetic characteristics to the next generations, while the least adapted individuals tend to disappear.
In this optimization algorithm, individuals represent possible solutions of the optimization problem, and these are subjected to natural evolution, genetic recombination and mutation, which will be discussed later. In the context of riser optimization, it means that each individual represents a set of data that defines certain riser design in the domain of the problem solutions, and this data is encoded in the individual’s chromosomes. Furthermore, the set of individuals, which evolves throughout the generations, corresponds to the population.
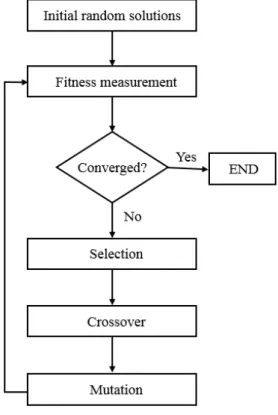
Then, the fitness of each individual of the population is calculated based on the penalized objective function of the problem. In a minimization problem, as is the case in this work, individuals with lower values for the objective function have higher fitness and are assigned greater probabilities of selection for crossover (ROCHA, 2013). With the calculated fitness, pairs of individuals are randomly selected for crossover. There are different mechanisms for the selection of these pairs, such as ranking, roulette and tournament (ARORA, 2012).
The crossover involves the breakdown of the chromosome in certain points and the recombination of the parts. This genetic operator, which is responsible for the convergence of the method, is applied to the pairs of individuals (parents) and generates two new individuals (sons) with the characteristics of both parents. In a mechanism referred as elitism, the best individuals of a previous generation are copied to the next generation. This algorithm feature guarantees that the best solutions do not worse from one generation to another (BARROSO, 2015).
Figure 9. Genetic algorithm functioning diagram
Source: author.
finding the global minimum of the problem. These operations are repeated until a stop criterion (e.g. maximum number of generations, maximum number of generations without improvement of the penalized objective function) is met.
3.1.2 Particle Swarm Optimization
The Particle Swarm Optimization, proposed by Kennedy and Eberhardt (1995), mimics the social behavior of animals, such as flock of birds and schools of fishes, in the search for food. As in GA, the PSO involves a population of individuals or particles, which represent potential solutions of the optimization problem, but in this case the search of the particle swarm is guided by social interactions (VIEIRA, 2009). This means that each particle moves in the search space cooperating and competing with the other particles through successive iterations (BRATTON, 2007). In other words, each particle learns from its own previous experiences and from the swarm experience, evaluating its performance, comparing it to the other particles performance, and then mimicking only the more successful particles.
Firstly, a set of particles is randomly generated. Each particle is represented by a vector x, with dimension equal to the number of design variables. Each particle xi has an associated velocity vector vi. The fitness function is evaluated for each of the particles and it is compared to the best fitness value for the particle from all previous iterations, and the correspondent position xip is stored. The particle in the neighborhood with the best success is identified and its correspondent position xig is updated.
The particles position and velocity are iteratively updated by the following expressions, until a stop criterion is met.
i i i
x x v
(19)
1 1( ) 2 2( )
i i i i i i
p g
w r c r c
v v x x x x
Since the development of the PSO by Kennedy and Eberhardt (1995), many other variations of the method have been proposed, such as the introduction of a term related to the passive congregation force (which refers to an attraction of an individual to other group members but where there is no display of social behavior) (HE et. al, 2004; ALBRECHT, 2005), linear and non-linear variation of the inertia coefficient (EBERHARDT; SHI, 2000; CHATTERJEE; SIARRY, 2006), linear variation of the aggregation and congregation coefficients (RATNAWEERA et al., 2004; PINA et al., 2011)
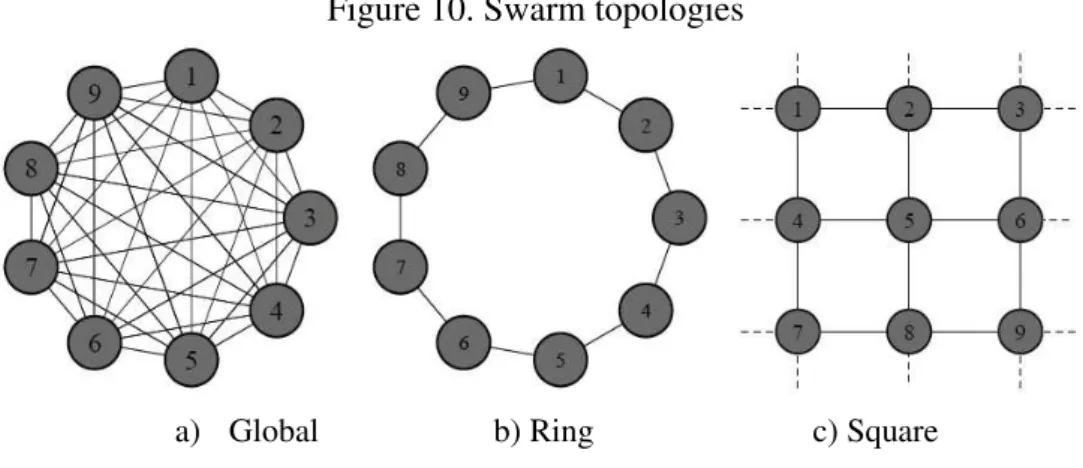
In the initial version of PSO (KENNEDY; EBERHARDT, 1995), the neighborhood was defined as the whole swarm, referred as Global Topology. This topology generally leads to a fast convergence, but makes the algorithm highly susceptible to premature convergence to non-optimal solutions (BARROSO; PARENTE JR.; MELO, 2017). Later, in order to solve this problem of premature convergence, the interactions between a particle and the neighboring particles and the influence of the topology on the particles’ learning were studied and other swarm topologies (e.g. Ring Topology, Square Topology) were proposed (Figure 10).
Figure 10. Swarm topologies
a) Global b) Ring c) Square Source: Barroso, Parente Jr. and Cartaxo (2017) 3.2 Definition of the optimization problem
3.2.1 Model parameters
The model parameters involve all the data that is constant along the optimization process (Table 6). This includes the data that defines the scenario, such as the water depth, the coordinates of the connection, the still water level and the horizontal projection (horizontal distance from lower to upper end of the riser), and the safety factors. Each load case considered in the optimization model is described by a set of data, as presented in Table 7. Also, each current profile is defined by a number of points that correlates depth and current velocity.
The optimization algorithm parameters are defined in a specific input file. For both algorithms, it is necessary to specify the optimization number, the maximum generations, the population size (number of individuals) and the constraint tolerance. For GA, is necessary to specify the selection method (ranking or fitness proportional), the crossover rate, and the mutation probability. If PSO is the optimization algorithm chosen, the input file should include the swarm topology (square, ring or global), the particle inertia, the cognitive factor, the social factor. The structure of this file is described in Appendix A.
Table 6. Model parameters
Parameter Symbol
Gravity acceleration g
Water density ρwater
Still water level SWL
Connection coordinates (xcon, ycon)
Horizontal projection HP
Safety class factor γSC
Material resistance factor γm Buckling propagation factor γc
Material strength factor αU
Material fabrication factor αfab Temperature derating factor for the yield stress fy,temp Temperature derating factor for the tensile strength fu,temp
Source: author.
Table 7. Data that define a load case
Parameter Offset
Internal fluid density Pressure at riser top Amplification factor Load effect factor for functional loads Load effect factor for environmental loads Current profile index
Symbol Δ ρint Pd β γF γE icp
3.2.2 Design variables
In the literature review on SCRs optimization models and riser design methodology, the conclusions of the following authors were fundamental to the choice of the design variables of the proposed model. Karunakaran et al. (2005) presents the concept of weight optimized SCR, in which a variation in weight along the riser is achieved by the application of different density coatings along the riser length, indicating a remarkable improvement in SCR strength. Chandrasekaran and Jain (2016) argue that weight distribution along riser length profile may also be accomplished by varying the steel wall thickness of the riser. When designing risers for water depths between 3000 m and 4500m, Saglar, Toleman and Thethi (2015), indicated that an advantage could be gained if wall thickness of the top section of the riser was increased (instead of a single specified wall thickness for the entire riser). However, they did not consider this design in their work.
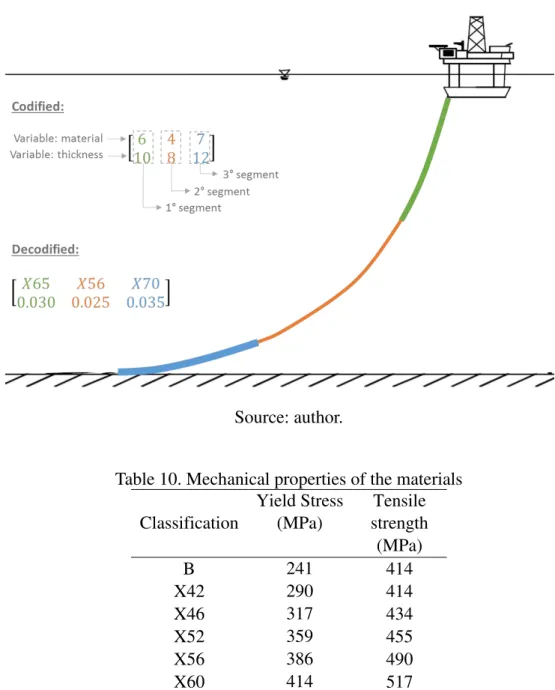
Based on the considerations and findings of the reviewed works, the design variables chosen for the optimization model were the material and thickness of the riser, which can be made up of only one segment or multiple segments. In the implementation, each possible design is represented by a matrix with two rows (the first row represents the material and the second row represents the thickness of the segments) and number of columns equal to the number of riser segments.
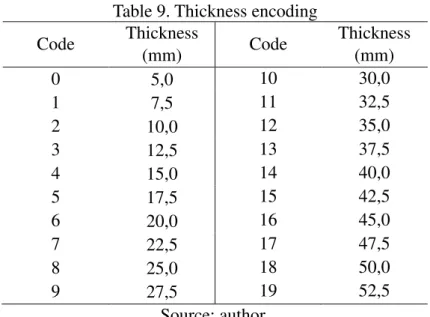
An integer encoding is used to represent the discrete variables, where each value assumed by the optimization variables represents the index of a list of discrete values. The possible materials and values for thickness are defined in the input file of the optimization. The structure of this file is described in Appendix A. Table 8 and Table 9 illustrate the encoding for the consideration of nine types of materials (represented in the encoding by numbers 0 to 8) and twenty possible values for wall thickness (represented in the encoding by numbers 0 to 19).
In GA parlance, the codified variables correspond to the genotype of an individual, while the decodified values correspond to its phenotype. The genotype is used by the algorithm operators, while the phenotype is used for the evaluation of the fitness function. For a riser with three segments, the codified variables of a possible design could be, for example:
[ 6 4 710 8 12]
11.
Table 8. Material encoding Code Material
0 B
1 X42
2 X46
3 X52
4 X56
5 X60
6 X65
7 X70
8 X80
Source: author.
Table 9. Thickness encoding Code Thickness
(mm) Code
Thickness (mm)
0 5,0 10 30,0
1 7,5 11 32,5
2 10,0 12 35,0
3 12,5 13 37,5
4 15,0 14 40,0
5 17,5 15 42,5
6 20,0 16 45,0
7 22,5 17 47,5
8 25,0 18 50,0
9 27,5 19 52,5
Source: author.
The mechanical properties of commercially available steels can be found on technical standards, such as in API Specification 5L (2004). Values for yield stress and tensile strength of the materials on Table 8 are listed on Table 10. These material properties are also
Figure 11. Example of encoding for a possible riser design
Source: author.
Table 10. Mechanical properties of the materials Classification
Yield Stress (MPa)
Tensile strength
(MPa)
B 241 414
X42 290 414
X46 317 434
X52 359 455
X56 386 490
X60 414 517
X65 448 531
X70 483 565
X80 552 621
Source: author. 3.2.3 Objective function
The chosen objective function was the riser cost, given by
2 2
1
( )
n
obj e i i i
i
f R R L C
(21)the material of the segment (defined in the input file of the optimization). 3.2.4 Constraints
The model restrictions follow the verification for the ULS in the normal safety class, as defined in DNV-OS-F201 (2010). Checks for bursting, buckling and combined load are included, according to Eq. (1), (6), (8) and (9). Since the analysis procedure adopted in the optimization model disregards the bending stiffness, the design bending moment (Md) and plastic bending moment resistance (Mk) terms in Eq. (8) and (9) are null.
Then, the optimization model can be summarized as follows: find 𝑥 = [𝑚𝑎𝑡𝑒𝑟𝑖𝑎𝑙 1 … 𝑚𝑎𝑡𝑒𝑟𝑖𝑎𝑙 𝑛
𝑡1 … 𝑡𝑛 ]
that minimizes 2 2
1
( ) n ( e i )
i
f x R R LC
subjected to:
1( ) 1 0, where and ;
brst
req brst brst b
req m SC n
brst
n li e
SF P
g x SF SF
SF P P
Pr 2
min
( ) 1 0, where and ;
bckl
req bckl bckl
req c m SC n
bckl
n e
SF P
g x SF SF
SF P P
2 23( ) SC m ed ld e 1 0;
k b
T p p
g x T p
2 4
2 min 24( ) 1 0.
ed e
SC m SC m
k c
T p p
g x T p
3.2.5 Riser analysis
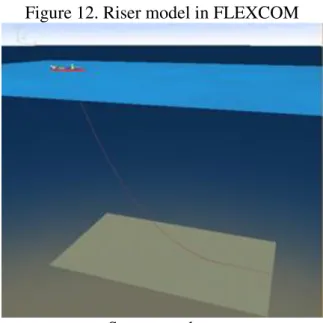
With the objective of validating the analysis model, different risers were analyzed using both the mentioned inextensible cable model and FLEXCOM (MCS KENNY, 2013), a structural analysis software package widely used in the offshore oil and gas industry, and the obtained results were compared. For illustration of the efficiency of the adopted analysis model, the comparison for a riser made of API 5L X56 steel with total length of 2520 m, internal radius of 0.125 m, thickness of 0.025 m, installed in a scenario with water depth of 1500 m and horizontal projection of 1732 m, is included.
The model for this riser on FLEXCOM can be seen on Figure 12. A total of 250 elements, numbered from the anchor to the connection, were considered. The load cases considered in this comparison are specified on Table 11 and the current data are detailed on Table 12. For each of the load cases, results for effective tension and geometry were compared. As can be seen on Table 13, the differences for effective tension at the anchor between the inextensible cable model and FLEXCOM are within ±3.5%. Furthermore, the differences for the effective tension at the connection are smaller than ±1%. In addition, a comparison of the computational cost of both procedures was carried-out and the results showed that the inextensible cable model was 16 to 26 times faster than FLEXCOM.
Figure 12. Riser model in FLEXCOM
Source: author.
concluded that this simplified analysis model is adequate for the proposed optimization model, since many individuals have to be evaluated during the optimization process.
Table 11. Load cases data for comparison of riser analyses results using the inextensible cable model and FLEXCOM
Load case
Internal Fluid
Offset Current
Direction SWL % Return period Direction
1 Oil near 8.5 - -
2 Oil far 8.5 - -
3 Empty near 8.5 - -
4 Empty far 8.5 - -
5 Water near 3.0 - -
6 Water far 3.0 - -
7 Oil near 8.5 100 E
8 Oil far 8.5 100 W
9 Empty near 8.5 100 E
10 Empty far 8.5 100 W
11 Water near 3.0 1 E
12 Water far 3.0 1 W
Source: author. Table 12. Current data
Depth [m] Velocity [m/s]
CE 1 CE 100 CW 1 CW 100
0 0.85 1.70 0.97 1.79
100 0.76 1.52 0.78 1.44
350 0.70 1.40 0.75 1.39
500 0.46 0.92 0.52 0.96
1000 0.35 0.70 0.36 0.67
1500 0.27 0.54 0.35 0.65
Table 13. Results for effective tension using the inextensible cable model and FLEXCOM Load
case
Effective Tension at Anchor [kN]
Effective Tension at Connection [kN] Flexcom Cable Diff. Flexcom Cable Diff. 1 655.0 659.8 0.73% 2718.9 2723.5 0.17% 2 1754.4 1770.0 0.89% 3817.0 3830.0 0.34% 3 456.4 457.0 0.13% 1884.9 1880.0 -0.26% 4 1222.1 1230.0 0.65% 2650.4 2650.0 -0.02% 5 945.7 953.0 0.77% 3113.0 3121.6 0.28% 6 1334.1 1350.0 1.19% 3501.3 3510.0 0.25% 7 579.1 595.4 2.82% 2642.2 2659.1 0.64% 8 1847.9 1848.5 0.03% 3910.4 3919.2 0.23% 9 379.0 392.4 3.54% 1808.1 1820.7 0.70% 10 1315.8 1303.4 -0.94% 2744.0 2732.0 -0.44% 11 952.2 923.4 -3.02% 3092.6 3092.0 -0.02% 12 1360.0 1379.3 1.42% 3527.1 3547.9 0.59%
Source: author. 3.2.6 Implementation
4 SURROGATE FOR DYNAMIC AMPLIFICATION FACTOR
4.1 Surrogate modelling
In many industries (such as in the aerospace, automotive and electronics industries) design problems are slow down by the computational burden incurred by expensive analysis and simulation processes. To address such challenge and to improve overall computation efficiency, surrogate models (also referred as metamodels) have been developed to replace these expensive numerical simulation procedures (WANG; SHAN, 2006).
The objective of a surrogate is to emulate the behavior of the actual expensive numerical procedure (also referred as high fidelity model), by capturing the relationship between the inputs and outputs. Once built, it provides fast analysis tools for exploration of the design space and optimization by using approximations in lieu of the computationally expensive analysis code themselves (SIMPSON et. al, 2001).
While the basic idea of the surrogate approach may sound simple, there are many details involved in this technique, including the choice of a design of experiments for data generation, the choice of a model to represent this data and the fitting of the model to the observed data (FORRESTER; SÓBESTER; KEANE, 2008). For each of these steps there are several options, as it will be discussed.
The surrogate modelling process can be summarized as follows (Figure 13): first, the model variables are selected according to preliminary experiments; then, samples are generated according to a sampling plan; next, a surrogate model type is selected and used to build a model of the underlying problem; later, new design points are analyzed and the results are added for upgrade of the surrogate, if necessary (FORRESTER; KEANE, 2009).
The surrogate modelling techniques include Kriging, Artificial Neural Networks (ANN), Radial Basis Functions (RBF), Multivariate Adaptive Regressions Splines (MARS), Support Vector Machine (SVM) (WANG; SHAN, 2006). In the field of Petroleum Engineering, these techniques can been applied to different kinds of problems.
under gas lift operations (RANJAN; VERMA; SINGH, 2015), to analysis of spread-mooring configurations for floating production systems (PINA et al., 2016).
Moreover, Kriging has been utilized in design optimization of electric centrifugal pumps (ADHAV; SAMAD; KENYERY, 2015) and for reservoir management optimization (PINTO, 2014), SVM has been used to assist in seismic interpretation (ZHAO et. al, 2014) and for prediction of PVT properties of crude oil systems (EL-SEBAKHY et. al, 2007), RBF has been applied to optimization of shaped-charge explosives of perforating guns (MCDONALD et. al, 2007) and riser design (CHEN et al., 2015).
Figure 13. Surrogate modelling framework
Source: Forrester and Keane (2009).
4.1.1 Surrogate variables and sampling plan
may be necessary to perform screening and sensitivity studies to identify the variables that do not have a significant effect on the objective function and thus can be left out of the surrogate (FORRESTER; SÓBESTER; KEANE, 2008).
The number of samples is dependent on the complexity of the function to be approximated and has a great impact over the surrogate accuracy. In general, more information of the function is provided when more sample points are considered, however, at a higher expense. On the other hand, for low-dimension functions, after a certain sample size is reached, an increase in the number of sample points does not contribute much to the surrogate accuracy (WANG; SHAN, 2006). Amouzgar and Strömberg (2017) define medium sample sizes of 3.5k and 2.5k for low dimension (four design variables or less) and high dimension (more than four design variables) functions respectively, and high samples sizes of 6k and 5k for low dimension and high dimension functions respectively, with the coefficient k given by:
( 1)( 2) 2
m m
k (22)
where m is the number of variables.
For successful construction of a surrogate of the response of interest based on a limited number of expensive simulations, careful planning of the experiments (referred as design of experiments) is crucial. There are many sampling approaches (e.g. random, full factorial, orthogonal arrays, Latin Hypercube, importance sampling, sequential or adaptive methods) (WANG; SHAN, 2006) and a robust sampling technique is desired to avoid dependency of the surrogate.
Evaluating the objective function for every possible combination of every possible design variable (which is referred as a full factorial design) (Figure 14) may be computational expensive. Although such design satisfies the uniformity criterion, it is only defined for designs of certain sizes (those that can be written as products of the numbers of levels for each dimension) and can lead to an unmanageably large number of samples (FORRESTER; SÓBESTER; KEANE, 2008). On the contrary, in a random sampling there is no uniformity, since the points are randomly defined within the variables bounds.
sampled (QUEIPO et. al, 2005). Figure 15 illustrates this feature for a ten-point LHS for a problem with three variables.
Figure 14. Example of a three-dimensional full factorial sampling
Source: Forrester, Sóbester and Keane (2008).
Figure 15. Example of a three-dimensional, ten-point Latin Hypercube sampling