Brazilian Journal of Food Research, Campo Mourão, v. 7, n. 1, p. 116-130, jan./abr. 2016. Página | 116
https://periodicos.utfpr.edu.br/rebrapa
Evaluation of the growth of enterobacteria
in fructooligosaccharides using the principal
components analysis
ABSTRACT
Luiza Siede Kuck
luizakuck@yahoo.com.br
Universidade Federal do Rio Grande do Sul, Porto Alegre-RS
Caciano Zapata Noreña
czapatan@ufrgs.br
Universidade Federal do Rio Grande do Sul, Porto Alegre-RS
Experimental data obtained from the literature concerning the growth rate of 35 different enterobacteria and acidification of the media using various carbohydrates as the substrates (glucose and the fructooligosaccharides Profeed P95, Raftilose P95 and Raftiline LS), were submitted to a multivariate statistical analysis of the principal components and clusters. The objective was to evaluate the degree of correlation between the substrates and the microorganisms, grouping them according to their affinities. When the growth rates of the enterobacteria were evaluated, strong correlation was observed between the substrates composed of short chain fructose oligosaccharides (Profeed P95 and Raftilose P95). The microorganisms could be separated into four groups, similarities being found between enterobacteria of the same genus and/or species. With respect to acidification of the medium, strong correlation was observed between glucose and Profeed, which have a greater percentage of glucose units in the chain. However, it was found poor correlation among microorganisms from the same genus and/or species, as well as between the enterobacteria species and fermentation of the carbohydrates.
KEY-WORDS: principal component analysis; cluster analysis; enterobacteria; fructooligosaccharides.
Brazilian Journal of Food Research, Campo Mourão, v. 7, n. 1, p. 116-130, jan./abr. 2016. Página | 117
INTRODUCTION
Fructans are linear or branched fructose polymers which may or may not have a D-glucose residue, which is usually located at the extremity and connected by an α-1,2 bond (HENDRY; WALLACE, 1993). Fructans are classified according to the type of glycosidic bond (POLLOCK et al., 1996), and can be divided into three groups: inulin, levan and graminan (SMITH, 1993). Inulin is a mixture of oligomers and polymeric chains with a variable number of fructose molecules that generally having a terminal glucose molecule (VILLEGAS; COSTELL, 2007), and has a polymerization degree varying between 2 and 60 with an average degree of 12 (GIBSON; ROBERFROID, 1995; TÁRREGA; ROCAFULL; COSTELL, 2010). Inulin have some related compounds, namely oligofructose and fructooligosaccharides (FOS), differentiated by the degree of polymerization of the molecule (MEYER et al., 2011), that is less than 10 (DREVON; BORNET, 1992). FOS are presents in several crops, such as yacon (CASTRO et al., 2013) and onion (KUMAR; PRASHANTH; VENKATESH, 2015).
Commercial FOS can be produced in two main ways: by the extraction and enzymatic hydrolysis of inulin, which can produce linear compounds of fructose units, with or without a glucose residue at the extremity of the chain, such as Raftilose P95 and Raftiline LS, or by the enzymatic transfructosilation of sucrose, producing compounds with only glucose residues, such as Profeed P95 (HARTEMINK; VAN LAERE; ROMBOUTS, 1997).
The use of prebiotic fibres in foods with the aim of modulating the gut microbiota is important, because they might induce either increase or decrease of the production of health compounds, which are related with the production of bacterial metabolites, growth of health promoting bacteria, decrease in intestinal pathogens, or immune modulation (AL-SHERAJI et al., 2013). FOS are not digested by the enzymes in the human intestine, and thus reach the colon untouched when ingested, where they are fermented by part of the microbiota present, liberating short chain fatty acids and gases (WANG; GIBSON, 1993).
The bacteria responsible for fermenting the FOS can be divided into three main groups: the first group is benefic, consisting of the bifidobacteria, lactobacilli and other lactic bacteria, all bacteria of positive value for human health; the second group consists of the enterobacteria and clostridia, considered to be negative to human health; and the third group consists of other bacteria denominated as neutral (MITSUOKA, 1990). Thus some pathogenic bacteria can compete with the bifidobacteria for the FOS.
Different studies using pathogens can be realized by observing the growth of these bacteria using fructooligosaccharides as substrate (HARA et al., 1994; LINKE et al., 2013; MAO et al., 2015; VAN LAERE et al., 2000). However, the use of a large number of different bacteria and fructooligosaccharides can generate a large amount of data that may complicate the interpretation of results. The multivariate statistical analysis is a group of techniques that permits the simultaneous evaluation of diverse variables, aiming to quantify the correlation between them and hence extract information invisible in the original data, making it possible to eliminate the unimportant variables (HAIR et al., 2009; LUCHESA, 2004).
Brazilian Journal of Food Research, Campo Mourão, v. 7, n. 1, p. 116-130, jan./abr. 2016. Página | 118
The principal component analysis is one of the techniques belonging to the multivariate analysis group (SHARMA, 1996). This analysis consists essentially of reducing the dimensionality of a data group constituted of a large number of interrelated variables, maintaining as much as possible of the variation of the data group (JOLLIFFE, 2002). This is done by transforming the data group into a new group of variables denominated as principal components (PC), which are not co-related and are obtained in decreasing order of maximum variance, that is, the first principal component (PC1) detains more statistical information than the second principal component (PC2) (NETO; MOITA, 1998; JOLLIFFE, 2002). The reduction in dimensionality occurs in this way, since the principal components obtained generally possess 90% or more of the information contained in a great number of variables (NETO; MOITA, 1998).
The principal component analysis is often used as an intermediate technique for reducing the size of data, which commonly uses another type of analysis simultaneously (JOLLIFFE, 2002). The Cluster analysis is one of the most frequently used analysis along with the PCA, and its basic goal discovers samples groupings within a data set, i.e., it evaluates the similarity between samples, measuring the distances between the measurement points and space, where similar samples will be close together, while different samples are far from each other (LAVINE, 2000).
Thus the objective of the present study was to apply the Principal Component Analysis and the Cluster Analysis to data obtained from experiments carried out with a large number of variables, so as to evaluate the degree of correlation between the microorganisms and carbohydrates tested and group the microorganisms according to the degree of correlation between them.
MATERIAL AND METHODS
Table 1 shows the different species of enterobacteria used by Hartemink, Van Laere and Rombouts (1997) to study the possible degradation and fermentation of commercial fructooligosaccharides, their growth rate and the final pH of the medium. The microorganisms after incubation were transferred to the following substrates: glucose, Profeed P95®, Raftilose P95® and Raftiline LS® and non-supplemented medium for comparative purposes (HARTEMINK; VAN LAERE; ROMBOUTS, 1997). The results of growth rates of the enterobacteria and the final pH values of the media supplemented with the different carbohydrates after cultivation of each of the microorganisms used in that study were submitted to multivariate analysis. Principal Components Analysis (PCA) were used in order to reduce the number of variables and identify similarities among the samples, where the results might be reduced to two principal components (PCs) denominated first principal component (PC1) and second principal component (PC2) (SHARMA, 1996; JOLLIFFE, 2002). The SAS 9.3 statistical pack was used to perform the PCA analysis (Sharma, 1996), where they obtained the data of Pearson correlation, and other data used for the preparation of correlation charts in STATISTICA 7.0 statistical pack. Finally, a cluster analysis (CA) was applied to the resulting data. A hierarchical clustering was used, with Centroid method where the similarity between two clusters is the distance between their centroids. The Cluster analysis, including the dendrograms used, was made in the statistical software SAS 9.3 according to Sharma (1996).
Brazilian Journal of Food Research, Campo Mourão, v. 7, n. 1, p. 116-130, jan./abr. 2016.
Table 1 – Different species of enterobacteria used by Hartemink, Van Laere and Rombouts (1997) to study the possible degradation and fermentation of commercial fructooligosaccharides, growth rates (Vmax, ∆O.D. h-1) of the enterobacteria and pH values after 24 hours of incubation in 1/2PY medium, supplemented with 1.0% (w/v) of different supplements*.
Supplement
Species Strain None Glucose Raftilose P95 Profeed P95 Raftiline LS
Enterobacter cloacae 27 0.159; 6.6** 0.339; 5.5 0.247; 5.7 0.262; 5.4 0.233; 6.4 E. coli 85 0.168; 6.7 0.377; 4.4 0.386; 6.0 0.407; 4.4 0.326; 6.5 E. coli 114 0.162; 6.8 0.284; 4.8 0.236; 5.4 0.229; 5.3 0.171; 6.5 E. coli 120 0.104; 6.8 0.199, 4.3 0.211; 5.8 0.203; 4.4 0.175; 6.4 E. coli 121 0.179; 6.9 0.363; 4.6 0.336; 5.8 0.329; 4.8 0.251; 6.2 E. coli 122 0.195; 6.8 0.446; 4.4 0.424; 5.6 0.453; 4.5 0.347; 6.3 E. coli 129 0.126; 6.8 0.272, 4.3 0.281; 5.8 0.281; 4.4 0.229; 6.6 E. coli 130 0.185; 6.6 0.292; 4.8 0.288; 6.0 0.287; 4.6 0.211; 6.3 E. coli 139 0.199, 6.4 0.445; 4.4 0.469; 5.5 0.458; 4.5 0.355; 6.1 E. coli 260 0.195; 6.6 0.328; 4.8 0.263; 6.2 0.276; 4.7 0.203; 6.4 E. coli 269 0.124; 6.9 0.251; 4.4 0.268; 5.5 0.265; 4.7 0.218; 6.3 E. coli 22 0.141; 6.8 0.176; 4.7 0.160; 6.3 0.161; 4.6 0.146; 6.4 E. coli 23 0.178; 6.8 0.278; 4.8 0.233; 5.9 0.259; 5.0 0.122; 6.3 E. coli 24 0.121; 6.6 0.328; 5.0 0.224; 5.9 0.293; 5.1 0.116; 6.5 Klebsiella pneumoniae 21 0.176, 6.8 0.293; 4.2 0.282; 5.2 0.292; 4.5 0.261; 5.8 Proteus vulgaris 20 0.147; 7.0 0.292; 6.0 0.289; 5.5 0.315; 5.7 0.270; 5.9 S. brandenburg 14 0.109; 6.9 0.308; 4.5 0.198; 5.4 0.230; 4.5 0.189; 6.6 S. breamy 15 0.132; 7.2 0.175; 4.7 0.173; 5.4 0.223; 4.9 0.167; 6.4 S. heidelberg 9 0.113; 6.8 0.377; 4.6 0.259; 5.6 0.276; 4.8 0.145; 6.7 S. infantis 7 0.109; 7.3 0.275; 4.7 0.227; 5.4 0.200; 5.3 0.142; 6.7 S. montevideo 16 0.164; 6.9 0.331; 4.7 0.236; 6.2 0.253; 4.6 0.197; 6.4 S. newport 19 0.102, 6.7 0.164; 4.5 0.149; 5.4 0.184; 4.8 0.134; 6.2 S. oranienburg 17 0.147; 7.2 0.324; 4.4 0.243; 5.5 0.275; 5.1 0.163; 6.7 S. typhimurium 18 0.076; 6.9 0.323; 4.4 0.173; 5.5 0.218; 4.5 0.111; 6.4 S. typhimurium 13 0.099; 7.1 0.340; 4.7 0.176; 5.4 0.238; 4.5 0.120; 6.3 Serratia liquefaciens 4 0.129; 6.8 0.203; 5.5 0.174; 6.1 0.203; 5.5 0.167; 6.5 Shigella dysenteriae 29 0.101; 6.8 0.269; 4.6 0.106; 6.2 0.126; 5.3 0.102; 6.5 Shigella flexneri 28 0.110; 6.8 0.221; 5.0 0.195; 6.1 0.225; 6.0 0.149; 6.5 Yersinia enterocolitica 25 0.105; 6.8 0.197; 4.3 0.216; 5.7 0.230; 4.4 0.204; 6.5 Yersinia enterocolitica 26 0.069; 6.7 0.141; 4.9 0.117; 5.7 0.149; 5.2 0.169; 6.2
Brazilian Journal of Food Research, Campo Mourão, v. 7, n. 1, p. 116-130, jan./abr. 2016. Página | 120
RESULTS AND DISCUSSION Growth
From the values obtained for the Pearson’s correlation coefficients shown in Table 2, it can be seen that with respect to the growth rates of the microorganisms, the largest correlation coefficients were found between Raftilose P95 and Profeed P95 (0.97), Raftiline LS and Raftilose P95 (0.86) and between Raftiline LS and Profeed P95 (0.82), where values close to 1 were found. Considering that these three substrates were constituted basically of fructooligosaccharides, this result appears to conform to the expected result of having correlation between these substrates.
Table 2 - Pearson’s correlation coefficients between the substrates for the growth rates of the bacteria
None Glucose Raftilose
P95 Profeed P95 Raftiline LS None 1.00000 Glucose 0.56447 1.00000 Raftilose P95 0.77720 0.65893 1.00000 Profeed P95 0.74541 0.66209 0.97184 1.00000 Raftiline LS 0.65630 0.52527 0.86386 0.82423 1.00000
The stronger correlation presented between Raftilose P95 (95% oligosaccharides connected by β-2,1 bonds) and Profeed P95 (95% short chain oligosaccharides) can be justified by the fact that these two substrates are constituted of fructose oligosaccharides, that is by short chain molecules with a polymerization degree of 2 to 8, and of 3 to 5, respectively. On the other hand, Raftiline LS contains oligosaccharides and polysaccharides (92%), that is, much larger molecules with a polymerization degree between 2 and 60. Thus, according to Hartemink, Van Laere and Rombouts (1997), Raftiline LS was not degraded or was degraded much slower by all the species. This way, although an increase in growth rate, there was no reduction in the pH value. It is important to observe that the formation of products which, in this case, would be responsible for the reduction in pH value, may or may not be associated with microbial growth, that is, in some cases the formation of products is less directly related with the growth process (BORZANI; LIMA; AQUARONE, 1975; CASABLANCAS; SANTÍN, 1998).
Other authors reported that bacteria with prebiotic activity had better growth rates with fructooligosaccharide than with inulin (MEULEN; AVONTS; VUYST, 2004; ROSSI et al., 2005; STEWART; TIMM; SLAVIN, 2008).
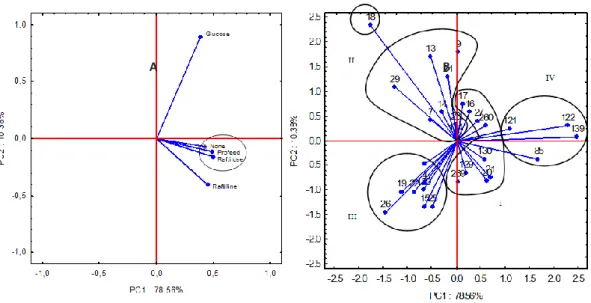
The principal components analysis resulted in two principal components: PC1 (78.56%) and PC2 (10.38%), which together represented 88.94% of the total
Brazilian Journal of Food Research, Campo Mourão, v. 7, n. 1, p. 116-130, jan./abr. 2016. Página | 121
variability of the data. Figure 1A shows the two principal components, PC1 being more related to Profeed P95 and Raftilose P95, or when additional carbohydrates were not added to the medium. On the other hand, PC2 was high for glucose and negative for the other substrates. The correlation between Profeed P95 and Raftilose P95 can be observed again, in the same way as observed for the Pearson’s correlation coefficients.
Figure 1 - Loading plot of PC1–PC2 for the substrates for the bacterial growth rates (A) and Score plot and Groups (I, II, III and IV) created by principal component analysis, taking into account the correlation observing between the microorganisms evaluated in relation to their
growth rates in media containing different supplements (B).
When the relationship between the microorganisms tested in the experiment was evaluated with respect to the values obtained for the growth rates (Figure 1B) they could be placed in four groups (I, II, III and IV), with one microorganism separate from these groups (Salmonella typhimurium E-18).
In the cluster analysis, which is shown in the dendogram (Figure 2), the formation of these groups, which were observed in the principal components analysis, was confirmed. In this dendogram hierarchical grouping has been used in order to establish similarities among the different types of bacteria, whose names of each microorganism that correspond to each number of strain is shown in Table 1. For both clusters and biplots, the smallest distances represent the greatest similarities, showing that the bacteria in the same group were strongly correlated.
Brazilian Journal of Food Research, Campo Mourão, v. 7, n. 1, p. 116-130, jan./abr. 2016. Página | 122
Figure 2 - Dendrogram of the clusters of microorganisms according to their growth rates in culture media supplemented with different carbohydrates.
In general it can be seen that the principal components analysis and the cluster analysis, allowed for the grouping of microorganisms of similar species based on their growth rates, allowing for an evaluation of the results from a different aspect. It is important to observe that a total of 13 strains of Escherichia coli, 2 strains of Yersinia enterocolitica, 9 species of the genus Salmonella and 2 of the genus Shigella were tested. In addition to these, the following 4 microorganisms were also tested: Enterobacter cloacae, Klebsiella pneumoniae, Proteus vulgaris and Serratia liquefaciens. The first group (I) included three bacterial genera in which only one species was tested: Enterobacter, Klebsiella and Proteus. In addition to correlating amongst themselves, E. coli and Salmonella species were also present. In the third group, in addition to the presence of E. coli, Salmonella and Serratia, two strains of Y. enterocolitica and two species of Shigella were also present.
It could be said there were similarities between the growth rates of bacteria from the same genus, even though some of the E. coli strains and different Salmonella species evaluated, which corresponded to a great number of microorganisms, were distributed amongst the groups, showing stronger or less strong correlations according to the strain. This result is satisfactory since it is to be expected that microorganisms from the same genus present similar behaviors due to their similar metabolisms. Nevertheless, differences exist, since each microorganism has a characteristic mean duplication time, related to its specific growth rate and the limitations of the medium (CASABLANCAS; SANTÍN, 1998).
The use of the principal components analysis as a tool to group microorganisms according to their growth rates can be clearly seen in the groups
Brazilian Journal of Food Research, Campo Mourão, v. 7, n. 1, p. 116-130, jan./abr. 2016. Página | 123
formed, starting with group IV where the bacteria showing the highest growth rates can be found. The bacteria in group I showed the second highest growth rates, followed by those in group II, with the exception of S. heidelberg E-9, whose growth rate was closer to those of group I.
It is known that FOS are compounds that are not digested by the human organism and thus arrive intact in the colon, where they are mainly degraded by the bifidobacteria present, thus favoring their development (MOLIS et al., 1996; SCHNEEMAN, 1999). These organisms are benefic since they compete with pathogenic bacteria. Hartemink, Van Laere and Rombouts (1997) showed that the enterobacteria growth in the media supplemented with FOS, although it is important to note that for the majority of the bacteria, the growth rate was lower in FOS than in glucose alone.
Eigenvectors data is an important tool to better evaluate the relationship between carbohydrates and bacteria used in the study. The eigenvectors give the weights that are used for forming the equation to compute the new variables (PC1 and PC2) (SHARMA, 1996). Therefore, the first principal component (PC1) is the most important component, because correspond to 78.56% of the total variance of data. The equation for PC1 is:
𝑃𝑟𝑖𝑛1 = 0.188×𝑛𝑜𝑛𝑒 + 0.389×𝑔𝑙𝑢𝑐𝑜𝑠𝑒 + 0.587×𝑅𝑎𝑓𝑡𝑖𝑙𝑜𝑠𝑒 𝑃95 + 0.564×𝑃𝑟𝑜𝑓𝑒𝑒𝑑 𝑃95 + 0.389×𝑅𝑎𝑓𝑡𝑖𝑙𝑖𝑛𝑒 𝐿𝑆 As can be seen, the rate growth of the enterobacteria in the presence of Raftilose P95 and Profeed P95 accounts for a substantial portion (30 and 28% respectively) of total variance. Thus, we can assume that only one principal component is the most important in order to measure the growth rate (78.56%).
The equation indicates the PC1 value though a weighted sum of the growth rate, is strongly affected by the presence of Raftilose P95 (0.587) and Profeed P95 (0.564). Thus, PC1 values suggest that E.coli 139 had the highest growth rate, and in the other hand, Shigella dysenteriae E-29 had the lowest growth rate.
Acidification
Table 3 shows the Pearson’s correlation coefficients between the final pH values after 24 hours of incubation with the microorganisms. It can be seen that the strongest correlation was found between Profeed P95 and glucose (0.75). This strong correlation could be due to the fact that a comparison of the chemical compositions of the two substrates shows that Profeed P95 is composed of one unit of glucose and two, three or four of fructose, that is, a relatively high proportion of glucose in relation to the fructose. On the other hand, Raftilose P95 only has glucose units bonds at the extremities of some chains, and Raftiline LS has glucose units linked at all the extremities but with a polymerization degree of from 2 to 60, that is, with the presence of large chains that cause a reduction in the proportion of glucose in the medium.
Brazilian Journal of Food Research, Campo Mourão, v. 7, n. 1, p. 116-130, jan./abr. 2016. Página | 124
Table 3 - Pearson’s correlation coefficients between the substrates for the final pH values after 24 hours incubation with the bacteria.
None Glucose Raftilose
P95 Profeed P95 Raftiline LS None 1.00000 Glucose -0.02571 1.00000 Raftilose P95 -0.36745 0.20706 1.00000 Profeed P95 0.14742 0.75111 0.12074 1.00000 Raftiline LS 0.24948 -0.15291 0.24219 0.06952 1.00000
From the principal components analysis (Figure 3A) of the results obtained for the pH values, it can be seen that 36.35% of the variability in the data could be explained by principal component 1 (PC1), which was characterized by a correlation between Profeed P95 and glucose, whereas the second principal component (PC2), which described 27.35% of the variability was high when the medium was not supplemented. Thus it can be seen that the behavior observed for the Pearson’s correlation coefficients was repeated in the PCA.
Figure 3 - Loading plot of PC1–PC2 for the substrates for the final pH value after 24 hours incubation with the bacteria (A) and Score plot and Groups (I, II, III, IV and V) created by principal component analysis the microorganisms studied for the final pH of the media after 24 hours of
incubation (B).
With respect to the correlation between the microorganisms for the final pH values of the media, the PCA allowed for the division of the microorganisms (Figure 3B) into 5 groups (I, II, III, IV and V) according to the correlation between them, when the microorganisms closer to each other were more strongly correlated as shown previously.
As can be seen in the dendrogram (Figure 4), the same groups could be formed with the cluster analysis. The name of each microorganism, corresponding to each number of strain is shown in Table 2.
Brazilian Journal of Food Research, Campo Mourão, v. 7, n. 1, p. 116-130, jan./abr. 2016. Página | 125
Differently to that observed for the growth rates, various microorganisms of the same genus and/or species presented poor correlation. This difference could be due to the fact mentioned previously, that the formation of products by some of the microorganisms was not associated with cell growth (BORZANI; LIMA; AQUARONE, 1975;
Figure 4 - Dendrogram of the clusters of microorganisms according to the final pH value of the media after 24 hours of incubation with the different supplements added.
CASABLANCAS; SANTÍN, 1998). According to Borzani, Lima and Aquarone (1975), there are cases showing microbial growth during the first 24 hours, with rapid assimilation of the carbon source, followed by a period showing little growth but a high production of metabolites.
Rossi et al. (2005) in their studies with fermentation of fructooligosaccharides and inulin by bifidobacteria, noted that there was no correlation among species, the origin and the ability to ferment inulin. Moreover, they observed that the length of the carbohydrate chain influences the physiological responses. Through principal component analysis, it was observed that there was no strong correlation between enterobacteria species in the fermentation of carbohydrates tested.
Brazilian Journal of Food Research, Campo Mourão, v. 7, n. 1, p. 116-130, jan./abr. 2016. Página | 126
CONCLUSION
The use of only the pH value to judge fermentation is not recommended, and the quantification of the substrates added and/or formation of products after a period of incubation is also important in order to observe substrate consumption and/or metabolite production.
Nevertheless the principal component analysis was useful to separate the microorganisms according to their similarities in reducing the pH value of each different substrate. Thus the efficiency of this tool in grouping correlated microorganisms for the two variables tested (pH value and growth rate) was observed.
Brazilian Journal of Food Research, Campo Mourão, v. 7, n. 1, p. 116-130, jan./abr. 2016. Página | 127
ACKNOWLEDGMENTS
This work was supported by the Brazilian agencies CNPq, CAPES and FAPERGS.
REFERENCES
AL-SHERAJI, S.H.; ISMAIL, A.; MANAP, M.Y.; MUSTAFA, S.; YUSOF, R.M.; HASSAN, F.A. Prebiotics as functional foods: A review. Journal of Functional Foods, v. 5, n. 4, p. 1542–1553, 2013.
BORZANI, W.; LIMA, U.A.; AQUARONE, E. Engenharia Bioquímica, v.3. Edgar Blucher, São Paulo, Brasil, 1975.
CASABLANCAS, F.G.; SANTÍN, J.L. Cinética Microbiana. In: Casablancas FG, Santín JL (eds). Ingeniería Bioquímica, Sintesis, p. 79-101, 1998.
CASTRO, A.; CÉSPEDES, G.; CARBALLO, S.; BERGENSTAHL, B.; TORNBERG, E. Dietary fiber, fructooligosaccharides, and physicochemical properties of homogenized aqueous suspensions of yacon (Smallanthus sonchifolius). Food Research International, v. 50, n. 1, p. 392-400, 2013.
DREVON, T.; BORNET, F. Les FOS: Actilight. In: MULTON, J.L. (eds). Le sucre, les sucres, les edulcorants et les glucides de charges dans les IAA, Tec & Doc, p. 313-338, 1992.
GIBSON, G.R.; ROBERFROID, M. Dietary modulation of the human colonic microbiota: introducing the concept of prebiotics. Journal of Nutrition, v. 125, n. 6, p. 237-243, 1995.
HAIR, J.F.; BLACK, W.C.; BABIN, B.J.; ANDERSON, R.E.; TATHAM, R.L. Análise multivariada de dados. 6.ed. Porto Alegre, Bookman, 2009.
HARA, H.; LI, S.T.; SASAKI, M.; MARUYAMA, T.; TERADA, A.; OGATA, Y.; FUJITA, K.; ISHIGAMI, H.; HARA, K.; FUJIMORI, K.; MITSUOKA, T. Effective Dose of
Lactosucrose on Fecal Flora and Fecal Metabolites of Humans. Bifidobacteria Microflora, v. 13, n. 2, p. 51-63, 1994.
HARTEMINK, R.; VAN LAERE, K.M.J.; ROMBOUTS, F.M. Growth of enterobacteria on fructo-oligosaccharides. Journal of Applied Microbiology, v. 83, n. 3, p. 367-374, 1997.
Brazilian Journal of Food Research, Campo Mourão, v. 7, n. 1, p. 116-130, jan./abr. 2016. Página | 128
HENDRY, G.A.F.; WALLACE, R.K. The origin, distribution and evolutionary significance of fructans. In: SUZUKI, M.; CHATTERTON, J.N. (eds.). Science and Technology of fructan, CRC Press, p. 119-139, 1993.
JOLLIFFE, I.T. Principal Component Analysis, Springer, 2002.
KUMAR, V.P.; PRASHANTH, K.V.H.; VENKATESH, Y.P. Structural analyses and immunomodulatory properties of fructo-oligosaccharides from onion (Allium cepa). Carbohydrate Polymers, v. 117, n. 6, p. 115-122, 2015.
LAVINE, B.K. Clustering and classification of analytical data. In: MEYERS, R.A. (Ed.). Encyclopedia of analytical chemistry, John Wiley & Sons Ltd, p. 9689-9710, 2000.
LINKE, C.M.; WOODIGA, S.A.; MEYERS, D.J.; BUCKWALTER, C.M.; SALHI, H.E.; KING, S.J. The ABC transporter encoded at the pneumococcal
fructooligosaccharide utilization locus determines the ability to utilize long- and short-chain fructooligosaccharides. Journal of Bacteriology, v. 195, n. 5, p. 1031-1041, 2013.
LUCHESA, C.J. Estudo da adequação dos índices da análise econômico-financeira às empresas florestais, utilizando métodos estatísticos multivariados. 2004. 163p. Tese (Doutorado em Economia e Política Florestal) - Engenharia Florestal,
Universidade Federal do Paraná, Curitiba, Brasil, 2004.
MAO, B.; LI, D.; ZHAO, J.; LIU, X.; GU. Z.; CHEN, Y. Q.; ZHANG, H.; CHEN, W. In vitro fermentation of fructooligosaccharides with human gut bacteria. Food &
Function, v. 6, p. 947-954, 2015.
MEULEN, R.V.D.; AVONTS, L.; VUYST, L.D. Short Fractions of Oligofructose Are Preferentially Metabolized by Bifidobacterium animalis DN-173 010. Applied and Environmental Microbiology, v. 70, n. 4, p. 1923-1930, 2004.
MEYER, D., BAYARRI, S.; TÁRREGA, A.; COSTELL, E. Inulin as texture modifier in dairy products. Food Hydrocolloid, v. 25, n. 8, p. 1881-1890, 2011.
MITSUOKA, T. Bifidobacteria and their role in human health. Journal of Industrial Microbiology and Biotechnology, v. 6, n.4, p. 263–267, 1990.
MOLIS, C.; FLOURIÉ, B.; OUARNE, F.; GAILING, M.F.; LARTIGUE, S.; GUIBERT, A.; et al. Digestion, excretion, and energy value of fructoligosaccharides in healthy humans. American Journal of Clinical Nutrition, v. 64, n. 3, p. 324-328, 1996.
Brazilian Journal of Food Research, Campo Mourão, v. 7, n. 1, p. 116-130, jan./abr. 2016. Página | 129
NETO, J.M.M.; MOITA, G.C. Uma introdução à análise exploratória de dados multivariados. Química Nova. v. 21, n. 4, p. 467-469, 1998.
POLLOCK, C.J.; CAIRNS, A.J.; SIMS, I.M.; HOUSLEY, T.L. Fructans as Reserve Carbohydrates in Crop Plants. In: ZAMSKI, E.; SHAFFER, A.A. (eds).
Photoassimilate Distribuition in Plants and Crops: Source – Sink Relationships, Marcel Dekker, p. 97-113, 1996.
ROSSI, M.; CORRADINI, C.; AMARETTI, A.; NICOLINI, M.; POMPEI, A.; ZANONI, S.; et al. Fermentation of Fructooligosaccharides and Inulin by Bifidobacteria: a Comparative Study of Pure and Fecal Cultures. Applied and Environmental Microbiology, v. 71, n. 10, p. 6150-6158, 2005.
SCHNEEMAN, B.O. Fiber, Inulin and Oligofructose: Similarities and Differences. Journal of Nutrition, v. 129, n. 7, p. 1424S-1427S, 1999.
SHARMA, S. Applied multivariate techniques, Wiley & Sons, 1996.
SMITH, C.J. Carbohydrate chemistry. In: LEA, P.J.; LEE, G.R.C. (eds). Plant biochemistry and molecular biology, Wiley & Sons, p. 74-111, 1993.
STEWART, M.L.; TIMM, D.A.; SLAVIN, J.L. Fructooligosaccharides exhibit more rapid fermentation than long-chain inulin in an in vitro fermentation system. Nutrition Research, v. 28, n. 5, p. 329-334, 2008.
TÁRREGA, A.; ROCAFULL, A.; COSTELL, E. Effect of blends of short and long-chain inulin on the rheological and sensory properties of prebiotic low-fat custards. LWT - Food Science and Technology, v. 43, n. 3, p. 556-562, 2010.
VAN LAERE, K.M.J.; HARTEMINK, R.; BOSVELD, M.; SCHOLS, H.A.; VORAGEN, A.G.J. Fermentation of plant cell wall derived polysaccharides and their
corresponding oligosaccharides by intestinal bacteria. Journal of Agricultural and Food Chemistry v. 48, p. 1644-1652, 2000.
VILLEGAS, B.; COSTELL, E. Flow behaviour of inulin–milk beverages. Influence of inulin average chain length and of milk fat content. International Dairy Journal, v. 17, n. 7, p. 776-781, 2007.
WANG, X.; GIBSON, G.R. Effects of the in vitro fermentation of oligofructose and inulin by bacteria growing in the human large intestine. Journal of Applied
Brazilian Journal of Food Research, Campo Mourão, v. 7, n. 1, p. 116-130, jan./abr. 2016. Página | 130 Recebido: 29 jan. 2015. Aprovado: 26 fev. 2016. DOI: 10.14685/rebrapa.v7n1.3519 Como citar:
KUCK, L. S.; NOREÑA, C. Z. Evaluation of the growth of enterobacteria in fructooligosaccharides using the principal components analysis. Brazilian Journal of Food Research, Campo Mourão, v. 7, n.1, p. 116-130, jan./abr. 2016. Disponível em: <https://periodicos.utfpr.edu.br/rebrapa>
Correspondência: Luiza Siede Kuck
Instituto de Ciência e Tecnologia de Alimentos, Universidade Federal do Rio Grande do Sul, Porto Alegre-RS, Brasil.
Direito autoral: Este artigo está licenciado sob os termos da Licença Creative Commons-Atribuição 4.0