Revista Brasileira de Meteorologia, v.27, n.4, 388 - 394, 2012
APPLICATION OF STATISTICAL CORRECTION IN EXTENDED WEATHER FORECASTING
IN THE SOUTHERN REGION OF BRAZIL
ANA MARIA HEUMINSKI DE AVILA
1, ANDREA DE OLIVEIRA CARDOSO
21
Universidade Estadual de Campinas (UNICAMP), Campinas, SP, Brazil
2
Centro de Engenharia, Modelagem e Ciências Sociais Aplicadas, Universidade Federal Do ABC (CECS/
UFABC), Santo André, SP, Brazil
[email protected], [email protected]
Received May 2010 - Accepted April 2012
ABSTRACT
Adverse weather conditions in critical periods of vegetative plant growth affect crop productivity, being a fundamental parameter for yield forecast. An increase in weather forecasting accuracy may be obtained by applying statistical correction to remove model bias. This study used statistical correction of ensemble forecasting with the atmospheric general circulation model (Center for Weather Forecasting and Climate Studies/Center for Ocean–Land–Atmosphere Studies - CPTEC/COLA) by mean error removal for three cities in the South of Brazil. Comparisons were made between corrected and original precipitation forecasts, and between these and data observed at their respective meteorological stations. Results showed that the applied statistical correction method may improve forecasting performance in some situations and that the term of forecast present high accuracy, indicating the importance of ensemble forecasting as an auxiliary tool in agricultural crop monitoring.
Keywords: agricultural monitoring, accuracy of meteorological models, weather forecast, plant growth
RESUMO: APLICAÇÃO DE CORRELAÇÕES ESTATÍSTICAS NAS PREVISÕES DE TEMPO ESTENDIDAS NA REGIÃO SUDESTE DO BRASIL
As condições adversas do tempo, nos períodos críticos do desenvolvimento vegetativo da planta
inluenciam o rendimento da cultura, sendo um parâmetro fundamental para a previsão da safra. Um aumento na acurácea da previsão pode ser obtido ao se aplicar correções estatísticas para remover o erro
sistemático do modelo. Neste trabalho foram realizadas correções estatísticas nas previsões de tempo
por conjunto do modelo de circulação geral atmosférico (MGCA) CPTEC/COLA (Centro de Previsão
de Tempo e Estudos Climáticos/Center for Ocean–Land–Atmosphere Studies), através da remoção do
erro médio, para três localidades do Sul do Brasil. As previsões de precipitação obtidas pelo modelo sem correção foram comparadas com as previsões corrigidas e ambas com os dados observados nas respectivas estações meteorológicas. Os resultados mostraram que a correção estatística pode melhorar
o desempenho do modelo em algumas situações, sendo que ambos os resultados do modelo corrigido
e sem correção apresentam uma alta acerácea, indicando que o modelo de previsão de tempo por
conjunto pode apresentar-se como uma ferramenta auxiliar para o monitoramento das safras agrícolas. Palavras-chave: monitoramento agrícola, acerácea dos modelos meteorológicos
1. INTRODUCTION
Brazil is one of the largest global grain producers and the largest worldwide coffee producer, with an average between 30 and 40 million tons a year; the second largest soybean producer, surpassed only by the United States, and the third largest corn producer (FAO, 2009). Except for coffee, the above mentioned cultures have their main phenological cycle
at the end of spring and the beginning of summer, when there is greater atmospheric evaporative demand and, consequently, greater precipitation needs. However, it is necessary for it to be well distributed in time and space to achieve good productivity. Excessive precipitation, mainly at harvest time, may negatively impact grain quantity and quality. In the current
globalized agriculture, increased proits and reduced costs and
while concomitantly aiming at environmental sustainability of agribusiness.
Expressive advancement has been obtained in the determination of the areas indicated for agricultural development, by means of the agricultural zoning program implemented by the Ministry of Agriculture (Rossetti, 2001). However, once the culture is established, crop monitoring is fundamental. One of
the main dificulties faced by decision makers is how to obtain
weather forecasts with reasonable reliability, with the largest possible number of days prior to the occurrence of the event, as well as information about where it is going to happen. The ensemble forecast may present an alternative to increase the predictability of numerical weather forecast models (Coutinho, 1999).
This technique is based on the premise that small disturbances in the initial atmospheric state may produce completely different results in the future (Lorenz, 1963). Ideally, an unlimited number of initial conditions would be necessary to represent all of the possible atmospheric states; however, this would be unfeasible, since for each initial condition there would be a corresponding round of the model. As the error growth rate depends on the atmospheric circulation regime, on the season of the year and on the geographic domain, it is possible to build a limited number of “optimal” disturbances that represent the faster growth modes associated with the atmospheric patterns of the initial condition.
Previous studies indicate that the average ensemble performance may be superior to situations in which individual elements are used (Mendonça and Bonatti, 2004). The uncertainty or reliability of a forecast is assessed according to
ensemble forecast spread, deined as the standard deviation of
forecasts in relation to ensemble average. In regions where there is less spread, higher reliability is attributed to the forecast, while lower reliability is attributed in regions where the members are distant (Buizza, 1997). According to Marengo et al. (2003), some Brazilian regions present higher predictability than others. Such is the case of the South Region, of the northern part of the Northeast and of the eastern part of the Amazon. The remaining regions have predictability between low and moderate.
Cardoso et al. (2010) explored the role of extended period weather forecasts for estimating soybean productivity in the southern part of Brazil, Passo Fundo and Londrina (State of Rio Grande do Sul and Paraná, respectively) in the 2005/2006 harvest. This study showed that the use of accurate meteorological forecasts can be useful to improve the productivity prediction and consequently contribute to agricultural planning. According to the results the use of up to 15 day meteorological forecasts lead to more reliable crop productivity estimates than those generated using only climatology information.
Avila et al. (2007) evaluated the ensemble weather forecast performance developed by CPTEC for Toledo and Londrina cities, Paraná state, focusing on the importance
of extended weather forecasting for deinition of the date to
begin soybean planting (2005/2006 harvest). Data from the atmospheric general circulation model were utilized (MCGA) and daily precipitation data observed in the two pluviometric stations of the respective cities, as well as data on the evolution of soybean sowing, as percentage of cultivated area, were supplied by DERAL (Department of Rural Economy). Results point out that the model was sensitive to rain events, within at least a four-day period, highlighting the importance of improving the performance of the model for longer forecasting times.
An alternative for the improvement of quality in numeric weather forecasts it to apply statistical correction methods to remove the systematic error of the model, so as to improve its performance (Chen et al., 2000). This study shares this context. In order to achieve this, three locations were studied with regard to the 2005/2006 harvest in the municipalities of Passo Fundo (State of Rio Grande do Sul - RS), Cascavel and Londrina (both, State of Paraná- PR), being studied the performance of the model with and without statistical correction.
2. MATERIAL AND METHODS
The studied municipalities are located in southern Brazil, presenting humid subtropical local climate (Cfa) according to
the Koppen´s classiication. Passo Fundo (28.23ºS; 52.31ºW) is
a municipality of Rio Grande do Sul State, Londrina (23.33oS; 51.13oW) and Cascavel (24.96oS; 53.04oW) are municipalities of Paraná State.
Were utilized weather forecast and observed data in Passo Fundo/RS, Londrina/PR and Cascavel/PR from October 15, 2005 to March 7, 2006. Daily precipitation forecasts from the nearest point of the weather station were obtained by means of the global numerical model used for the ensemble weather forecast in CPTEC. This atmospheric general circulation model (AGCM) derived from the model used for weather forecast by the National Center for Environmental Prediction in 1985 and adapted by (Bonatti, 1996).
390 Ana Maria Heuminski de Avila e Andrea de Oliveira Cardoso Volume 27(4)
averaging all forecast members, that is, the ensemble mean calculation. In this case, it is considered that all members are equally likely to take place. It was considered a rain event when values were above 10mm, which is regarded as a limit value used in agriculture.
The correction method applied to weather forecasts by removal of mean error (bias) is based on mean error estimation
veriied in the most recent forecasts (Wilks, 2006) in order to
choose this method, the fact that models may present variations in error trends, depending on the forecasting period, was taken into consideration, and also that such variations, which are short
term, may be identiied through mean error calculation of the
most recent forecasts.
To apply this correction method, several combinations of mean error calculation periods were investigated with the objective of identifying a solution that reaches the best forecasting performance. The period of the last 15 forecasting days was tested. The criterion considered for correction application is based on the relationship (RB, Equation 1) between the absolute bias value and the mean error absolute deviation value in relation to bias. Correction was applied only in cases where RB presented a value greater than 1 and for the bias calculated in the base period that presented the greater RB value. With the application of this criterion, it is possible to correct cases in which the error is really systematic, avoiding forecast degradation; it is also possible to correct different regions in a distinct manner, since the base period for bias calculation may vary according to the region and the type of meteorological system that the model is over or underestimating.
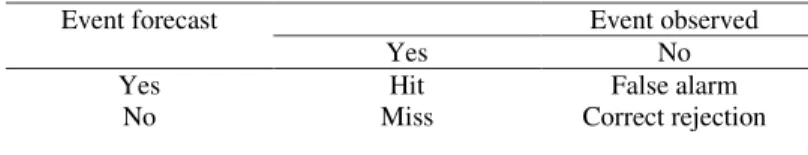
being P the forecast variable and O the observed variable. To evaluate forecasting performance, bias, hit rate (HR) and false alarm rate (FAR) were assessed from the quantities of hits, failures, false alarms and correct rejections between the precipitation estimated by the corrected and not corrected model, as well as the precipitation observed at meteorological stations. This scheme can be represented in Table 1 by a (2x2) contingency table of forecasts and observations for the whole period.
The quantity of hits is given by the number of times the model predicted rainfall equal or above 10 mm and rainfall equal to or above 10mm actually occurred. The quantity of miss
is given by the number of times the model predicted rainfall equal to or below 10 mm, but rainfall above 10mm occurred. The quantity of false alarms refers to the number of times the model predicted rainfall above 10 mm and rainfall below 10mm occurred. In a hypothesis test the false alarm correspond in error Type I, rejected the null hypothesis or false positive, when the model predicts and the event does not occur (Wise, 2012).
The quantity of correct rejections refers to the number of times the model predicted rainfall below 10 mm and rainfall equal to or below 10 mm occurred. The hit (probability of precipitation detection – HR) and false alarm (percentage of events considered as precipitation above 10mm - FAR) rates
are deined as (Mason, 1982; Jolliffe and Stephenson, 2003).
These rates have values that vary between 0 and 1, with 1 being the best value for the hit rate and 0 for the false alarm rate.
The relative operating characteristic (ROC) is a measure of the quality of probability forecasts that relates the hit rate to the corresponding false-alarm rate. The (ROC) is a representation of the skill of a forecasting system in which the hit rate and the false-alarm rate are compared (Swets, 1973). The ROC is a graph of the hit rate (Y – axis) against false alarm rate (X – axis) for different decision threshold. The ROC score d is
deined as the area under the ROC curve (Mason, 1982; Jolliffe
and Stephenson, 2003; Kharin and Zweiers, 2003). d = z(FAR) – z(HR)
FAR and HR are the False Alarm and Hit rates, respectively, that correspond to right-tail probabilities on the normal distribution. Thus, z(FA) and z(H) are the z scores that correspond to these right-tail p-values represented by FA and H (Wise, 2012).
The possible range of d is (-∞,+∞), but the range encountered in weather forecasts is generally from 0 to 4 (Jolliffe and
Stephenson, 2003). Zero skill is indicated when d was zero and very high level of skill was detected when d was greater than 3.
3. RESULTS
For each of the three locations studied, comparisons of the forecasts precipitation by the model were carried out |; | 1 ); ( 1
BIAS=
− =
− − =DBIAS BIAS RB BIAS O P n DBIAS O P n (1)
Event forecast Event observed
Yes No
Yes Hit False alarm
No Miss Correct rejection
Table 1 - Schematic contingency table for categorical forecasts of a binary event.
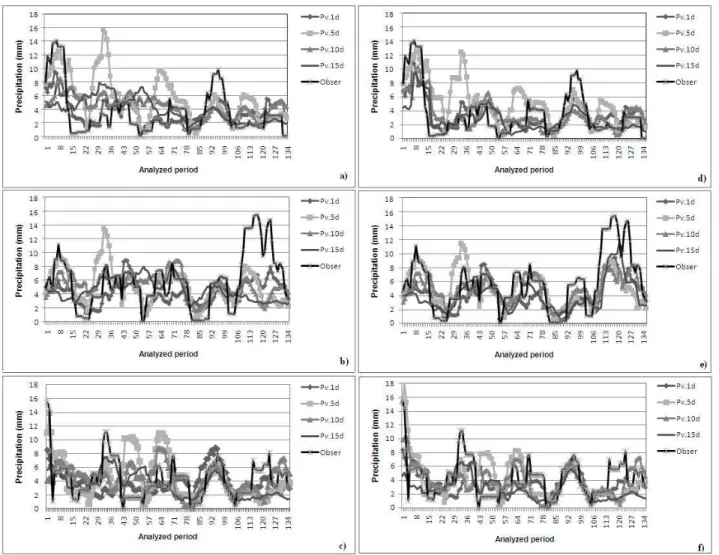
(with and without correction) with precipitation measured in the respective meteorological stations. Figures 1 and 2 show the 10 days moving averages for the forecast periods of 1 day (1dFc), 5 days (5dFc), 10 days (10dFc) and 15 days (15dFc), together with the observed precipitation (Figure 1). The study was carried out with all of the forecasting periods, although the reason these periods were chosen was the fact that it would be practically unfeasible to show all of them in a graphic form; therefore, it was considered that the results shown represent the general behavior of forecasts. The choice of such locations had the purpose of presenting a general scenario of forecasting performance in two important agricultural regions in the South of the country.
It can be noted in Figure 1 that the moving average, which is the moving mean calculated by the data on precipitation predicted by the ensemble mean (1d, 5d, 10d and 15d,
respectively), follows the moving average values calculated by the observed precipitation; however, the values are not very close, which indicates that the atmospheric model used in these simulations presents a somewhat high mean systematic error,
conirmed by the bias values.
One of the possibilities for this difference between the data predicted by the model and those observed in meteorological stations may be associated with the geographic location of the stations in relation to the central pixel point of the model. This is
a limitation in terms of veriication of the hit rate when assessing model dexterity for speciic points, since model resolution is
close to 100 km. In addition, as precipitation is a meteorological variable with high temporal and spatial variability, it can easily occur at places out of reach of the model grid.
The model does not follow extreme precipitation values very accurately and tends to underestimate it, which is
392 Ana Maria Heuminski de Avila e Andrea de Oliveira Cardoso Volume 27(4)
conirmed by the relatively low values of the forecast hit rate.
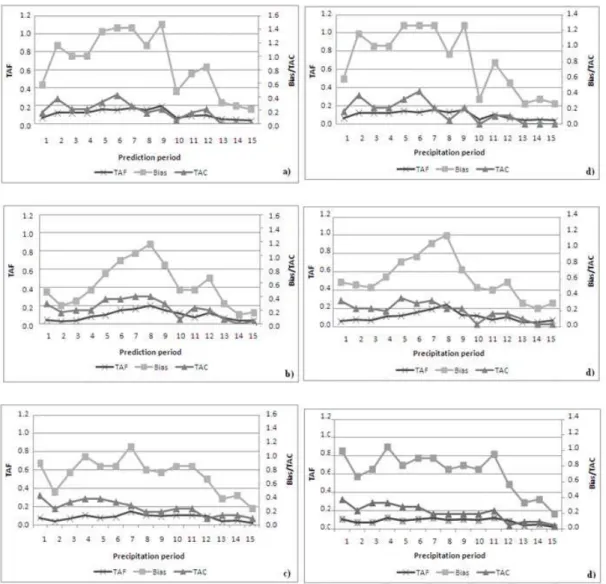
On the other hand, the false alarm rates are not very high, in the cases of precipitation events above 10 mm, which are important
to agriculture. This feature is conirmed by high correct negative
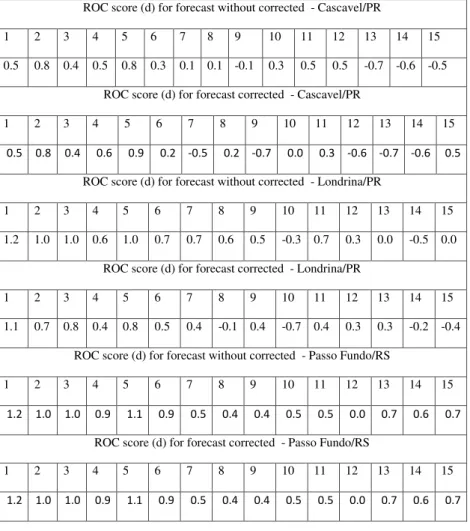
rate, ie, low values of TAF as shown in Figure 2. Such results are interesting for agricultural monitoring, as ensemble weather forecast has a longer period for activity planning. The results presented in Table 2 show the ROC score near or less than 1. This value can be associated with the not very high false alarm although the model doesn´t have a high hit rate. This is a important result because in this case we can avoid to commit a false positive, error type 1.
The main CPTEC ensemble model skill for precipitation forecast in the Passo Fundo, Londrina and Cascavel may be associated with a false alarm rate that has a small reduction as the lead time forecast. Results of forecasts validation product
of the CPTEC numerical models conirm the differences in
the ensemble model skill for the studied regions, highlighting that the model has a greater accuracy to forecast less intense precipitation events. This feature occurs because the model has a higher false alarm rate for small extreme events (CPTEC, 2009).
Figure 2 shows the results obtained for the corrected model. Comparing the hit rates, false alarm rates and bias between the corrected and not corrected model, it can be observed that there were better forecasting results only for the city of Cascavel. The accuracy values were higher up to the eleventh forecasting day, which shows that the model remained more stable, increasing the quality of the forecast. The bias
conirms this, presenting smaller values on the same forecasting
days and extending the quality of the forecast for a longer period. There was no improvement in the corrected model results for the stations of Passo Fundo and Londrina.
The differences in the model skill to Londrina and Cascavel cities, both of Paraná State, are possibly due to different climates pattern of precipitation. Londrina present a pattern with seasonality more pronounced, with rainfall more intense during summer and reduced in the winter, similar to south part of the Southeast. In contrast, the rainfall regime is regular throughout the year, in the case of Cascavel. These differences are due to factors that affect the climate in the region. As Cascavel is located most south is mainly affected by system transients that pass through southern Brazil. Already Londrina,
besides being affected by transients is inluenced by moisture
convergence in the Amazon that favors the summer rain. The model skill varies to estimate these different factors.
The results shown in this study do not indicate improvement in the performance of the forecast model extended to two (Londrina and Passo Fundo) of the three cities studied. These two stations have a greater number of precipitation events greater than 10 mm, which are often underestimated. Perhaps other methods of correction that takes into account
the threshold for extremes can be more eficient. Cardoso et al.
(2006) and Silva et al. (2006) have not studied the same points nor the same variables, the authors found better performance when correction was applied to the forecasts. On the other hand, Chen et al. (2000) found the best results for the mean and high level variables of the atmosphere, in practically all of the forecasting periods. In the case of the low level variables, the best results occurred for the shortest forecasting periods.
4. CONCLUSIONS
This study presents extended weather forecast using the global model of CPTEC/INPE for the precipitation forecast. A statistical correction method was applied, based on bias removal, with the purpose of reducing systematic errors in the forecasts.
The results show that the precipitation predicted by the model, when compared with the precipitation observed at the respective meteorological stations, presents a similar behavior; although the model shows a trend to underestimate the maximum precipitation values, it almost never predicts rainfall when it actually does not occur.
ROC score (d) for forecast without corrected - Cascavel/PR
1 2 3 4 5 6 7 8 9 10 11 12 13 14 15
0.5 0.8 0.4 0.5 0.8 0.3 0.1 0.1 -0.1 0.3 0.5 0.5 -0.7 -0.6 -0.5
ROC score (d) for forecast corrected - Cascavel/PR
1 2 3 4 5 6 7 8 9 10 11 12 13 14 15
0.5 0.8 0.4 0.6 0.9 0.2 -0.5 0.2 -0.7 0.0 0.3 -0.6 -0.7 -0.6 0.5
ROC score (d) for forecast without corrected - Londrina/PR
1 2 3 4 5 6 7 8 9 10 11 12 13 14 15
1.2 1.0 1.0 0.6 1.0 0.7 0.7 0.6 0.5 -0.3 0.7 0.3 0.0 -0.5 0.0
ROC score (d) for forecast corrected - Londrina/PR
1 2 3 4 5 6 7 8 9 10 11 12 13 14 15
1.1 0.7 0.8 0.4 0.8 0.5 0.4 -0.1 0.4 -0.7 0.4 0.3 0.3 -0.2 -0.4
ROC score (d) for forecast without corrected - Passo Fundo/RS
1 2 3 4 5 6 7 8 9 10 11 12 13 14 15
1.2 1.0 1.0 0.9 1.1 0.9 0.5 0.4 0.4 0.5 0.5 0.0 0.7 0.6 0.7
ROC score (d) for forecast corrected - Passo Fundo/RS
1 2 3 4 5 6 7 8 9 10 11 12 13 14 15
1.2 1.0 1.0 0.9 1.1 0.9 0.5 0.4 0.4 0.5 0.5 0.0 0.7 0.6 0.7
394 Ana Maria Heuminski de Avila e Andrea de Oliveira Cardoso Volume 27(4)
The corrected model showed a better performance only for the meteorological station of Cascavel-PR, which means that the correction method may improve the result of forecasts, making it more stable in some situations. The extended weather forecast may be used as an auxiliary tool in agricultural monitoring, since it has a longer forecasting period and favors the planning of activities.
5. REFERENCES
AVILA A. M. H; CARDOSO A. O.; PINTO H. S. Utilização da previsão de tempo estendida, como uma ferramenta auxiliar,
na escolha da data de plantio em Londrina e Toledo, PR. In: Congresso Brasileiro de Agrometeorologia, XV, 2007, Aracaju, Anais.
BONATTI J. P. Modelo de Circulação Geral Atmosférico do CPTEC. Climanálise Especial, Edição Comemorativa de
10 anos. http:// climanalise.cptec.inpe.br/~rclimanl/boletim/ cliesp10a/index1.shtml. Accessed 05 March 2009.
BUIZZA R. Potential forecast skill of ensemble prediction and spread and skill distributions of the ECMWF ensemble prediction system. Monthly Weather Review, 1997, v.125, p. 99-119, 1997.
CARDOSO A. O.; PINTO H. S.; SILVA DIAS P. L.; ÁVILA A. M. H.; MARIN F. R.; PILAU F. Extended time weather forecasts contributes to agricultural productivity estimates. Theoretical and Applied Climatology, 2010, v.102, n.3-4, p.343-350, 2010.
CARDOSO A. O.; MENDONÇA A.M.,; ARAVÉQUIA J.A.; BONATTI J.P.; SILVA DIAS P.L. Correção estatística
das previsões de tempo por conjunto do MGCA/COLA
através da remoção do Viés. In: Congresso Brasileiro de
Meteorologia, Sociedade Brasileira de Meteorologia, XIV, Florianópolis, 2006, Anais.
CPTEC Centro de Previsão de Tempo e Estudos Climáticos. Avaliação dos Modelos http://avaliacaodemodelos.cptec.
inpe.br. 2009. Accessed 11 Jan 2012.
CHEN D.; CANE M. A.; ZEBIAK S. E.; CANIZARES R.; KAPLAN A. Bias correction of an ocean-atmosphere coupled model. Geophysical Research Letters, v. 27, n.16, p.2585-2588, 2000.
COUTINHO M. M. Previsão por conjunto utilizando perturbações baseadas em componentes principais.
1999. 136f. Dissertação de Mestrado. Instituto Nacional de Pesquisas Espaciais. São José dos Campos.
FAO Food and Agriculture Organization of the United Nations. Statistical databases: Faostat: agriculture, 2009. http://www.
fao.org. Accessed 10 January 2011.
JOLLIFFE I. T.; STEPHENSON D. B. Forecast Veriication: A Practitioner´s Guide in Atmospheric Science. 2003. 240p. KHARIN V. V.; ZWIERS F. W. On the ROC Score of Probability Forecasts. Journal of Climate, v. 16, p.4145- 4150, 2003. LORENZ E. N. Deterministic non-periodic flow. Journal
Atmospheric. Science v. 20, p. 130-141, 1963.
MARENGO J. A.; CAVALCANTI I. F. A.; SATYAMURTY P.; TROSNIKOV I.; NOBRE C. A.; BONATI J. P.; CAMARGO
H.; SAMPAIO G.; SANCHES M.; MANZI A. O.; CASTRO C. A. C, D’ALMEIDA C.; PEZZI L. P.; CANDIDO L. Assessment of regional seasonal rainfall predictability using the CPTEC/COLA atmospheric GCM. Climate Dynamics, v. 21, p.459–475, 2003.
MASON I. A model for assessment of weather forecasts. Australian Meteorological Magazine, v.30, p. 291-303, 1982.
MENDONÇA A. M.; BONATTI J. P. Avaliação Objetiva do Sistema de Previsão de Tempo Global por Ensemble do CPTEC e Relação entre o Espalhamento e o Desempenho do
Ensemble Médio. In: Congresso Brasileiro de Meteorologia, XIII, Fortaleza. 2004. Anais.
ROSSETTI L. A. Zoneamento Agrícola em aplicações de crédito e securidade rural no Brasil: aspectos atuariais e de política agrícola. Revista Brasileira de Agrometeorologia, n.9 (No Especial: Zoneamento Agrícola), p.386-399, 2001.
SILVA M. C. L.; MENDONÇA A. M.; BONATTI J. P.; SILVA DIAS M. A. F. Previsão de Temperaturas Mínimas para o Centro-Sul do Brasil Utilizando a Previsão de Tempo por
Ensemble do CPTEC. In: XIV Congresso Brasileiro de Meteorologia, Sociedade Brasileira de Meteorologia. 2006. Florianopolis. Anais.
WISE. Sinal Detection Theory Tutorial. http://wise.cgu.edu/
sdtmod/vocab.asp. Accessed 11 Jan 2012.
SWETS J. A. The relative operating characteristic in psychology.
Science, v.182, p.990–1000, 1973.