American J. of Engineering and Applied Sciences 2 (4): 796-803, 2009 ISSN 1941-7020
© 2009 Science Publications
Corresponding Author: Monzur Imteaz, Faculty of Engineering and Industrial Sciences, Swinburne University of Technology, Hawthorn, Melbourne, VIC 3122, Australia
Improved Continuing Losses Estimation Using Initial Loss-Continuing
Loss Model for Medium Sized Rural Catchments
Mahbub Ilahee and Monzur Alam Imteaz
Faculty of Engineering and Industrial Sciences,
Swinburne University of Technology, Hawthorn, Melbourne, VIC 3122, Australia
Abstract: Problem statement: The rainfall based design flood estimation techniques are commonly adopted in hydrological design and require a number of inputs including information on soil loss characteristics. Approach: A conceptual loss model known as the ‘Initial Loss-Continuing Loss (IL-CL) model’ is widely used in Australia. Results: The Initial Loss (IL) occurs at the beginning of the rainfall event, prior to the commencement of surface runoff and the Continuing Loss (CL) is the average rate of loss throughout the remainder of the storm. The currently recommended design loss values depicted in “Australian Rainfall and Runoff Vol. 1” for Queensland (Australia) has some basic limitations. This study investigated how more accurate CL values can be estimated and derived for medium sized tropical Queensland catchments using long term rainfall and streamflow data. Accuracy in CL estimation has got significant implications in the estimation of design floods. Conclusion/Recommendations: The results showed that CL value is not fixed and constant through out the duration of the storm but the CL value decays with the duration of the storm.
Key words: Initial loss, continuing loss, rural catchments, flood estimation, rainfall-runoff modeling
PROBLEM STATEMENT
Flood estimation is often required in hydrologic design and has important economic significance[2]. Flood estimation and risk analysis in Australia involves an annual spending of the order of $650 million[4]. Rainfall-based flood estimation techniques are most commonly adopted and often require several inputs/parameters to convert design rainfalls to design floods[6,8]. Of the many inputs/parameters, the concept “loss” is an important parameter. Loss is the amount of precipitation that does not appear as direct runoff. Factors pertaining to loss in effect reduce the runoff during a flood event[2,7].
In design flood estimation, simplified lumped conceptual loss models are commonly used because of their simplicity and ability to approximate catchment runoff behavior. Secondly, the detailed parameters needed for calculating individual loss components are generally not available. This is particularly true for design loss which is probabilistic in nature and for which complicated theoretical models may not be required. The common loss factors include rainfall intercepted by vegetation (interception loss), infiltration into the soil (infiltration), retention on the surface (depression storage), evaporation and loss through the streambed and banks. As these loss components are dependent on
topography, soil characteristics, vegetation and climate; the components exhibit a high degree of temporal and spatial variability during high rainfall events. Many loss models do not account for the interception, depression storage and evaporation losses separately. Instead, such losses are considered as infiltration into the soil. In Australia, the most commonly adopted conceptual loss model is the initial loss-continuing loss model[1,4,6]. The initial loss occurs prior to the commencement of surface runoff and can be considered to be composed of the interception loss, depression storage and infiltration that occur before the soil surface is saturated. In design rainfall events, the continuing loss is computed as the average rate of loss that occurs up to the end of the rainfall event, after the initial loss is satisfied.
797 Catchment area: A primary selection parameter was size of the catchment; small or large. The loss (IL-CL) model which was used in this research is only suitable for small to medium size catchments and not suitable to compute the loss values for the larger catchments. The reason is that the process of computing loss values for larger catchments is different from the process of computing loss values for smaller catchments. It was observed that for larger catchments there is lack of uniformity in catchment characteristics than in smaller to medium sized catchments. Laurens on and Pilgrim[5] mentioned that catchment characteristic is a factor which affects the loss value. Australian Rainfall and Runoff[4] suggests the catchment area with an upper limit of 1000 km2 can be considered as a small to medium sized catchments, which was taken as a guide to selecting the study catchments.
Regulation: To select the study catchments, consideration was given to whether the study catchments were regulated or unregulated, as major regulation affects the natural rainfall-runoff relationship significantly. Gauging stations subject to major regulation (such as dams, gates, diversions and back water effect) were not included in this study. Also urbanization affects the catchment hydrology, so no urban catchment was selected. Only unregulated rural catchments were selected for this study. Topographic Maps of Australia (1:100000) were consulted to investigate the nature of streamflow network and nature of regulation in the selected catchments. Also the gauging authority was consulted to know about any recent changes of regulation and land use in the selected catchments.
Record length: It was aimed to have significantly longer record lengths for the length of the rainfall and streamflow data of the catchments under study, as more number of rainfall and streamflow events will produce more reliable results. Among collected data, the highest record length of streamflow data is 48 years and the lowest record length of streamflow data is 11 years. The mean and median values of streamflow record length are 30 and 31 years. A total of 132 pluviograph stations and 338 daily rainfall stations were selected from and near the selected catchments. The rainfall data were obtained from the Bureau of Meteorology (BoM), Australia.
Catchment boundary: All the 48 catchment boundaries were collected from the Department of Natural Resources and Mines in electronic format. Mapinfo Professional 5.0 was used to delineate the catchment boundary for the selected catchments.
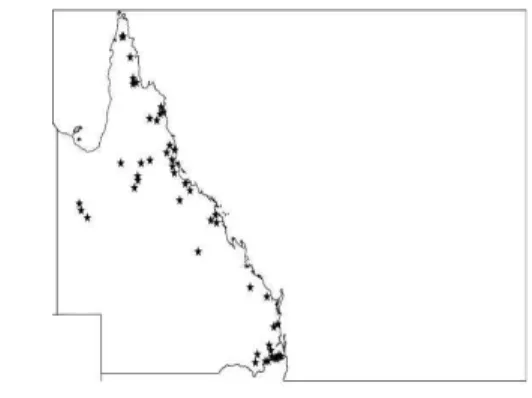
Fig. 1: Map of Queensland showing catchment locations
After mapping the catchment boundary, an electronic layer of stream gauging stations were laid over the catchment boundary. The catchments whose location of the stream gauging station in the map was found away from the catchment boundary, that catchment was not selected as study catchment. Catchments were selected, when there was one or more pluviograph station or daily rainfall stations within the catchment boundary. To select a rainfall streamflow event to estimate loss values the temporal pattern of the rainfall over the catchment is necessary. Catchments with only one pluviograph station but no daily rainfall station within the catchment boundary were selected as candidate catchments. As the catchments were small to medium in size, it was assumed that the temporal pattern of the pluviograph data was the representative temporal pattern of the whole catchment, provided the pluviograph station was located well inside the catchment boundary. But catchments with no pluviograph station inside or within 50 km of the catchment boundary were not selected as study catchments, though there was daily rainfall station within or near the catchment boundary. Again catchments having a pluviograph station close to the boundary and with daily rainfall stations within the catchment boundary were selected as study catchments. Because, it was assumed that when the pluviograph station and daily rainfall station are closely located, the temporal pattern of the daily rainfall station and the pluviograph station were same. Hence the pluviograph data can be used to proportion the daily rainfall data to obtain the representative temporal pattern of rainfall within the catchment.
798
Table 1: Stream gauge station number, location, catchment area and streamflow record length of the study catchments
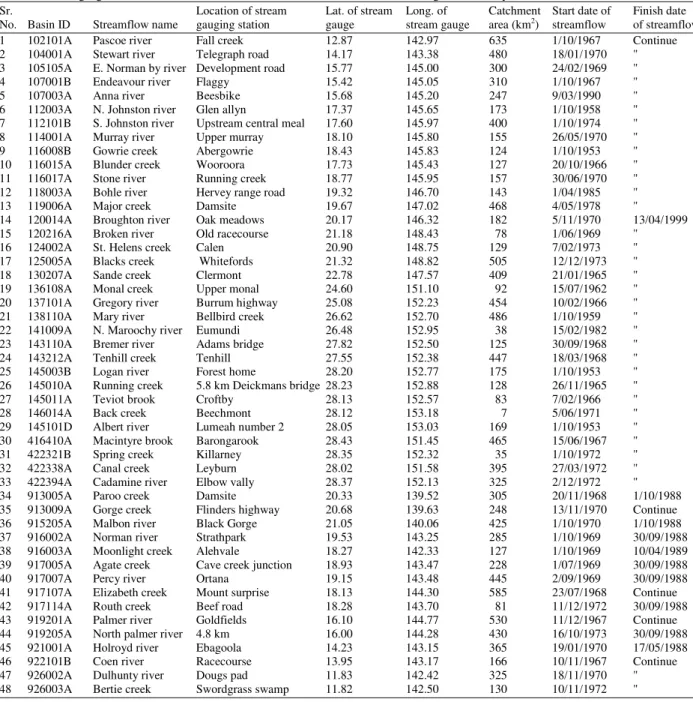
Sr. Location of stream Lat. of stream Long. of Catchment Start date of Finish date No. Basin ID Streamflow name gauging station gauge stream gauge area (km2) streamflow of streamflow
1 102101A Pascoe river Fall creek 12.87 142.97 635 1/10/1967 Continue 2 104001A Stewart river Telegraph road 14.17 143.38 480 18/01/1970 " 3 105105A E. Norman by river Development road 15.77 145.00 300 24/02/1969 " 4 107001B Endeavour river Flaggy 15.42 145.05 310 1/10/1967 " 5 107003A Anna river Beesbike 15.68 145.20 247 9/03/1990 " 6 112003A N. Johnston river Glen allyn 17.37 145.65 173 1/10/1958 " 7 112101B S. Johnston river Upstream central meal 17.60 145.97 400 1/10/1974 " 8 114001A Murray river Upper murray 18.10 145.80 155 26/05/1970 " 9 116008B Gowrie creek Abergowrie 18.43 145.83 124 1/10/1953 " 10 116015A Blunder creek Wooroora 17.73 145.43 127 20/10/1966 " 11 116017A Stone river Running creek 18.77 145.95 157 30/06/1970 " 12 118003A Bohle river Hervey range road 19.32 146.70 143 1/04/1985 " 13 119006A Major creek Damsite 19.67 147.02 468 4/05/1978 " 14 120014A Broughton river Oak meadows 20.17 146.32 182 5/11/1970 13/04/1999 15 120216A Broken river Old racecourse 21.18 148.43 78 1/06/1969 " 16 124002A St. Helens creek Calen 20.90 148.75 129 7/02/1973 " 17 125005A Blacks creek Whitefords 21.32 148.82 505 12/12/1973 " 18 130207A Sande creek Clermont 22.78 147.57 409 21/01/1965 " 19 136108A Monal creek Upper monal 24.60 151.10 92 15/07/1962 " 20 137101A Gregory river Burrum highway 25.08 152.23 454 10/02/1966 " 21 138110A Mary river Bellbird creek 26.62 152.70 486 1/10/1959 " 22 141009A N. Maroochy river Eumundi 26.48 152.95 38 15/02/1982 " 23 143110A Bremer river Adams bridge 27.82 152.50 125 30/09/1968 " 24 143212A Tenhill creek Tenhill 27.55 152.38 447 18/03/1968 " 25 145003B Logan river Forest home 28.20 152.77 175 1/10/1953 " 26 145010A Running creek 5.8 km Deickmans bridge 28.23 152.88 128 26/11/1965 " 27 145011A Teviot brook Croftby 28.13 152.57 83 7/02/1966 " 28 146014A Back creek Beechmont 28.12 153.18 7 5/06/1971 " 29 145101D Albert river Lumeah number 2 28.05 153.03 169 1/10/1953 " 30 416410A Macintyre brook Barongarook 28.43 151.45 465 15/06/1967 " 31 422321B Spring creek Killarney 28.35 152.32 35 1/10/1972 " 32 422338A Canal creek Leyburn 28.02 151.58 395 27/03/1972 " 33 422394A Cadamine river Elbow vally 28.37 152.13 325 2/12/1972 " 34 913005A Paroo creek Damsite 20.33 139.52 305 20/11/1968 1/10/1988 35 913009A Gorge creek Flinders highway 20.68 139.63 248 13/11/1970 Continue 36 915205A Malbon river Black Gorge 21.05 140.06 425 1/10/1970 1/10/1988 37 916002A Norman river Strathpark 19.53 143.25 285 1/10/1969 30/09/1988 38 916003A Moonlight creek Alehvale 18.27 142.33 127 1/10/1969 10/04/1989 39 917005A Agate creek Cave creek junction 18.93 143.47 228 1/07/1969 30/09/1988 40 917007A Percy river Ortana 19.15 143.48 445 2/09/1969 30/09/1988 41 917107A Elizabeth creek Mount surprise 18.13 144.30 585 23/07/1968 Continue 42 917114A Routh creek Beef road 18.28 143.70 81 11/12/1972 30/09/1988 43 919201A Palmer river Goldfields 16.10 144.77 530 11/12/1967 Continue 44 919205A North palmer river 4.8 km 16.00 144.28 430 16/10/1973 30/09/1988 45 921001A Holroyd river Ebagoola 14.23 143.15 365 19/01/1970 17/05/1988 46 922101B Coen river Racecourse 13.95 143.17 166 10/11/1967 Continue 47 926002A Dulhunty river Dougs pad 11.83 142.42 325 18/11/1970 " 48 926003A Bertie creek Swordgrass swamp 11.82 142.50 130 10/11/1972 "
Each study catchment is represented by a stream gauging station. A list of selected stream gauging stations numbers, streamflow names, location of stream gauging stations, latitude and longitude of stream gauging stations, catchment area and streamflow record length (start and finish date) is shown in Table 1.
APPROACH
Methodology (CL estimation): In ARR[4] the continuing loss is defined as the loss that occurs at a constant rate
after the commencement of the surface runoff. The procedure which was adopted in this analysis to compute the continuing losses was the same as the procedure adopted in ARR[4] i.e., the continuing loss is the rate of loss that occurred during the remainder of the storm.
799 In this analysis Initial Loss and Continuing Loss (IL-CL) model was used to compute the initial loss and continuing loss values from the rainfall and streamflow events. ARR[4] recommended design median initial losses ranging from 15.0-35.0 mm and design median continuing loss 2.5 mm h−1 for eastern catchments of Queensland. Similarly for western Queensland catchments, the recommended median continuing loss is 1.4 mm h−1. As per ARR recommendations, the design initial loss varies with the duration; however the design continuing loss does not vary with time but remain constant throughout the duration of the storm.
The water balance equation from the start of a rainfall event till the end of a runoff event may be expressed as:
R = IL+CL*t+QF (1)
Where:
R = Total rainfall of the event expressed in average depth of rainfall in mm over the catchment QF = Quickflow, assumed to be resulted from the
rainfall event, expressed in mm
t = Time elapsed between the start of the surface runoff till the end of the rainfall event (h)
Since, QF is the total Streamflow (SFT) minus Baseflow (BF), Eq. 1 may be written as:
R = IL+CL*t+SFT-BF (2)
where, both SFT and BF are expressed in mm.
As IL-CL model does not consider the temporal variability of losses. From Eq. 1 CL may be expressed as:
CL = (R-IL-QF)/t (3)
To estimate QF in Eq. 3, separation of base flow from total streamflow was required. A lower limit of 0.0 mm h−1 and an upper limit of 20.0 mm h−1 were imposed for the continuing loss computation and events outside of this range were excluded from this analysis. As continuing loss value more than 20.0 mm h−1, needs more detailed investigation.
RESULTS
The descriptive statistics of all the selected 969 rainfall streamflow events of IL and CL values are shown in Table 2. A total of 48 catchments were considered as for this analysis. The IL values range was 0.0-189.37 mm and the CL values range was 0.01-18.31 mm h−1 and the median IL values range was from
0.7- 71.77 mm and the median CL values range was from 0.71-5.8 mm h−1 respectively.
Table 2 shows that the derived continuing loss values for all the 48 selected catchments are from 0.01- 18.31 mm h−1 and median continuing loss values for all the 48 selected catchments are from 0.71-5.8 mm h−1. Hence it is observed that the continuing loss varies with the duration of the storm rather than it remains constant throughout the storm. Similar characteristics are expected from other catchments around the world.
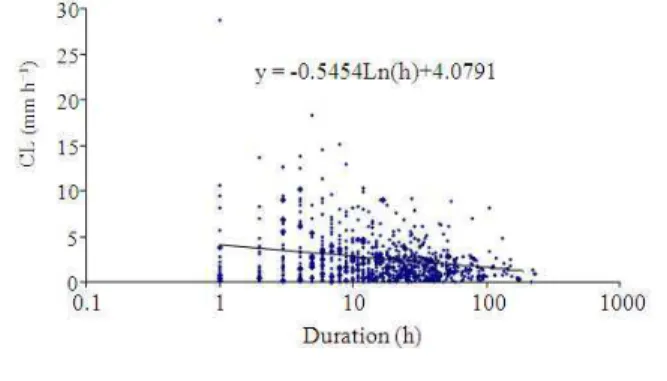
To examine the effect of duration on continuing loss an analysis was performed with all the selected 969 rainfall events using a threshold value of 0.01 mm h−1. To examine how continuing loss varies with the duration, the continuing losses of all the selected 969 rainfall events were plotted against their duration (duration between the end of initial loss and the end of the rainfall event) of all the events as shown in Fig. 2. The continuing loss for each catchment was examined against their durations of the remainder of the storm. It was observed that the continuing loss decays with duration i.e., it is not a single fixed value as recommended in ARR[4].
In Queensland, the loss value varies with the location of the catchments. To examine the effect of duration in loss values for different regions of Queensland, the Queensland catchments were divided into two categories to compute storm losses such as eastern catchments and western catchments. The initial losses in western catchments are sometimes higher because the catchments are dryer than the eastern catchments. An investigation was performed to examine the effect of duration on continuing losses for different locations of Queensland catchments. Out of all selected 48 Queensland catchments 11 eastern catchments, 5 western catchments and 12 northern Queensland catchments were selected to examine the effect of duration on continuing loss values.
800 Table 2: Descriptive statistics of the computed IL and CL values
Storm Initial Losses (IL), mm Storm Continuing Losses(CL) mm h−1 Catchment --- ---
ID Name Area (km2) N Range Median Range Median
102101 Pascoe river 635 93 0.2-174.88 37.61 0.05-13.67 1.910
104001 Stewart river 480 7 3.89-78.3 42.17 0.9-6.59 1.420
105105 E. Norman river 300 3 10.92-18.39 11.92 0.92-1.43 1.300 107001 Endeavour river 310 3 16.35-114.03 71.77 0.57-3.07 0.710
107003 Anna river 247 3 12.24-36.46 14.00 0.94-2.63 1.490
112003 N. Johnston river 173 15 3.3-108.55 34.04 0.3-7.79 2.690 112101 S. Johnston river 400 3 31.52-112.72 41.66 2.68-4.48 3.340
114001 Murray river 155 23 1.6-159.22 65.75 0.05-8.44 4.740
116008 Gowrie river 124 61 0.29-155.01 21.74 0.01-10.29 2.630 116015 Blunder creek 127 48 1.92-189.37 70.53 0.07-11.3 1.460
116017 Stone river 157 55 0.26-161.71 33.23 0.09-14.52 2.540
118003 Bohle river 143 24 0.11-93.2 28.80 0.66-7.63 2.260
119006 Major creek 468 4 10.27-79.87 35.25 0.33-1.20 1.150
120014 Broughton river 182 19 2.0-71.0 18.42 0.16-8.39 2.060
120216 Broken river 78 11 29.35-123.37 64.26 0.56-9.11 1.700
124002 St. Helens creek 129 11 11.56-154.62 53.71 0.33-6.04 1.620
125005 Blacks creek 505 35 0.8-144.39 57.63 0.22-15.39 3.450
130207 Sande creek 409 14 3.84-97.04 27.74 0.18-8.99 2.680
136108 Monal creek 92 12 2.71-48.2 13.08 0.18-9.12 1.210
137101 Gregory river 454 8 3.57-123.05 29.81 0.12-5.74 2.035
138110 Mary river 486 23 0.6-126.09 29.95 0.1-4.01 1.020
141009 N. Maroochy river 38 22 1.52-113.26 42.27 0.16-3.71 0.890 143110 Bremer river 125 37 0.24-116.98 39.04 0.02-12.55 1.170 143212 Tenhill creek 447 24 6.86-125.46 43.48 0.01-7.58 1.160
145003 Logan river 175 42 0.2-99.01 30.82 0.07-18.31 1.460
145010 Running creek 128 20 0.0-80.57 31.86 0.01-10.17 1.180
145011 Teviot brook 83 37 1.5-91.9 29.70 0.01-6.99 1.000
145101 Albert river 169 35 0.59-165.84 43.46 0.01-6.95 1.520
146014 Back creek 7 10 0.0-49.55 4.84 0.52-2.92 1.870
416410 Macintyre brook 465 28 0.05-93.34 28.73 0.15-15.06 1.770
422321 Spring creek 35 6 0.24-40.41 4.29 0.05-1.76 0.730
422338 Canal creek 395 27 0.07-116.41 24.24 0.13-6.84 1.580
422394 Cadamine river 325 21 8.99-89.35 40.51 0.08-3.2 0.920
913005 Paroo creek 305 6 1.06-25.64 9.31 0.64-5.58 2.380
913009 Gorge creek 248 9 0.03-46.23 6.20 0.17-5.39 1.060
915205 Malbon river 425 5 9.17 59.79 34.21 0.56-14.61 3.950
916002 Norman river 285 9 0.66 -102.63 16.61 0.54-5.63 3.200
916003 Moonlight creek 127 7 0.51-60.58 28.93 0.45-10.4 2.400
917005 Agate creek 228 19 0.14-34.67 13.90 0.23-7.12 2.830
917007 Percy river 445 8 0.11-24.85 24.49 0.04-5.02 1.920
917107 Elizabeth creek 585 8 2.74-42.09 27.25 0.25-4.03 2.040
917114 Routh creek 81 7 6.57-61.03 29.55 0.67-4.06 1.440
919201 Palmer river 530 5 1.82-55.86 38.31 0.08-8.62 2.200
919205 N. Palmer river 430 7 0.8-46.19 14.51 0.3-10.95 5.800
921001 Holroyd river 365 16 1.91-90.31 39.29 0.26-16.04 1.190
922101 Coen river 166 59 0.26-81.89 24.52 0.08-9.45 2.160
926002 Dulhunty river 325 12 0.0-6.29 3.39 0.03-5.91 1.600
926003 Bertie creek 130 8 0.0-5.03 0.70 0.18-6.85 1.640
Average 20 0.0-189.37 0.7-71.77 0.01-18.31 0.71-5.8
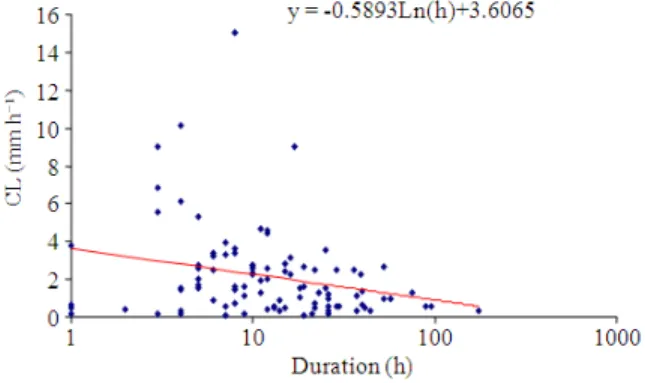
To examine how continuing loss varies with duration, the continuing loss and the duration of 270 rainfall events of 11 eastern Queensland catchments were plotted as shown in Fig. 3. It shows that, the continuing loss is not constant with storm duration but
rather it decays with the duration. The equation of the decaying curve is shown in Fig. 3.
801 the effect of duration on continuing losses. Figure 4 shows that the continuing loss is not constant in respect of duration, but it decays with respect to duration of the rainfall event. The equation of the decaying curve is also shown in Fig. 4.
In Fig. 5 the continuing losses of 340 rainfall events of 12 northern catchments of Queensland are plotted against their respective durations to examine the effect of duration on continuing losses. Figure 5 shows that the continuing loss is not constant in respect of duration, but that it decays with respect to duration of the rainfall event. The equation of the decaying curve is shown in Fig. 5. Also the results of the continuing losses against their durations for few individual catchments are shown in Fig. 6.
Fig. 3: Variation of continuing loss values with duration in 11 eastern Queensland catchments
Fig. 4: Variation of continuing loss values with duration in 5 western Queensland catchments
802
Fig. 6: Plots of continuing losses against their durations for few individual catchments
DISCUSSION
IL-CL model and associated parameters are widely used in Australia for design flood estimations. Current
803 losses values found in this study are not constant. Rather, it is found that continuing loss value decreases with the increase of the duration of the rainfall event i.e., CL value is not a fixed single value for a catchment as recommended in ARR[4] but it decays with the increase in the duration of the storm. Hence, it was observed that the continuing loss of the Queensland catchments can be described as probability distributed losses.
CONCLUSION
This research analyzed how to improve the design continuing loss estimate for flood estimation in Queensland. The finding has important significance for design flood estimation. The following conclusions can be drawn from the analysis:
• It was observed that the computed median CL value for western Queensland catchments was 12.86% higher than that of ARR recommended median continuing loss value
• It is recommended in ARR that the continuing loss that occurs for a rainfall event is at a constant rate during the remainder of the storm. But this recommendation is not correct as per Fig. 2-6, which proved that the continuing loss decreases with the time i.e., it is not a single fixed value during the remainder of the storm. Hence, the continuing losses for the Queensland catchments are in reality probability distributed losses
• This finding (probability distributed losses) is required to be confirmed with a larger data set. A larger data set is required to derive stochastic continuing losses for application with Joint Probability Approach as described by Ilahee et al.[3]
REFERENCES
1. Hill, P.I. et al., 1996. Empirical Analysis of Data to Derive Losses for Design Flood Estimation in South-Eastern Australia. Cooperative Research Centre for Catchment Hydrology, ISBN: 1876006110, pp: 98.
2. Hiscock, K., 2005. Hydrology Principles and Practice. Willy-Blackwell Publishing, Oxford, UK., ISBN: 10: 0632057637, pp:408.
3. Ilahee, M., A. Rahman and W.C. Boughton, 2001. Probability-distributed initial losses for flood estimation in Queensland. Proceedings of the International Congress on Modeling and Simulation, Dec. 10-13, Canberra, Australia, pp: 107-112. http://eprints.qut.edu.au/24622/
4. Institution of Engineers Australia, 1998. Australian Rainfall and Runoff: A Guide to Flood Estimation. Institution of Engineers Australia, Australia, ISBN: 0858254360.
5. Laurenson, E.M. and D.H. Pilgrim, 1963. Loss rates of Australian catchments and their significance. J. Inst. Eng. Aust., 35: 9-24.
6. Rahman, A., P.E. Weinmann and R.G. Mein, 2002. The use of probability-distributed initial losses in design flood estimation. Aust. J. Water Resour., 6: 17-30.
http://www.eabooks.com.au/epages/eab.sf/en_au/? ObjectPath=/Shops/eabooks/Products/AJWR019 7. Snorasson, A., H.P. Finnsdottir and M.E. Moss,
2002. The Extremes of the Extremes: Extraordinary Floods. IAHS Publication, UK., ISBN: 10: 190150266X, pp: 408.