Gains in Life Expectancy Associated with
Higher Education in Men
Govert E. Bijwaard1*, Frans van Poppel1, Peter Ekamper1, L. H. Lumey2,3
1Netherlands Interdisciplinary Demographic Institute (NIDI-KNAW)/University of Groningen, the Hague, the Netherlands,2Department of Epidemiology, Mailman School of Public Health, Columbia University, New York, United States of America,3Molecular Epidemiology, Leiden University Medical Center, Leiden, the Netherlands
Abstract
Background
Many studies show large differences in life expectancy across the range of education, intel-ligence, and socio-economic status. As educational attainment, intelintel-ligence, and socio-eco-nomic status are highly interrelated, appropriate methods are required to disentangle their separate effects. The aim of this paper is to present a novel method to estimate gains in life expectancy specifically associated with increased education. Our analysis is based on a structural model in which education level, IQ at age 18 and mortality all depend on (latent) intelligence. The model allows for (selective) educational choices based on observed fac-tors and on an unobserved factor capturing intelligence. Our estimates are based on infor-mation from health examinations of military conscripts born in 1944–1947 in The
Netherlands and their vital status through age 66 (n = 39,798).
Results
Our empirical results show that men with higher education have lower mortality. Using struc-tural models to account for education choice, the estimated gain in life expectancy for men moving up one educational level ranges from 0.3 to 2 years. The estimated gain in months alive over the observational period ranges from -1.2 to 5.7 months. The selection effect is positive and amounts to a gain of one to two months. Decomposition of the selection effect shows that the gain from selection on (latent) intelligence is larger than the gain from selec-tion on observed factors and amounts to 1.0 to 1.7 addiselec-tional months alive.
Conclusion
Our findings confirm the strong selection into education based on socio-economic status and intelligence. They also show significant higher life expectancy among individuals with higher education after the selectivity of education choice has been taken into account. Based on these estimates, it is plausible therefore that increases in education could lead to increases in life expectancy.
OPEN ACCESS
Citation:Bijwaard GE, van Poppel F, Ekamper P, Lumey LH (2015) Gains in Life Expectancy Associated with Higher Education in Men. PLoS ONE 10(10): e0141200. doi:10.1371/journal.pone.0141200
Editor:Chin-Kuo Chang, Institute of Psychiatry, UNITED KINGDOM
Received:November 18, 2014
Accepted:October 6, 2015
Published:October 23, 2015
Copyright:© 2015 Bijwaard et al. This is an open access article distributed under the terms of the Creative Commons Attribution License, which permits unrestricted use, distribution, and reproduction in any medium, provided the original author and source are credited.
Introduction
Early life family characteristics including education and socio-economic status are important predictors of adult health and mortality [1–3]. The mortality differences by education hold across many populations and are persistent over time [4]. This is not only true for developing countries, but also for highly developed countries with advanced health care systems and extensive social security [5]. In eight Western European countries, lower education was associ-ated with higher mortality from all causes and from cardiovascular diseases, neoplasms, and external causes [6]. Even in an egalitarian country such as the Netherlands, the difference in life expectancy between individuals with no formal education beyond primary school and those with a university education is more than five years [7]. The background of these inequali-ties is not fully understood [8,9].
The association between mortality and education may partly be explained by confounding factors such as intelligence, and socio-economic status that affect both education choices and mortality [10]. Lower intelligence as measured by standardized IQ tests is related to increased mortality [11–13]. Because educational attainment and intelligence are strongly correlated, it is difficult to separate their effects on mortality [14].
Studies based on natural experiments in education including changes in compulsory school-ing laws may to some extent overcome the difficulty of separatschool-ing true education effects from these confounding factors. Recent analyses of such natural experiments suggest that the direct effects of education on mortality may be limited or even absent [15–18]. It is possible therefore that the strong association between education and mortality is partly due to the incomplete control of confounding factors.
The effects of intelligence on mortality could be operating in several ways. Indirect effects can be expected if higher intelligence drives better education and improvements in Socio-eco-nomic Status (SES) in later life [19]. Direct effects are likely if more intelligent individuals do better in managing their diseases and in seeking appropriate treatment where necessary [11]. As an example of the latter, higher educated men are more able to comply with and maintain complex health regimens that are prescribed to deal with HIV [20] and sooner adapt to evolv-ing medical technologies [21,22]. Education and intelligence may also operate in tandem and be mutually reinforcing. Failure to control for intelligence in the education health relation biases the estimated effect [23] and a better understanding of this relation is needed to establish potential direct benefits of improvements in education on mortality.
The aim of this paper is to estimate gains in life expectancy associated with increased educa-tion. Our approach to account for the interdependence of intelligence, education, and socio-economic status, and their joint influence on mortality, is based on structural models devel-oped by Conti and Heckman [24,25] and expanded to allow for duration outcomes [26] and to allow for ordered rather than binary education strata.
Materials and Methods
Study population
Using anonymized extracts from examinations for military service in the Netherlands between 1962–1965, we followed 45,037 men selected from the national birth cohorts 1944–1947 [27]. These examinations are based on yearly listings of all Dutch male citizens aged around 18 years in the national population registers. The study was reviewed by the Institutional Review Board of the Columbia University Medical Center in New York, NY. The Board determined that stud-ies on this study population do not meet the DHSS definition of‘human subjects research’and are exempt from IRB approval. In the Netherlands, the study does not need approval by Ethical
Interested researchers should also contact the authors Govert Bijwaard ([email protected]) or Peter Ekamper ([email protected]) for further information regarding the military examination records used.
Funding:This work was supported by National Institute of Health grant no NIH RO1 AG028593 (GEB, FvP, PE, LHL). The funders had no role in study design, data collection and analysis, decision to publish, or preparation of the manuscript.
Review Boards or by the National Data Protection Authority (College Bescherming Persoons-gegevens) as all study procedures are in compliance with Dutch privacy legislation and do not need the consent of the data subjects concerned or of their relatives. The study is based on pop-ulation wide administrative records and not on patient records.
Examination records
The examination records contain detailed information on demographic and socio-economic status, including education, father’s occupation, birth order, religion, the place of birth, and a standardized psychometric test battery with several measures of intelligence.
The principal intelligence measure included is the Raven Progressive Matrices, a nonverbal untimed test that requires inductive reasoning about perceptual patterns [28]. Because the test does not depend on reading, writing, or language skills and is easily administered and interpreted it is widely used to test military conscripts across the world. We used separate tests for Arithmetic and Language performance. Scores for all tests were grouped in six levels from 1 (highest) to 6 (lowest). The test scores are highly correlated with Pearson’srvalues in the range of .63 to .76. The education system in the Netherlands is characterized by the nominal number of years of schooling and by two parallel streams in the educational system- general academic and voca-tional. Streaming choices are made at the end of primary school. Students in the vocational stream cannot directly enter university. Students with more than twelve years of education will nearly always be in the academic stream [29,30].
Conscripts’education was classified in four levels [31]: primary school (primary, six years of schooling); lower vocational education (eight years of schooling); lower secondary education (ten years of schooling); and intermediate or higher vocational or academic education (higher, twelve or more years of schooling). Because conscripts were age 18 at examination the highest education group includes men who had just started university.
Father’s occupation was classified into five categories: professional and managerial workers; clerical, self-employed and skilled workers; farmers; semi-skilled workers including operators, process workers and shop assistants; and laborers and miners. Fathers with unknown occupa-tions were classified separately.
Birth order was recorded as reported by the examinee.
Place of birth was categorized in four urbanization levels distinguishing rural communities (rural communities with 20% or more farming population), urbanized rural communities (rural communities with less than 20% farming population), towns (townships and cities with less than 100,000 inhabitants), and cities with populations of 100,000 or more.
Self-reported religion was classified as Roman Catholic, Protestant (Dutch Reformed or Cal-vinist), other or none.
Follow-up
Our study is based on military examination records for men born in the Netherlands in the years 1944–1947 which were originally sampled to the study of the relation between prenatal famine exposure and mortality [27]. For that reason, men born in the Western Netherlands in 1944–1945 were over-represented. In this population, there was no relation however between famine conditions around birth and either mental performance [32] or education at age 18 [27]. The study population appears suitable therefore to obtain unbiased estimates of the rela-tion between cognitive ability, educarela-tion, and mortality.
Data description
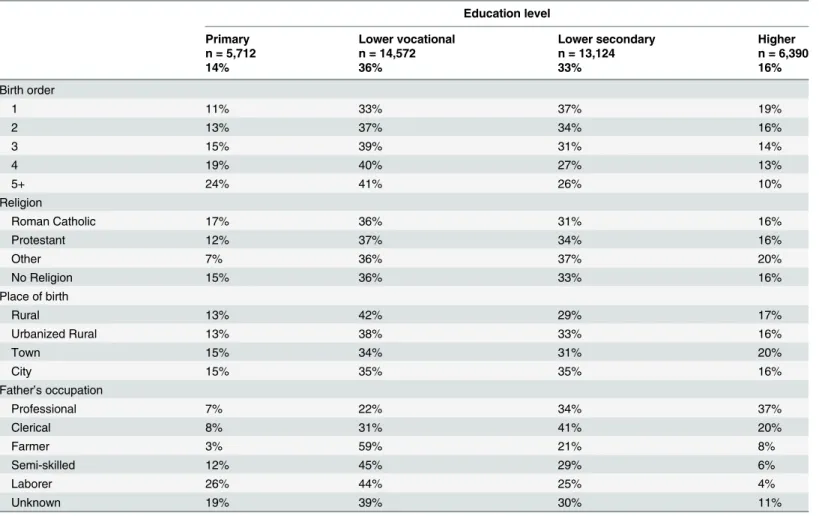
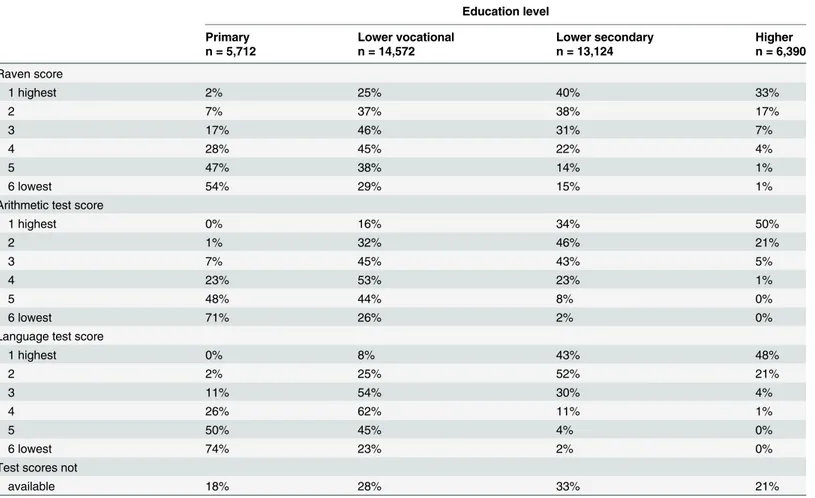
Selected demographic and socio-economic characteristics at the time of medical examinations are given inTable 1. Education level is strongly related to father’s occupation; men with the highest education tend to have fathers in the professional or managerial occupations. First-born conscripts also tend to have higher levels of education. InTable 2, intelligence test scores obtained by three instruments are presented by level of education. Again, men with the highest education tend to do best on all psychometric tests.
Table 1. Population characteristics at age 18 years by level of education.
Education level
Primary Lower vocational Lower secondary Higher
n = 5,712 n = 14,572 n = 13,124 n = 6,390
14% 36% 33% 16%
Birth order
1 11% 33% 37% 19%
2 13% 37% 34% 16%
3 15% 39% 31% 14%
4 19% 40% 27% 13%
5+ 24% 41% 26% 10%
Religion
Roman Catholic 17% 36% 31% 16%
Protestant 12% 37% 34% 16%
Other 7% 36% 37% 20%
No Religion 15% 36% 33% 16%
Place of birth
Rural 13% 42% 29% 17%
Urbanized Rural 13% 38% 33% 16%
Town 15% 34% 31% 20%
City 15% 35% 35% 16%
Father’s occupation
Professional 7% 22% 34% 37%
Clerical 8% 31% 41% 20%
Farmer 3% 59% 21% 8%
Semi-skilled 12% 45% 29% 6%
Laborer 26% 44% 25% 4%
Unknown 19% 39% 30% 11%
Each row sums to 100%.
Statistical analysis
We seek to evaluate the impact of education on life expectancy accounting for intelligence and other individual factors that influence both the education choice and mortality. A common characteristic of survival data, including time to death, is that not all individuals experience the event of interest during the observation period. Such right censoring makes inference based on means unreliable. Another characteristic is dynamic selection: those still alive at age 18 may not be a random selection of the original population of births. We therefore use the (mortality) haz-ard, or the force of mortality, as this effectively deals with these data characteristics. A common approach would be to ignore the impact of intelligence and estimate a proportional hazard model for the mortality rate including the education level as one of the explanatory variables that proportionally changes the mortality rate. However, it is very likely that not only the scale of the mortality hazard but also the shape is affected by education. It is also plausible that the effect of other individual factors differs by education level. However, it is very likely that not only the scale of the mortality hazard but also the shape is affected by education. It is also plausi-ble that the effect of other individual factors differs by education level. For example, having a father with a professional occupation is likely to have a larger impact for men with only primary education than for men with higher education. We therefore start our analyses withseparate proportional Gompertzmodels, that is separate by education level. We choose a Gompertz
Table 2. Intelligence scores at age 18 years by level of education.
Education level
Primary Lower vocational Lower secondary Higher
n = 5,712 n = 14,572 n = 13,124 n = 6,390
Raven score
1 highest 2% 25% 40% 33%
2 7% 37% 38% 17%
3 17% 46% 31% 7%
4 28% 45% 22% 4%
5 47% 38% 14% 1%
6 lowest 54% 29% 15% 1%
Arithmetic test score
1 highest 0% 16% 34% 50%
2 1% 32% 46% 21%
3 7% 45% 43% 5%
4 23% 53% 23% 1%
5 48% 44% 8% 0%
6 lowest 71% 26% 2% 0%
Language test score
1 highest 0% 8% 43% 48%
2 2% 25% 52% 21%
3 11% 54% 30% 4%
4 26% 62% 11% 1%
5 50% 45% 4% 0%
6 lowest 74% 23% 2% 0%
Test scores not
available 18% 28% 33% 21%
Each row sums to 100%.
mortality rate [33–35], which assumes an exponential increase in the mortality by age, because this is known to provide accurate mortality hazards for middle aged individuals [36].
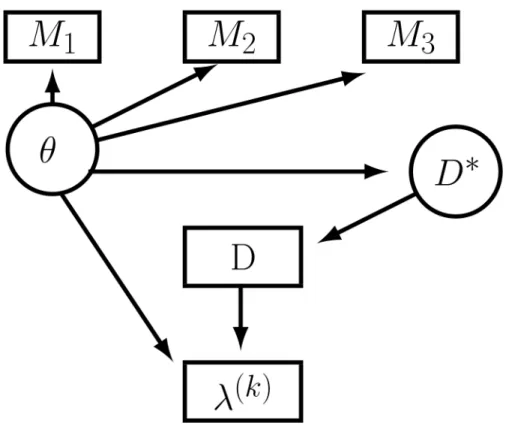
The difference in the implied life expectancy for these separate Gompertz models will only provide the educational gains in life expectancy accounting for observed individual differences by education. Individual intelligence seems an important factor influencing both the education choice and mortality and ignoring it would bias the results. However, intelligence is also heavily affected by parental background and by the education attained up till age 18 [37]. Another issue is that standard IQ-test are only a proxy of intelligence, or cognitive ability. This precludes the simple addition of intelligence as measured by IQ-test(s) into the Gompertz hazards. We therefore formulated a structural model to account for the interdependence of intelligence and education and their joint influence on mortality [26], extending the structural equation model of Conti and Heckman [24,25] to a Gompertz proportional hazard model. The model allows for potential interdependencies between educational choice, intelligence and mortality. We assume that individuals base their schooling decision on expected utility maximizing and that the individual utility of each education level attained depends on the income earned and per-ceived health. This implies that the decision to continue schooling and, to attain a higher edu-cation level depend on expected income and (potentially) also on perceived health gains. The model consists of three parts: (i) the education choice, (ii) potential mortality hazards and (iii) a measurement system for latent intelligence.Fig 1shows the structure of the model.
The education choice is based on maximizing the expected future utility. LetD
i denote the
(latent) utility of an individual choosing a particular education level. We assume that the edu-cational choice is endogenous and that selection into schooling is fully accounted for by the
Fig 1. Schematic depiction of the structural equation model.Latent intelligenceθinfluences the utility, D*, of an individual choosing a particular education level,D. It also influences directly the (potential) mortality hazardλ(k), for each education levelD=k. The value of three measured IQ-tests,M1,M2andM3all depend on the latent intelligence.
observed individual characteristics and their latent cognitive ability. Define the indicator of education,D, taking the valuekif the individual has attained education levelk(1,. . ., 4):D=k
ifzk−1<D
z
kwithD=γ0X+αDθ+νD, the underlying latent utility of choosing a
particu-lar education level, which is continuous and depends linearly on the (vector of) observed char-acteristicsXand latent intelligenceθand wherez0=−1andz4=1. We assume thatνDis
normally distributed and assume an ordered probit model for the educational choice. There-fore the probability that an individual has attained education levelkPr(D=k) is given by
Fðzk g0X a
DyÞ Fðzk 1 g
0X a
DyÞ; ð1Þ
withF() as the standard normal cumulative density. Once the individual has decided his edu-cation level, future mortality is potentially causally related to this decision.
The second part of the structural model comprises the potential mortality hazards. These hazards are potential because each individual’s mortality is only observed for the actual educa-tion level and not for potential alternatives in educaeduca-tion level. For each educaeduca-tion level we choose a Gompertz mortality rate. Lettbe the age of the individual, with the potential hazard for education levelklðkÞðtÞ ¼ expðaktþbk0þb
0
kXþakyÞdepending on the (vector of)
observed characteristicsXand latent intelligenceθ. The shape of the hazard is captured byak
and the scale of the hazard byβk0. The effect of latent intelligence on the mortality hazard is
captured byαk. The corresponding potential survival rates are
SðkÞðtjX;yÞ ¼ exp
Z t
0
lðkÞðsjX;yÞds
ð2Þ
¼ exp 1
ak
ebk0þb0kXþakyðeak 1Þ
ð3Þ
The Gompertz survival models for each of the four education levels include birth order, place of birth, religion, and father’s occupation as relevant control covariates related to survival and the impact of the latent intelligence. These models have a proportional hazard conditional on the latent intelligence. This is similar to including a (log-normal) frailty into the proportional hazard model [38].
The model is closed by three measurement equations linking the intelligence scores with the latent cognitive ability and the (vector of) observed individual characteristics. Because for each IQ test,q= 1, 2, 3, the continuous score is only observed in six ordered IQ classes, an ordered probit is assumed for each test withM ¼d0
qXþaMqyþnMqwhere νM
qis normally distributed
andMq=mifϑqm−1
<Mϑ
qm. The probability to observe an individual in one of the
IQ-clas-ses is given by
PrðMq¼mÞ ¼FðWqm d
0
qX aMqyÞ FðWqm 1 d 0
qX aMqyÞ: ð4Þ
An important feature of mortality outcomes is that some individuals are still alive at the end of the observation period and are right censored. Another feature of our data is that all men were about 18 years old at the start of the observation period at the time of military examina-tion. We therefore condition on survival through the age at military examinaexamina-tion. With the dis-tribution assumptions on the educational choice, the latent mortality hazards and the
We also estimate separate Gompertz proportional hazard models, in which we ignore the dependence on latent cognitive ability. From the estimated parameters the implied survival function can be calculated for each individual, given his observed characteristicsXbased onEq (3). The results from the separate Gompertz proportional hazard models are used to decom-pose the educational gain into a selection on observed factors and on the latent intelligence.
At the individual level, the main questions relate to the difference in life expectancy after age 18 and to the difference in expected years lived between ages 18 and 66 (the minimum and maximum observed age) comparing two adjacent educational levels. For the calculation of the life expectancy we assume that the estimated Gompertz hazards hold throughout adult life starting at age 18 and extending beyond the highest observed age of 66. For the calculation of the expected years lived we only focus on the interval of observed ages. Both measures can be obtained by integrating the difference in survival,S(k+1)(t)−S(k)(t), over the relevant age
inter-val [38], whereS(k+1)(t) denotes the survival time up to agetfor an individual with education (D=k+ 1), andS(k)(t) is the survival time up to agetfor those with education (D=k), for
k= 1,. . ., 3. As we only observe the mortality of an individual for his chosen education level
and not for the counterfactual higher or lower education level, we can only calculate the expected life-expectancy and expected years lived averaged over all (relevant) individuals. It is important to note that the relevant distribution of the observed characteristics and the latent cognitive ability differ by education level. Except for the lowest and the highest education level we can for each education level calculate estimates of three average life-expectancy/expected years lived: (i) using the distribution of the characteristics for the adjacent lower education level, (ii) using the distribution of the characteristics for the particular education level, and (iii) using the distribution of the characteristics for the adjacent higher education level.
To obtain the average gain in life expectancy we first calculate the average survival gain. The gain in survivalGk
ATUðtÞat age t when the educational level improves from levelktok+ 1 with k= 1, 2, 3; referring to primary, lower vocational, lower secondary, and higher education is:
Gk ATUðtÞ ¼
Z Z
E Sðkþ1ÞðtjX¼x
;y¼cÞ SðkÞðtjX¼x;y¼cÞ
dFX;yjD¼kðx;cÞ ð5Þ
whereXare the included covariates andθis the value of the latent intelligence. We integrate
over the joint distribution of the covariates and the latent intelligence given education levelk
(the lowest of the two adjacent education levels)FX,θjD=k(x,c) to obtain theaverage treatment
effect on the untreated(ATU). This treatment effect provides the average educational gain for the lower educated if they had obtained a higher education level. When interested in the effect of increasing the education level the average treatment on the untreated is the most relevant measure from a policy perspective, as it provides the educational gains for the population whose education level can be increased. Other treatment effects, such as the average treatment effect and the average treatment effect on the treated, take a less relevant reference population (respectively, the whole population and the population who has already attained a higher education).
The integrals described above cannot be solved analytically as the dimension of the covari-atesXis too large. The comparison of the survival functions also involves the counterfactual of surviving at another education level. Therefore simulations are needed to approximate the sur-vival differences. This is explained in more detail in the Supporting Information methodologi-calS1 Appendix.
characteristics and from differences in the unobserved intelligence. A limitation is that all observations are limited to the ages 18–66 years. The implied differences in expected years lived between ages 18 and 66 are therefore only shown by education level.
The standard (non-parametric) estimator of the survival function is the product-limit esti-mator proposed by Kaplan and Meier [39],^S¼Q
tit½
1 di
Yiwithdiis the number of deaths at
agetiandYiis the number of individuals who are at risk of dying at ageti. The surface under
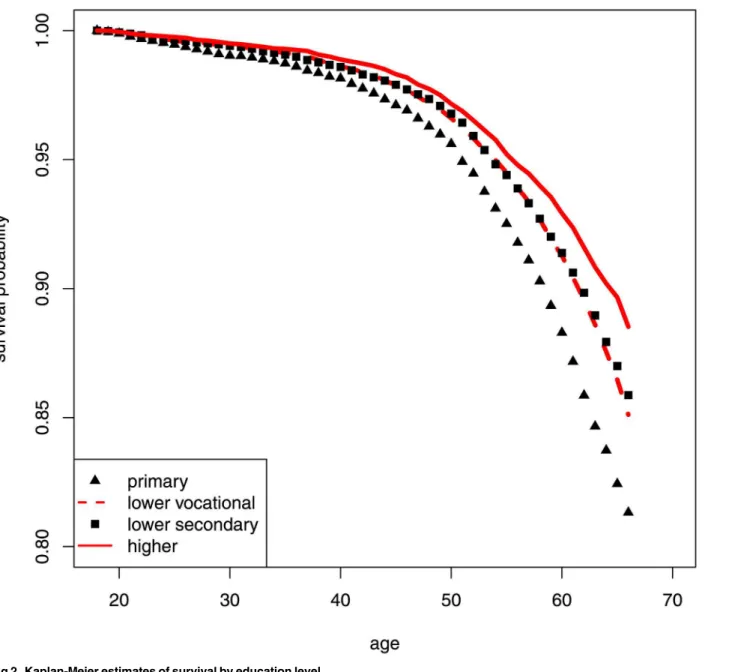
the Kaplan-Meier provides the (non-parametric) estimate of the expected years lived of the individuals in the sample over the observed age interval [38]. We calculate the Kaplan-Meier survival function and the implied expected years lived between ages 18 and 66 for each educa-tion level. The Kaplan-Meier estimate of the survival funceduca-tion does not account for any observed factors that influence the survival, except for the education level. The unconditional differences in expected years lived based on the Kaplan-Meier estimates therefore provide the total educational effect on the expected years lived, which is the sum of the educational gain and a selection effect. The selection effect of education is the gain in expected years lived by individuals selecting themselves into different education levels. This gain is caused by the fact that individuals with different education levels also differ in other aspects that influence their survival. We can decompose the unconditional differences in expected years lived based on the Kaplan-Meier curves into the educational gain fromEq (5)and a residual, which is a selection effect on the basis of cognitive ability and the other observable factors. Mathematically,
Gk
KMðtÞ ¼G k
ATUðtÞ þε
kðX;yÞ ð6Þ
whereGk
KMðtÞ ¼E½
R
ðSð1ÞðtÞ Sð0ÞðtÞÞdtrepresents the unconditional differences in expected
years lived from 18 to 66 from the Kaplan-Meier survival curve,Gk
ATUðtÞis the treatment effect
inEq (5)from the structural model andεkðX;yÞrepresents the selection effect on the basis of
observable characteristicsXand cognitive abilityθ, all when the educational level improves
from levelktok+ 1. Note that this selection effect is the combination of actual selection bias and selection based on perceived gains of higher education. Theselection effect,εkðX;yÞ, can be
further decomposed into a selection on observables,selection effect observed, and a selection on latent intelligence,selection effect intelligence
εkðX;yÞ ¼Gk
KMðtÞ G k
ATUðtÞ ¼ G k
KMðtÞ G k sepðtÞ
h i
þ Gk
sepðtÞ G k ATUðtÞ
h i
ð7Þ
where
Gk sepðtÞ ¼
Z
E Sðkþ1Þð
tjX¼xÞ SðkÞð
tjX¼xÞ
dFXjD¼kðxÞ; ð8Þ
is the gain in expected years lived based on the estimated separate Gompertz proportional haz-ard models, i.e. the models that ignore the influence of intelligence on the mortality. We inte-grate over the joint distribution of the covariates given education levelk FXjD=k(x).
All model estimations were carried out using STATA statistical software version 12. All the simulations to calculate the educational gains were obtained using R version 2.15.
Results
education levels are also statistically significant, except for survival in the lower vocational and lower secondary education groups that shows no difference (χ2= 1.91; d.f. = 1).
Men with lower vocational, lower secondary, and higher education have lower mortality compared to men with only primary education, with hazard ratios of 0.76 (95% CI 0.71 to 0.82), 0.73 (95% CI: 0.67 to 0.79), and 0.58 (95% CI: 0.52 to 0.64) respectively by Cox regression estimates. In subgroup analyses, men with lower vocational schooling show lower mortality compared to men with only primary education (HR 0.76; 95% CI: 0.71 to 0.82). Men with higher education show lower mortality compared to men with lower secondary education (HR 0.79; 95% CI: 0.73 to 0.87). There are no significant mortality differences between other adja-cent education categories.
Ignoring for the moment the interdependence of the education choice, mortality and IQ-test scores, we first estimate Gompertz proportional hazard models separately for each of the
Fig 2. Kaplan-Meier estimates of survival by education level.
four education levels.Table 3presents the estimated hazard ratios. The results for the ordered probit models for the education choice and the IQ-tests are shown inS1 Tablein the Support-ing Information. As separate models are run for each education level, the impact of observed individual characteristics for each education level may differ but also the baseline hazard as reflected in the shape and the scale of the Gompertz hazard. It can indeed be seen that the scale and shape of the Gompertz mortality hazard differ substantially among the four educational groups (log-scale -9.572 to -10.149 and shape 0.083 to 0.090). Highly educated men born in urban areas have a lower mortality HR 0.72 (95% CI: 0.55 to 0.95) and men with only primary education also have a lower mortality when their fathers had a professional or managerial occu-pation HR 0.75 (95% CI: 0.57 to 0.99).
The structural models assumes that the three components of the model, the education choice, the IQ-measurements and the mortality hazards, are interdependent through the unob-served latent intelligence.Table 4reports the hazard ratios for the mortality component, the odds ratios for the ordered probit education choice and the odds ratios of the ordered probit IQ-measurements. The first row ofTable 4shows that our latent factor of intelligence is strongly related to intelligence and education choice: the higher the intelligence, the higher the IQ score and the higher the attained education level. A one standard deviation higher intelli-gence increases the odds of higher education 3.09 times and the odds of higher IQ 4.02 (Raven), 6.88 (Arithmetic) and 6.62 (Language) times. Higher intelligence estimates show a lower mortality (HR: 0.76 to 0.90) for all education classes which is especially evident (and sta-tistically significant) for the second (HR: 0.76; 95% CI: 0.70, 0.83) and third (HR: 0.85; 95% CI: 0.77, 0.94) education level. As shown inTable 1, men with fathers in professional or managerial positions are more likely to obtain higher education (OR: 1.54; 95% CI: 1.48, 1.60) and there is an education gradient by father’s level of occupation. Father’s occupation has a similar relation
Table 3. Estimated mortality hazard ratios of separate proportional Gompertz models by education choice.
Education level
Primary Lower vocational Lower secondary Higher
Birth order 0.99 (0.96; 1.02) 0.98 (0.95; 1.00) 1.00 (0.97; 1.04) 0.99 (0.93; 1.05)
Religion (ref = without)
Roman Catholic 1.03 (0.89; 1.20) 0.92 (0.82; 1.04) 0.97 (0.85; 1.10) 1.15 (0.94; 1.41)
Protestant 0.96 (0.81; 1.15) 0.98 (0.87; 1.10) 0.96 (0.85; 1.08) 1.00 (0.82; 1.23)
Other religion 0.73 (0.50; 1.06) 0.95 (0.80; 1.14) 0.83 (0.68; 1.00) 0.81 (0.59; 1.10) Urbanization (ref = large city)
Rural 0.90 (0.75; 1.08) 0.94 (0.84; 1.06) 0.91 (0.79; 1.04) 0.90 (0.73; 1.09)
Urbanized rural 1.02 (0.72; 1.45) 1.07 (0.85; 1.34) 0.99 (0.77; 1.29) 1.17 (0.80; 1.72)
Urban 0.86 (0.69; 1.07) 1.05 (0.90; 1.22) 1.05 (0.89; 1.24) 0.72*(0.55; 0.95)
Father’s occupation (Ref = white collar)
Professional and managerial 0.75*(0.57; 0.99) 1.03 (0.88; 1.21) 0.99 (0.86; 1.13) 1.13 (0.95; 1.35)
Farm owners 0.93 (0.61; 1.43) 1.02 (0.82; 1.26) 1.11 (0.79; 1.55) 1.59 (0.95; 2.68)
Skilled laborers 0.97 (0.82; 1.16) 0.93 (0.83; 1.04) 1.09 (0.97; 1.23) 1.21 (0.92; 1.59) Unskilled laborers 1.10 (0.91; 1.33) 0.94 (0.82; 1.08) 1.10 (0.93; 1.30) 1.30 (0.88; 1.92)
Unknown 0.99 (0.76; 1.30) 1.36*(1.14; 1.62) 1.02 (0.81; 1.27) 1.54*(1.08; 2.20)
scale (log) -9.572 (-9.95; -9.20) -10.089 (-10.36; -9.82) -9.978 (-10.26; -9.70) -10.149 (-10.59; -9.70) shape 0.085 (0.079; 0.092) 0.090 (0.086; 0.095) 0.086 (0.081; 0.091) 0.083 (0.076; 0.091) 95% confidence interval within brackets. Significance:*p<0.05
to the measures of intelligence (OR: Raven 1.16; Arithmetic 1.58; Language 1.58). The impact of father’s occupation on the mortality hazard within education level is variable.
Implicit inTable 4is that the life expectancy in each education group not only depends on the education level but also varies by observed individual characteristics such as: birth order, religion, urbanization level and father’s occupation. As the distribution of these variables differs by education level, seeTable 1, the averaging of the estimated Gompertz survival functions over the distribution of included variables will also vary by education level. We therefore calcu-late the average life expectancy implied by the estimated models averaging over the distribution of individual characteristics stratified by education level. These distributions, stratified by edu-cation level, are used to estimate the life expectancy (assuming the estimated Gompertz hazard holds beyond the highest observed age) and the expected years lived between age 18 and 66 years for the average person in that education level for (a) individuals who actually attained that level and for (b) individuals in the adjacent higher education level.
Table 5presents the average life expectancy in years at age 18 by education level. The upper part of the table provides the life expectancies derived from the estimated simple stratified Gompertz models. These life expectancies at age 18 among men with the lowest to the highest education category range from 59.5 to 66.4 years (Table 5, upper part diagonal). There is a monotone, non-linear, relation between education level and life expectancy. Individuals with the highest education are expected to live, on average, almost six years longer than individuals with the lowest education. The educational gain on life expectancy (ATU) of an average indi-vidual moving one education level up can be obtained from comparing the life expectancy in the attained education level with the life expectancy, of the same individuals, one level higher, i.e. moving to the right in the table. The implied education gains on the life expectancy for men aged 18 are from primary to lower vocational education 2.2 years (61.7 minus 59.5 years) with a 95% CI from 0.6 to 3.8 years, from lower vocational to lower secondary education 1.4 years (95% CI: 0.1 to 2.7) and from lower secondary to higher education 2.9 years (95% CI: 1.0; 4.8).
The lower part ofTable 5provides the life expectancies implied by the structural model stratified by education level. Using the structural model the differences in life expectancy by education level are smaller than using simple stratified Gompertz models. The structural model accounts for the cognitive ability that both influences educational choice and mortality. This leads to a higher life expectancy estimate for the lowest education level and a lower esti-mate for the highest education level. Nevertheless, education level still plays a dominant (and significant) role in mortality; substantial differences in life expectancy are implied by changes in the coefficients of the mortality hazard. Based on our model, men with the lowest level of education might have lived 2 years longer (62.6 vs 60.6 years; 95% CI: 1.0 to 2.9) had they attained the next higher level of lower vocational education. The implied gain in life expectancy for men with lower vocational education had they attained the next higher level of lower sec-ondary education is 0.3 years (95% CI: -0.4 to 1.0). Men with lower secsec-ondary education might have gained 1.9 years of life (95% CI: 0.9 to 2.9) had they attained higher education. Differences in observed individual characteristics explaining the education choice appear to be less impor-tant as can be seen from comparing the life expectancies within columns. As an example, there is little change in the life expectancy of individuals with lower vocational education moving to lower secondary education if the factor distribution of this group is applied.
moving from lower vocational to lower secondary level, and 1.4 months (95% CI: 0.2 to 2.7) moving from lower secondary to higher education. For the intermediate education group with lower vocational education the treatment effect of education is negative. The selection effect, i.e. the positive impact on months lived for individuals selecting themselves into the next higher education level, is positive for all education levels. It amounts to one to two additional months of life (Table 6, column 2).
Next we decompose the selection effect of moving up one education level into two compo-nents: the first is attributable to selection on observed individual characteristics and the second to selection on intelligence. (Table 6, columns 3 and 4). The latter effect is predominant and amounts to 1.0 month additional living moving from primary to lower vocational education,
Table 4. Estimated odds and hazard ratios for structural model.
Educational choice
Intelligence measurement Mortality hazard
Raven Arith. Language Primary Lower
vocational
Lower secondary
Higher
Cognitive ability 3.09*(3.02; 3.16)
4.02*(3.92; 4.13)
6.99*(5.83; 8.38)
6.62*(5.44; 8.05)
0.90 (0.80; 1.01)
0.76*(0.70; 0.83)
0.85*(0.77; 0.94)
0.86 (0.71; 1.04) Birth order 0.89*(0.88;
0.90)
0.93*(0.92; 0.94)
0.81*(0.79; 0.83)
0.78*(0.76; 0.80)
0.99 (0.96; 1.03)
0.98 (0.96; 1.01) 1.01 (0.97; 1.04) 0.99 (0.93; 1.05) Religion (ref = without)
Roman Catholic 0.99 (0.96; 1.03) 1.03 (0.99; 1.07)
1.24*(1.14; 1.34)
1.05 (0.97; 1.15)
1.04 (0.89; 1.21)
0.92 (0.82; 1.04) 0.97 (0.86; 1.10) 1.14 (0.93; 1.40) Protestant 1.06*(1.02;
1.10)
0.99 (0.96; 1.03)
1.35*(1.24; 1.47)
1.25*(1.15; 1.36)
0.96 (0.81; 1.14)
0.98 (0.87; 1.10) 0.96 (0.85; 1.08) 1.00 (0.81; 1.22) Other religion 1.31*(1.24;
1.39)
1.13*(1.07; 1.20)
2.15*(1.88; 2.45)
2.34*(2.04; 2.68)
0.73 (0.50; 1.05)
0.94 (0.79; 1.12) 0.81*(0.67; 0.98)
0.79 (0.58; 1.08) Urbanization (ref = large city)
Rural 1.01 (0.97; 1.05) 0.86*(0.83; 0.90) 0.98 (0.90; 1.07) 0.91 (0.84; 0.99) 0.90 (0.75; 1.07)
0.94 (0.84; 1.06) 0.91 (0.79; 1.04) 0.89 (0.73; 1.09) Urbanized rural 0.96 (0.90; 1.04) 0.85*(0.79;
0.92) 0.92 (0.78; 1.10) 0.87 (0.73; 1.04) 1.01 (0.72; 1.43)
1.07 (0.85; 1.34) 1.01 (0.78; 1.30) 1.17 (0.80; 1.72)
Urban 1.05*(1.00;
1.10)
1.05*(1.00; 1.11)
1.36*(1.21; 1.52)
1.15*(1.03; 1.29)
0.85 (0.68; 1.06)
1.05 (0.90; 1.23) 1.05 (0.89; 1.24) 0.72*(0.55; 0.94) Father’s occupation (Ref = white collar)
Professional and managerial 1.54*(1.48; 1.60) 1.16*(1.11; 1.21) 1.58*(1.43; 1.75) 1.58*(1.43; 1.75) 0.74*(0.56; 0.97)
1.00 (0.85; 1.17) 0.97 (0.84; 1.12) 1.11 (0.93; 1.32) Farm owners 0.53*(0.49;
0.57) 0.55*(0.50; 0.60) 0.30*(0.25; 0.37) 0.22*(0.18; 0.27) 0.94 (0.62; 1.44)
1.04 (0.84; 1.30) 1.17 (0.84; 1.65) 1.68 (0.99; 2.85) Skilled laborers 0.45*(0.43;
0.46) 0.64*(0.61; 0.66) 0.24*(0.22; 0.26) 0.22*(0.20; 0.24) 1.00 (0.84; 1.19)
0.99 (0.88; 1.10) 1.14 (1.01; 1.29) 1.26 (0.96; 1.66) Unskilled laborers 0.37*(0.36;
0.39) 0.54*(0.51; 0.57) 0.15*(0.13; 0.17) 0.15*(0.13; 0.17) 1.13 (0.94; 1.37)
1.01 (0.87; 1.16) 1.16 (0.98; 1.38) 1.39 (0.93; 2.07) Unknown 0.55*(0.51;
0.58) 0.74*(0.69; 0.79) 0.30*(0.26; 0.35) 0.35*(0.30; 0.40) 1.01 (0.77; 1.32)
1.41 (1.18; 1.68) 1.06 (0.84; 1.33) 1.60*(1.12; 2.28)
scale (log) - - - - -9.685 (-10.08;
-9.29) -10.211 (-10.48; -9.94) -9.996 (-10.28; -9.72) -10.079 (-10.53; -9.63)
shape - - - - 0.085 (0.079;
0.092) 0.090 (0.086; 0.095) 0.086 (0.081; 0.091) 0.083 (0.076; 0.091) Raven: Raven progressive matrices test; Arith.: Arithmetic performance test; Language: language performance test. 95% confidence interval within brackets. Significance:*p<0.05
1.7 additional months moving from lower vocational to lower secondary education, and 1.3 additional months moving from lower vocational to higher education.
Discussion
Our findings confirm a strong selection into education based on individual socio-economic sta-tus and intelligence. This is in agreement with previous findings from the United States where the correlation between IQ scores and years of education is about 0.55, and years of education are also positively correlated with the occupation/education of a child’s parents [28]. We there-fore used a structural model to estimate the independent and combined effects of education and intelligence on life expectancy and show that improvements in education alone are likely to have a significant beneficial impact on life expectancy. These findings are more optimistic than previous reports suggesting that the direct effects of education on mortality may be lim-ited or even absent [15–18].
Table 5. Life expectancy in years (95% CI) at age 18 by education level estimated from simple Gompertz and Structural Models.
Education level
Primary Lower vocational Lower secondary Higher
Simple Gompertz
Factor distribution
Primary 59.5 (59.5; 60.9) 61.7 (60.8; 62.6)
Lower vocational 61.6 (60.8; 62.5) 63.0 (62.0; 64.0)
Lower secondary 63.2 (62.2; 64.2) 66.1 (64.4; 67.7)
Higher 66.4 (64.7; 68.0)
Structural model
Factor distribution
Primary 60.6 (59.8; 61.3) 62.6 (62.1; 63.1)
Lower vocational 62.6 (62.1; 63.1) 62.9 (62.4; 66.0)
Lower secondary 63.2 (62.7; 63.6) 65.1 (64.2; 66.0)
Higher 65.6 (64.7; 66.5)
95% confidence interval within brackets.
doi:10.1371/journal.pone.0141200.t005
Table 6. Decomposition of the estimated gains in expected months lived from age 18 to 66 years into treatment and selection effects, on observ-ables and selection on cognitive ability.
Treatment effect Selection effect
Total Observed Intelligence
From primary to lower vocational 5.7*(4.2; 7.2) 1.0 (-0.6; 2.5) -0.1 (-0.6; 0.5) 1.0 (-0.5; 2.5) From lower vocational to lower secondary −1.2*(-2.1; -0.2) 1.4*(0.4; 2.4) -0.3 (-0.7; 0.1) 1.7*(0.8; 2.7)
From lower secondary to higher 1.4*(0.2; 2.7) 2.1*(0.7; 3.4) 0.7*(0.3; 1.2) 1.3*(0.0; 2.6) Change in expected months lived over the age range 18–66 years. Treatment effect: estimated gain from structural model. Selection effect: remaining difference from implied life expectancy based on Kaplan-Meier curves. Observed: selection effect due to difference in observed individual characteristics. Intelligence: selection effect due to difference in intelligence. 95% confidence interval within brackets. Significance:*p<0.05
Our contribution to the literature is twofold. First, we use an innovative structural model to estimate educational gains in life expectancy accounting for interdependence of intelligence and education and their joint influence on mortality. Second, we apply the model to a large nationally representative study population to obtain accurate and unbiased effect estimates.
The overall mortality from age 18 to the end of the observation period in our study was 12.7%, in close agreement with national estimates based on cohort life tables [27]. For 5.8% of men it was not possible to ascertain vital status at any point in time due to the lack of linkages across databases of information collected at age 18 with current data. These men could have died or could still be living in the Netherlands. As the traced and untraced men did not differ with respect to available demographic and examination characteristics at age 18 we neverthe-less think that our study population provides unbiased effect estimates of the likely benefits of increased education on mortality.
The Raven test is widely used to test military conscripts across the world for its ease of administration and interpretation. At the age of 18, the examinees can be also assumed to have reached the peak of their problem solving skills on the tests of mental performance [40]. There has been a significant increase over time in the mean Raven scores of Dutch military recruits. In 1952, only 0.38% of Dutch recruits had IQs over 140 but this proportion had increased to 9% in 1982 [41]. The reasons for this score increase over time are unclear [40]. IQ score changes over time are not likely to impact on our study findings however because all IQ mea-surements were completed in a narrow time window of less than 3 years and the age at exami-nation for the study population did not change. Although the study group was closely matched on both year of birth and year of examination of IQ scores we nevertheless evaluated the effects of additional adjustments for year of birth and year of examination to exclude any time-related trends and found no changes from our reported estimates.
Although the proportion of individuals lost to follow-up is relatively small, we carried out sensitivity analyses comparing the extreme scenarios under which all individuals lost to follow-up were either assumed to be dead or alive. This did not change the obtained treatment and selection effects. Assuming that missing individuals are in fact alive does increase the calculated life expectancies, but this had no impact on the reported survival differences associated with education levels.
A drawback of our data is that only information on men and not on women is available. Using survey data from a slightly older cohort Bijwaard et al. [26] found that educational gains for women appear to be higher than for men, in spite of the higher survival difference of women with lower vs higher education. However, these findings are based on much smaller numbers than the current study and only use data from one particular province, which is not necessarily representative for the whole country, and therefore need to be interpreted with caution.
The study findings apply to men born 1944–1947 who were examined in the early 1960s and our specific mortality findings may therefore not apply to contemporary populations in the Netherlands. There has been a major change in the education system in the Netherlands in 1968 and some of the specific education strata in this study no longer exist [30]. In addition, the percentage of people with more than six years of post-primary school education is currently much higher compared to the past [42]. These changes are not likely to affect our general con-clusion that increased education can improve survival, but further long term studies will be needed to quantify these effects for contemporary school types.
health outcomes by ethnicity in view of the underrepresentation of many ethnic populations in the higher levels of national education systems. These analyses can further clarify the role of education on health and mortality in specific population groups.
In conclusion, our study aim was to assess the potential gains in life expectancy from increased education accounting for differences in intelligence and found significant positive gains. Our findings confirm the strong selection into education based on socio-economic back-ground and on intelligence but nevertheless show significant beneficial gains from increased education.
For future research, we hope that similar analyses will be carried out in other countries with comparable data. Comparisons of study findings may then allow further specifications of the impact of education on survival inequalities over time. The continued analysis of this aging study population in the Netherlands will provide more refined estimates of education effects on survival, including cause-specific mortality, to the large group of men who live beyond the age of 66 years.
Supporting Information
S1 Appendix.
(PDF)
S1 Table.
(PDF)
Acknowledgments
This study was supported in part by US National Institutes of Health grant RO1-AG028593 (Principal Investigator: Dr. L. H. Lumey).
Author Contributions
Analyzed the data: GEB. Contributed reagents/materials/analysis tools: GEB PE. Wrote the paper: GEB FvP LHL PE.
References
1. Preston SH, Hill ME, Drevenstedt G. Childhood conditions that predict survival to advanced ages among African-Americans. Social Science and Medicine. 1998; 47:1231–1246. PMID:9783866
2. Hayward MD, Gorman BK. The long arm of childhood: The influence of early-life conditions on men’s mortality. Demography. 2004; 41:87–107. doi:10.1353/dem.2004.0005PMID:15074126
3. Strand BH, Kunst AE. Childhood socioeconomic position and cause-specific mortality in early adult-hood. American Journal of Epidemiology. 2007; 165:85–93. doi:10.1093/aje/kwj352PMID:17041134
4. Meara E, Richards S, Cutler DM. The Gap Gets Bigger: Changes in Mortality and Life Expectancy, By Education, 1981–2000. Health Affairs. 2008; 27(2):350–360. doi:10.1377/hlthaff.27.2.350PMID: 18332489
5. Mackenbach JP, Stirbu I, Roskam AJR, Schaap MM, Menvielle G, Leinsalu M, et al. Socioeconomic Inqualities in Health in 22 European Countries. New England Journal of Medicine. 2008; 358:2468– 2481. doi:10.1056/NEJMsa0707519PMID:18525043
6. Huisman M, Kunst AE, Bopp M, Borgan JK, Borrell C, Costa G, et al. Educational inequalities in cause-specific mortality in middle-aged and older men and women in eight western European populations. Lancet. 2005; 365(9458):493–500. PMID:15705459
7. Bruggink JW. Ontwikkelingen in de (gezonde) levensverwachting naar opleidingsniveau. Bevolking-strends. 2009; 57(4):71–74.
9. Mazumder B. The Effects of Education on Health and Mortality. Nordic Economic Policy Review. 2012; 1:261–301.
10. Deary IJ. Why do intelligent people live longer? Nature. 2008; 456:175–176. doi:10.1038/456175a PMID:19005537
11. Batty G, David G. Early life Intelligence and Adult Health. British Medical Journal. 2004; 329 (7466):585–586. doi:10.1136/bmj.329.7466.585PMID:15361422
12. Batty G, David G, Deary IJ, Gottfredson LS. Premorbid (early life) IQ and Later Mortality Risk: System-atic Review. Annals of Epidemiology. 2007; 17(4):278–288. doi:10.1016/j.annepidem.2006.07.010 PMID:17174570
13. Calvin CM, Deary IJ, Fenton C, Roberts BA, Der G, Leckenby N, et al. Intelligence in youth and all-cause-mortality: Systematic review with meta-analysis. International Journal of Epidemiology. 2011; 40 (3):626–640. doi:10.1093/ije/dyq190PMID:21037248
14. Deary IJ, Johnson W. Intelligence and education: causal perceptions drive analytic processes and therefore conclusions. International Journal of Epidemiology. 2010; 39:1362–1369. doi:10.1093/ije/ dyq072PMID:20504860
15. Mazumder B. Does Education Improve Health: A Reexamination of the Evidence from Compulsory Schooling Laws. Economic Perspectives. 2008; 33:2–16.
16. Van Kippersluis H, O’Donnell O, van Doorslaer E. Long Run Returns to Education: Does Schooling lead to an Extended Old Age? Journal of Human Resources. 2011; 46(4):695–721. doi:10.1353/jhr. 2011.0006
17. Meghir C, Palme M, Simeonova E. Education, Cognition and Health: Evidence from a Social Experi-ment. NBER; 2013.
18. Clark D, Royer H. The Effect of Education on Adult Mortality and Health: Evidence from Britain. Ameri-can Economic Review. 2013; 103(6):2087–2120. doi:10.1257/aer.103.6.2087
19. Huisman M, Kunst AE, Mackenbach JP. Intelligence and socioeconomic inequalities in health. Lancet. 2005; 365(9488):807–808. doi:10.1016/S0140-6736(05)67212-1
20. Goldman DP, Smith JP. Can Patient Self-Management Help Explain the SES Health Gradient? Pro-ceedings of the National Academy of Science. 2002; 99:10929–10934. doi:10.1073/pnas.162086599
21. Lleras-Muney A, Lichtenberg F. Are the More Educated More Likely to Use New Drugs. Annales d’Eco-nomie et Statistique. 2005; 80:671–696.
22. Glied S, Lleras-Muney A. Technological Innovation and Inequality in Health. Demography. 2008; 45 (3):741–761. doi:10.1353/dem.0.0017PMID:18939670
23. Auld MC, Sidhu N. Schooling, Cognitive Ability and Health. Health Economics. 2005; 14(10):1019– 1034. doi:10.1002/hec.1050PMID:16167318
24. Conti G, Heckman JJ. Understanding the Early Origins of the Education-Health Gradient: A Framework That Can Also Be Applied to Analyze Gene-Environment Interactions. Perspectives on Psychological Science. 2010; 5:585–605. doi:10.1177/1745691610383502PMID:21738556
25. Conti G, Heckman JJ, Urzua S. The Education-Health Gradient. American Economic Review. 2010; 100:234–238. doi:10.1257/aer.100.2.234PMID:24741117
26. Bijwaard GE, van Kippersluis H, Veenman J. Education and Health: the Role of Cognitive Ability. Jour-nal of Health Economics. 2015; 42:29–43. doi:10.1016/j.jhealeco.2015.03.003PMID:25912224
27. Ekamper P, van Poppel F, Stein AD, Lumey LH. Independent and additive association of prenatal fam-ine exposure and intermediary life conditions with adult mortality between age 18–63 years. Social Sci-ence & Medicine. 2014; 119:232–239. doi:10.1016/j.socscimed.2013.10.027
28. Neisser U, Boodoo G, Jr TJB, Boykin AW, Brody N, Ceci SJ, et al. Intelligence: knowns and unknowns. American psychologist. 1996; 51(2):77–101. doi:10.1037/0003-066X.51.2.77
29. Schröder H, Ganzeboom HBG. Measuring and Modelling Level of Education in European Societies. European Sociological Review. 2014; 47(9):119–136.
30. Vrooman JC, Dronkers J. Changing Educational Attainment Processes: Some Evidence from the Neth-erlands. Sociology of Education. 1986; 59(2):69–78. doi:10.2307/2112432
31. Doornbos G, Kromhout D. Educational level and mortality in a 32-year follow-up study of 18-year-old men in The Netherlands. International Journal of Epidemiology. 1990; 19:374–379. doi:10.1093/ije/19. 2.374PMID:2376450
32. Stein ZA, Susser MW, Saenger G, Marolla F. Nutrition and mental performance. Science. 1972; 178:706–713. doi:10.1126/science.178.4062.708
34. Heligman I, Pollard JH. The age pattern of Mortality. Journal of the Institute of Actuaries. 1980; 107:49– 80. doi:10.1017/S0020268100040257
35. Lenart A. The Moments of the Gompertz Distribution and the Maximum likelihood of its parameters. Scandinavian Actuarial Journal of the Institute of Actuaries. 2014; 3:255–277. doi:10.1080/03461238. 2012.687697
36. Gavrilov LA, Gavrilova NS. The Biology of Life Span: A Quantitative Approach. New York: Harwood Academic Publisher; 1991.
37. Ceci SJ. How much does schooling influence general intelligence and its cognitive components? a reassessment of the evidence. Developmental Psychology. 1991; 27:703–722. doi: 10.1037/0012-1649.27.5.703
38. Klein JP, Moeschberger ML. Survival Analysis: Techniques for Censored and Truncated Data. New York: Springer–Verlag; 1997.
39. Kaplan EL, Meier P. Nonparametric Estimation from Incomplete Observations. Journal of the American Statistical Association. 1958; 53:457–481. doi:10.1080/01621459.1958.10501452
40. Flynn JR. Massive IQ gains in 14 nations: What IQ tests really measure. Psychological Bulletin. 1987; 101:171–191. doi:10.1037/h0090408
41. de Leeuw J, Meester AC. Over het intelligentie onderzoek bij de militaire keuringen vanaf 1925 tot heden (Intelligence—as tested as selectections for the military service from 1925 to the present). Mens en Maatschappij. 1984; 59:5–26.