doi: 10.1590/0101-7438.2017.037.02.0333
MULTICRITERIA ANALYSIS OF FOOTBALL MATCH PERFORMANCES: COMPOSITION OF PROBABILISTIC PREFERENCES APPLIED
TO THE ENGLISH PREMIER LEAGUE 2015/2016
Vitor Principe
1*, Luiz Oct´avio Gavi˜ao
4, Roberto Henriques
1, Victor Lobo
1,2,3,
Gilson Brito Alves Lima
4and Annibal Parracho Sant’anna
4Received November 22, 2016 / Accepted July 5, 2017
ABSTRACT.This article aims to analyze the technical performance of football teams in the FA Premier League during the 2015/2016 season. Data of twenty clubs over 38 matches for each club are considered us-ing 23 variables. These variables have been explored in the football literature and address different features of technical performance. The different configuration of the data for teams in detached segments motivated the multi-criteria approach, which enables identification of strong and weak sectors in each segment. The uncertainty as to the outcome of football matches and the imprecision of the measures indicated the use of Composition of Probabilistic Preferences (CPP) to model the problem. “R” software was used in the mod-eling and computation. The CPP global scores obtained were more consistent with the final classification than those of other methods. CPP scores revealed different performances of particular groups of variables indicating aspects to be improved and explored.
Keywords: match analysis, probabilistic composition of preferences, football.
1 INTRODUCTION
Performance in football has been described as a construct with interaction between individual and collective levels (Bradley et al., 2011). Results of football matches, for example, provide objective measures of both player and team performance. Interactions within the team due to cooperation based on a strategic plan, situational variables and constraints provided by the gen-eral context of the game can be considered (Besters, van Ours & van Tuijl, 2016).
*Corresponding author.
1NOVA IMS – Nova Information Management School, Campus de Campolide, 1070-312 Lisboa, Portugal. E-mails: [email protected]; [email protected]; [email protected]; [email protected] 2Escola Naval Portuguesa, Base Naval de Lisboa, Alfeite 2810-001 Almada, Portugal.
3CINAV – Centro de Investigac¸˜ao Naval, Base Naval de Lisboa, Alfeite 2810-001 Almada, Portugal.
The analysis of actions performed in a match context produces quantitative data that may become relevant information to support coaches’ decisions (Carling, Williams & Reilly, 2005). Techni-cal elements of player performance in football are measured by notational systems, designed to register and store information on players’ actions, in order to identify patterns of play and crit-ical elements of performance. For football analysis, these systems provide statistics related to players’ actions (passing, shots on goal, fouls, etc.) that may provide varied information about the success of the teams (Woods, Raynor, Bruce, McDonald & Robertson, 2016).
The related literature shows contradictions between the performance of players in the execution of expected actions and the successful and unsuccessful results of the teams. This happens, for instance, with the strategy of direct play, which is described as few passes per team possession and identified by attacks involving at least one long pass, attacks with a maximum of two passes, and fast-moving attacks. Possibly, the long pass abilities and skill of players influence the effec-tiveness of direct play strategy (Fernandez-Navarro, Fradua, Zubillaga & Ford, 2016).
Other studies suggest that counter-attacks are more effective than planned attacks when playing against an unbalanced defense (Tenga, Holme, Ronglan & Bahr, 2010). Furthermore, Lago-Ballesteros & Lago-Pe˜nas (2010) reported that successful teams usually touch the ball more often. In this way, ball possession has also been reported as a variable decisively affecting the performance of football teams.
Most of these studies used manual notation and computer systems to process the data. In the same way, football coaches use notational analysis to evaluate their team and opponent teams’ players. A notation system enables an assessment of the relative merits of team and player per-formance, becoming the first step towards performance analysis (Eaves, 2015).
However, these studies access a huge amount of raw data, which is quite difficult to analyze in order to determine which teams had the best performance. In addition, uncertain outcomes and imprecise data are common in the football environment. A statistical approach, allowing for the use of estimation and simulation techniques would provide results whose uncertainty could be measured. That would certainly be strongly welcome. Nevertheless, by now, the lack of reliable models for this field makes unfeasible such a statistical approach. Instead we take here a multicriteria decision analysis (MCDA) approach.
To take into account uncertainty we apply Composition of Probabilistic Preferences (CPP), a technique that uses probabilistic reasoning to combine preferences according to separate criteria. To do that, the evaluations by the separated criteria are modeled as random variables. The appli-cation of CPP is compared to the appliappli-cation of two methods based on the use of fuzzy numbers instead of crisp numbers for the values and weights of the criteria in well known exact MCDA methods: Fuzzy MULTIMOORA Method and Fuzzy VIKOR Method.
These objectives are to discuss the relevance of the imprecise factors evaluated to predict the ranking of the teams at the end of the competition. CPP is used to obtain an analysis of the teams’ performances in the competition, especially taking into account the decisions that may be taken to improve the performance of each team. First, it is shown how a suitable point of view in the probabilistic composition better fits the final ranking of FA Premier League season 2015/2016.
CPP is first applied on the whole set of 23 variables considered in the study taken together and, after that, on three groups of technical performance variables separately. In this last analysis, the teams are evaluated from the perspectives of goal attempts, offensive moves and defensive actions, three phases which occur in the development of a football match and are important for the knowledge and development of each team. In this way, finding out in which of the phases of the game the team has the best or the worst performance can change the way the coaches may improve their training section.
This study is organized as follows. In the next section, the methods employed including CPP, fuzzy numbers, fuzzy MULTIMOORA, fuzzy VIKOR and correlation analysis, are introduced Section 3 presents the data. The results obtained are discussed in Section 4. Finally, a section of conclusions is presented.
2 TECHNIQUES AND METHODS
In this section a brief review of the techniques employed is presented.
2.1 Composition of Probabilistic Preferences
CPP is a multi-criteria (MC) decision support method introduced by Sant’Anna & Sant’Anna (2001) that was recently expanded to different applications in decision support by Sant’Anna (2015). In general, MC methods intend to help decision-makers dealing with several possibilities in a choice set. The MC problems usually lead to a compromise between conflicting criteria, such as quality and cost, for instance. In particular, CPP has been applied to MC analysis in sport sciences (Sant’Anna & Soares de Mello, 2012).
CPP adopts a probabilistic approach to MC decision problems. The majority of MC methods apply deterministic or fuzzy evaluations of alternatives under different criteria (Mardani, Jusoh, Zavadskas, Khalifah & Nor, 2015). On the other hand, CPP explores the uncertainty that is in-evitably present in preference evaluations in real problems. This uncertainty may result from processes involving expert reviews, inaccurate performance measures or processes with imper-fect metric systems, among others. Adopting a probabilistic framework, the evaluation of each alternative takes the form of a probability function and the final ranking is derived from proba-bilities of being the best alternative (Garcia & Sant’Anna, 2015).
‘10’. The randomization procedure changes this measurement into a probability distribution. In this case, a normal disturbance was assumed as a general behavior for evaluating alternative ‘A’, and the value ‘10’ as a mode of this probability distribution. In summary, the value is taken as a single measure of location in a probability distribution that reflects the uncertainty and impreci-sion of the model (Sant’Anna, 2015).
Figure 1– CPP first stage. (Gavi˜ao, Silva, Sant’Anna & Lima (2016)).
The randomization may derive froma prioriinformation obtained in similar contexts. For ex-ample, failure rates in reliability problems are generally adjusted by Exponential, Weibull or Birnbaum-Saunders distributions (Chiodo & Lauria, 2015). For a data set of preferences, the probability function can be obtained from goodness-of-fit tests for density estimation (Delignette-Muller & Dutang, 2014). Disturbances can also be described by non-parametric or empirical distributions, in the case of abundant data (Millard, 2013).
In the second stage, the joint probabilities Mi j andmi j are computed. Mi j and mi j denote,
respectively, the probability of thei-th alternative being the best and the worst alternative ac-cording to the j-th criterion. In other words, ‘M’ refers to maximizing and ‘m’ to minimizing the preferences. Equations (1) and (2) describe the mathematical development to computeMi j
andmi j.
Mi j =
DXi
FX−i(x−i)
fXi(xi)d xi (1)
mi j =
DXi
1−FX−i(x−i)
fXi(xi)d xi (2)
In equations (1) and (2),FXindicates the cumulative distribution function (cdf), fXthe
probabil-ity densprobabil-ity function (pdf) and DX i the support of thei-th alternative. The notation ‘-i’ indicates
all alternatives under the same j-th criterion, except thei-th alternative, which is the considered alternative to computeMi jandmi j (Sant’Anna, Costa, Nepomuceno & Pereira, 2016).
In the third stage, the joint probabilities ‘Mi j’ and ‘mi j’ are composed according to different
Figure 2– Composition by axis. (Adapted from Gavi˜ao, Silva, Sant’Anna & Lima (2016)).
Table 1– Third CPP stage equations.
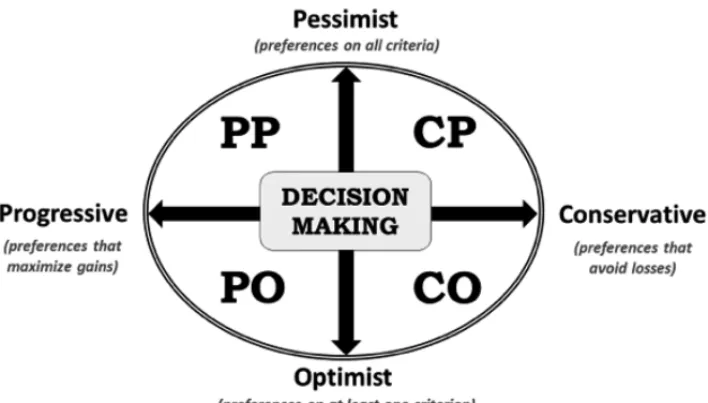
Decision-Maker’s
Pessimist Optimist
Point of View
Progressive P Pi=j=1,...,nMi j P Oi =1−j−1,...,n(1−Mi j) Conservative C Pi =j=1,...,n(1−mi j) C Oi =1−j−1,...,nmi j
Sant’Anna (2015).
The global scores are computed using the equations in Table 1. The global score ranking gives the final preference for each alternative. The equations reflect all decision-maker points of view, under the hypothesis of independence between all the criteria. If a correlation can be quantified, it can be introduced into the combinations. However, quantifying correlation among criteria is not an easy task, because it requires the detection of reciprocal influence between errors in the measurement of variables. For more details on the different assumptions regarding correlation between criteria, the reader is referred to Sant’Anna (2015, Section 5.2).
The progressive-conservative axis uses ‘Mi j’ or ‘mi j’ as parameters to compose the
decision-maker points of view, as depicted in Figure 2. The Progressive approach involves the concept of ‘maximizing gains’, plotting the decision at the frontier of excellence. For a positive-impact criterion, a progressive decision requires the use of ‘Mi j’ to combine criteria and for a
negative-impact criterion, the use of ‘mi j’ is needed.
a conservative approach requires the use of ‘mi j’ to combine criteria and for a negative-impact
criterion, the use of ‘Mi j’ is expected.
The optimist-pessimist axis refers to the combination of ‘Mi j’ and ‘mi j’ as strict preferences for
all criteria or satisfying at least one of the multiple criteria (Sant’Anna, 2015).
2.2 Triangular Fuzzy Number
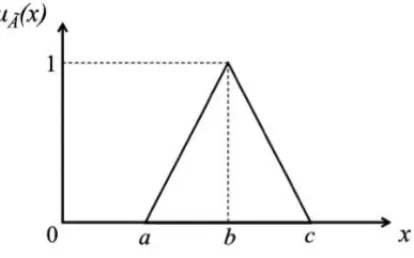
Fuzzy sets theory was developed by Zadeh (1965). The fuzzy logic has been applied to combine evaluations given by fuzzy sets in different fields of knowledge (Mardani, Jusoh & Zavadskas, 2015). A fuzzy number A˜ = (a,b,c), as designed in Figure 3, is called a triangular fuzzy number (TFN). The membership functionµA˜(x)denotes the degree of truth that the fuzzy value
is equal tox within the real interval(lower, upper). The TFN A˜ has the corebwithµA˜(b) =
1 and the support [a,c]. Fuzziness allows a membership µ of an object to a fuzzy set vary within an interval (0,1), whereas Boolean sets allow only either a full membership or a full non-membership (Almeida, Yamakami & Takahashi, 2006; Silva, 2008).
Figure 3– Triangular Fuzzy Number. (Silva (2008)).
The TFN membership functionFA(x) has the following form, in Equations (3):
µA˜(x)=
⎧ ⎪ ⎨
⎪ ⎩
(x−a)/(b−a),x ≤b (c−x)/(c−b),x≥b
0,x∈ [a/ ,c]
(3)
Mathematical operations on a generic M˜ TFN are defined from Equation (4) to (12) (Opricovic, 2011):
Summation
n
i−1
⊕ ˜Ni =
n
i=1
ai, n
i=1
bi, n
i=1
ci
(4)
Scalar summationN˜ ⊕k=(a+k,b+k,c+k) (5)
SubtractionN˜1andN˜2=(a1−a2,b1−b2,c1−c2) (6)
Scalar multiplicationk · ˜N=(k · a,k ·b,k ·c), fork≥0 (8)
MultiplicationN˜1⊗ ˜N2=(a1 · a2,b1 · b2,c1 · c2), fora1≥0 (positiveN˜1) (9) Scalar divisionN˜/k=(a/k,b/k,c/k), fork>0 (10)
Operator MAXM AX i
˜
Ni =(max
i ai,maxi bi,maxi ci) (11)
Operator MINM I N i
˜
Ni =(min
i ai, mini bi,mini ci) (12)
2.3 The Fuzzy Multimoora Method
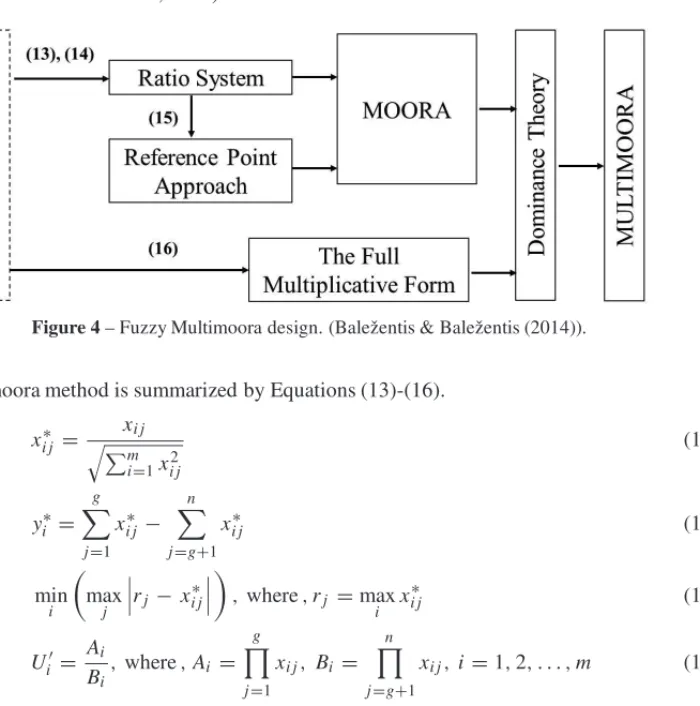
The multi-objective optimization by ratio analysis (MOORA) method was introduced by Brauers & Zavadskas (2006) on the basis of previous research. Later, the method was extended into a more robust design, by adding a full multiplicative form to MOORA (Brauers & Zavadskas, 2010). The MULTIMOORA method is described in Figure 4, with indications of its four Equa-tions (Baleˇzentis & Baleˇzentis, 2014).
Figure 4– Fuzzy Multimoora design. (Baleˇzentis & Baleˇzentis (2014)).
The Multimoora method is summarized by Equations (13)-(16).
xi j∗ = xi j
m
i=1xi j2
(13)
yi∗= g
j=1
xi j∗ − n
j=g+1
x∗i j (14)
min i max j
rj −x
∗ i j
,where,rj =max i x
∗
i j (15)
Ui′= Ai Bi
,where,Ai = g
j=1
xi j, Bi = n
j=g+1
xi j,i =1,2, . . . ,m (16)
Application of the MOORA method begins with a decision matrix, X, wherexi j denotes the
evaluation of the i-th alternative with respect to the j-th objective (i = 1,2, . . . ,m and
approach. Equation (13) describes the ratio system, which is basically a data normalization. In Equation (14), thexi jvalues are added (if desirable value of indicator is maximum) or subtracted
(if desirable value is minimum), to yield a summarizing index yi. The reference point approach
produces a final rank derived from the deviations from the reference point, applying themin-max
metric of Tchebycheff, as depicted in Equation (15) (Brauers & Zavadskas, 2010, 2012). The overall utility of thei-th alternative can be expressed as a dimensionless numberU, in Equa-tion (16). By this way, MULTIMOORA summarizes MOORA (i.e. ratio system and reference point) and the full multiplicative form (Baleˇzentis & Baleˇzentis, 2014).
Following the general practice to extend deterministic MCDA methods into the fuzzy envi-ronment, the Fuzzy MULTIMOORA method, introduced by Brauers, Baleˇzentis & Baleˇzentis (2011), is built replacing the initial crisp evaluations by fuzzy numbers and the numeric opera-tions by fuzzy logic operaopera-tions. A detailed description of all adaptaopera-tions from the crisp approach to the Fuzzy MULTIMOORA can also be addressed at Baleˇzentis & Baleˇzentis (2014).
2.4 Fuzzy Vikor Method
The VlseKriterijuska Optimizacija I Komoromisno Resenje(VIKOR) method has been devel-oped as an MCDM method to solve a discrete multicriteria problem with non-commensurable and conflicting criteria (Opricovic, 1998, 2011). The foundation for a compromise solution was established by Yu (1973), Duckstein & Opricovic (1980) and Zeleny (1982). The method de-termines a compromise ranking-list, the compromise solution, and the weight stability intervals for preference stability of the compromise solution obtained with the initial (given) weights. In providing such a compromise solution, VIKOR applies the concepts of “acceptable advantage” and “acceptable stability” to determine the maximum “group utility of the majority” and the minimum “individual regret of the opponent” (Anvari, Zulkifli, & Arghish, 2014; Opricovic & Tzeng, 2004), which are combined in a final score. The extension of VIKOR to determine a fuzzy compromise solution adopted in the present application is presented in Opricovic (2007).
The compromise-ranking algorithm of VIKOR consists of five steps. The notation, proposed by Anvari et al. (2014), is described in Equations (17) to (24). Step 1 describes the basic phase of every MCDM method, regarding the formation of a decision matrix. The alternatives are denoted byA1,A2, . . .Ai, . . .Am, wheremis the number of alternatives. The weight of thej-th
criterion, expressing the relative importance of the criteria, is denotedwj, where j =1,2, . . . ,n,
forn representing the number of criteria. The rating (performance score) by the j-th criterion is denoted by fi j for alternative Ai. In Step 2, the best fi∗and the worst fj−values of all criteria
are computed according as thei-th is a benefit criterion (positive impact to the final solution) – in Equation (17), or a cost criterion (negative impact to the final solution) – in Equation (18).
Benefit criterion fi∗=max(fi j, j =1, . . . ,n), fj−=min(fi j, j=1, . . . ,n) (17)
Cost criterion fi∗=min(fi j, j=1, . . . ,n), fj−=max(fi j, j =1, . . . ,n). (18)
In Step 3, the values of a utility measure Sj and a regret measure Rj are obtained, using the
maximum group utility, whereasRi emphasizes the minimum value among the maximum
indi-vidual regrets
Sj= n
j=1
wj(fj∗− fi j)(fj∗− f
−
j ) (19)
Rj =Max
wj(fj∗− fi j)(fj∗− f
−
j
. (20)
In Step 4, Qj indices are evaluated, using the relation in Equations (21) and (22). The values
ofS∗may also use the best optionS∗ = 0 andS−the worst valueS− =1. For R∗ andR−, the best R∗ = 0 or the worstR− = 1 can also been chosen. The parameterv(0 ≤ v ≤ 1)is introduced as a weight for the strategy of maximum group utility, whereas(1−v)is the weight of the individual regret. In other words, the increase ofvemphasizes group utility (i.e.v >0.5), whereasv≈0.5 reflects consensus andv <0.5 a veto. A way to computevis by the formulae
(n+1)/2.n, as proposed by Opricovic (2011). This latter approach was used in the present study leading to a value ofvof 0.522)
Qi =v(Si −S−)(S∗−S−)+(1−v)(Si−R−)(R∗−R−) (21)
S−=min SiS∗=min Si R− =min Ri R∗=min Ri. (22)
In Step 5, theR,S andQapproaches are combined using the two conditions in Equation (23) and the definition (24),
Condition 1: Q(A2)−Q(A1)≥(1/(n−1)) (23)
whereA1andA2denote the best and the second best alternatives according to theQindices
Condition 2: A1is also the best in at least one of theRand theSrankings. (24)
Condition 1 refers to an acceptable advantage and Condition 2 reflects an acceptable stability in the decision making process, whereA1is also the best in at least one of theRand theSrankings. AlternativeA1is chosen if Conditions 1 and 2 are satisfied. If one of these two conditions is not satisfied, then a set of compromise solutions is proposed: (1) AlternativesA1 andA2, if only Condition 2 is not satisfied; (2) All the alternativesAfor whichQ(A)−Q(A1) <1/(n−1)if Condition 1 is not satisfied (Anvari et al., 2014).
2.5 Kendall and Spearman Nonparametric Correlation Indices
Kendall and Spearman indices are used to access the correlation between two variables calculated in a set of N alternatives. The Kendall coefficient was developed by (Kendall, 1938). This coefficient is identified with the Greek letterτ (tau). In Equation (25), the notationNcrepresents
the amount of pairs of alternatives evaluated for which the ordinal positions are concordant, whileNdindicates the number of discordant pairs. A pair of alternatives is count as concordant
whenever the differences between their ordinal positions by the two variables have the same sign and is count as discordant if these differences have different signs. The denominator of equation (25) indicates the amount of possible pairs of alternatives.
τ = Nc−Nd N(N−1)
2
(25)
The Spearman coefficient is defined in Equation (26), and is represented by the Greek letterρ
(rho). In fact, the Spearman coefficient formula is similar to Pearson’s. The difference comes from the use of ranksRX andRY, instead ofX andY original values. The Spearman coefficient
is obtained from the division between the covariance of RX and RY and the product of their
standard deviations (Spearman, 1904).
ρ= cov(RX,RY)
σRXσRY (26)
The Kendall and Spearman coefficients are among the most commonly used ordinal correlation techniques in statistics (Gibbons & Chakraborti, 2011; Hauke & Kossowski, 2011). These non-parametric methods perform the calculations from the ranks obtained after ordering by the two variables. The correlation results vary in the range[1,−1], in which “−1” depicts the highest negative correlation and “1” the maximum positive correlation. The null value indicates no cor-relation between the ranks. In Tables 5, 7 and 9 in the next section, the ranks corresponding from the scores obtained by different multicriteria methods are employed to evaluate Kendall and spearman correlation coefficients with the PL ranking.
Similar results would be obtained by employing the nonparametric tests based on these statistics as in Leoneti (2016).
2.6 Data Collection
The data used in the study were from all 38 rounds of the FA Premier League season 2015/2016. Official Premier League performance data are collected and analyzed by Opta (optasports.com), part of Perform Content, a division of Perform Group (performgroup.com).
site (premierleague.com/tables). To perform the proposed analysis, the actions of the players during each match were organized by team.
In the Premier League website, a total of 30 variables divided into an attack, defense, discipline and team play can be found. Specifically, 23 discrete technical performance variables were se-lected for extraction, based on their reporting in previous literature and the perception of their importance by the authors. The variables collected by Opta that are not used in previous studies and are considered in the present study are Big Chances Created, Hit Woodwork, Clean Sheets are Headed Clearance, which have positive impacts and Errors Leading to Goal and Own Goals, with negative impacts.
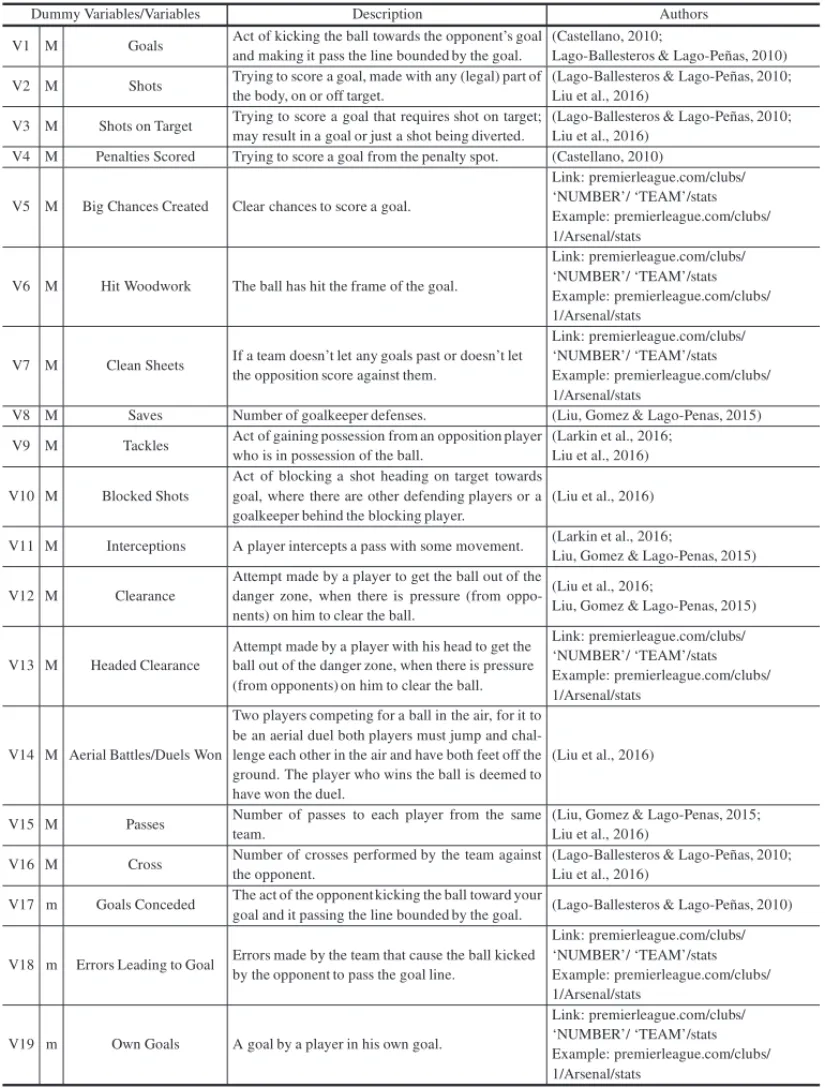
Table 2 presents a description of the variables employed in the analyses and a source in the literature asserting their importance. For the six variables introduced due to the perception of the authors, a link to the Premier League data is presented.
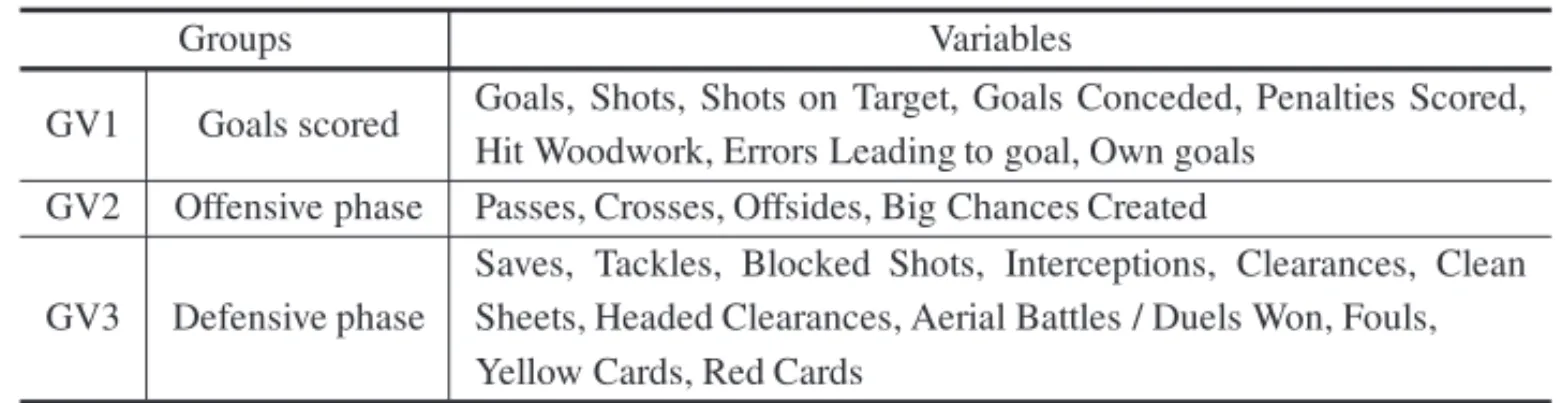
The 23 variables in Table 2 were grouped in three sets, as described in Table 3. These groups of variables were explored by several authors, such as Lago-Ballesteros & Lago-Pe˜nas (2010); Liu, Gomez & Lago-Penas (2015); Sgro et al. (2015) and Liu et al. (2016), in order to express a team behavior by distinctive phases during a football match.
2.7 Data Analysis
CPP was applied in two types of analyses. First, the global performance was determined con-sidering all 23 variables together as independent criteria. The Fuzzy MMOORA and the Fuzzy VIKOR, as described in the Section 2, were applied to the same data set to compare perfor-mances. A correlation with the official rank of Premier League, season 2015-2016, was a proxy measure to check the adequacy of these methods to the context, as detailed also in Section 2.
The second analysis consisted of using CPP with three dimensions of variables and combining the results thus obtained. The groups of variables (GV) are described in Table 3. Each team received a specific score for each GV. Finally, their GV scores were inputs for another round of composition by CPP. This last stage created a new global ranking. Appendices I to V list the joint probabilitiesMi jandmi j and the final scores, according to points of view described in the
Table 1.
Triangular distributions were used in CPP and TFN in the fuzzy MCDA methods, as depicted in Section 2.2. The triangular distribution is a fair approximation to support decision-making in cases where the lowest, highest, and most likely values are available to describe the behavior of a random variable TFN, on the other side, are the most natural way to fuzzify exact measurements.
Table 2– Variables, description and references used in the analyses.
Dummy Variables/Variables Description Authors
V1 M Goals Act of kicking the ball towards the opponent’s goal and making it pass the line bounded by the goal.
(Castellano, 2010;
Lago-Ballesteros & Lago-Pe˜nas, 2010)
V2 M Shots Trying to score a goal, made with any (legal) part of the body, on or off target.
(Lago-Ballesteros & Lago-Pe˜nas, 2010; Liu et al., 2016)
V3 M Shots on Target Trying to score a goal that requires shot on target; may result in a goal or just a shot being diverted.
(Lago-Ballesteros & Lago-Pe˜nas, 2010; Liu et al., 2016)
V4 M Penalties Scored Trying to score a goal from the penalty spot. (Castellano, 2010)
V5 M Big Chances Created Clear chances to score a goal.
Link: premierleague.com/clubs/ ‘NUMBER’/ ‘TEAM’/stats Example: premierleague.com/clubs/ 1/Arsenal/stats
V6 M Hit Woodwork The ball has hit the frame of the goal.
Link: premierleague.com/clubs/ ‘NUMBER’/ ‘TEAM’/stats Example: premierleague.com/clubs/ 1/Arsenal/stats
V7 M Clean Sheets If a team doesn’t let any goals past or doesn’t let the opposition score against them.
Link: premierleague.com/clubs/ ‘NUMBER’/ ‘TEAM’/stats Example: premierleague.com/clubs/ 1/Arsenal/stats
V8 M Saves Number of goalkeeper defenses. (Liu, Gomez & Lago-Penas, 2015)
V9 M Tackles Act of gaining possession from an opposition player who is in possession of the ball.
(Larkin et al., 2016; Liu et al., 2016)
V10 M Blocked Shots
Act of blocking a shot heading on target towards goal, where there are other defending players or a goalkeeper behind the blocking player.
(Liu et al., 2016)
V11 M Interceptions A player intercepts a pass with some movement. (Larkin et al., 2016;
Liu, Gomez & Lago-Penas, 2015)
V12 M Clearance
Attempt made by a player to get the ball out of the danger zone, when there is pressure (from oppo-nents) on him to clear the ball.
(Liu et al., 2016;
Liu, Gomez & Lago-Penas, 2015)
V13 M Headed Clearance
Attempt made by a player with his head to get the ball out of the danger zone, when there is pressure (from opponents) on him to clear the ball.
Link: premierleague.com/clubs/ ‘NUMBER’/ ‘TEAM’/stats Example: premierleague.com/clubs/ 1/Arsenal/stats
V14 M Aerial Battles/Duels Won
Two players competing for a ball in the air, for it to be an aerial duel both players must jump and chal-lenge each other in the air and have both feet off the ground. The player who wins the ball is deemed to have won the duel.
(Liu et al., 2016)
V15 M Passes Number of passes to each player from the same team.
(Liu, Gomez & Lago-Penas, 2015; Liu et al., 2016)
V16 M Cross Number of crosses performed by the team against the opponent.
(Lago-Ballesteros & Lago-Pe˜nas, 2010; Liu et al., 2016)
V17 m Goals Conceded The act of the opponent kicking the ball toward your
goal and it passing the line bounded by the goal. (Lago-Ballesteros & Lago-Pe˜nas, 2010)
V18 m Errors Leading to Goal Errors made by the team that cause the ball kicked by the opponent to pass the goal line.
Link: premierleague.com/clubs/ ‘NUMBER’/ ‘TEAM’/stats Example: premierleague.com/clubs/ 1/Arsenal/stats
V19 m Own Goals A goal by a player in his own goal.
Link: premierleague.com/clubs/ ‘NUMBER’/ ‘TEAM’/stats Example: premierleague.com/clubs/ 1/Arsenal/stats
Table 2– (Continuation).
Dummy Variables/Variables Description Authors
V20 m Yellow Cards Where a player is booked by the referee due to illegal actions.
(Lago-Ballesteros & Lago-Pe˜nas, 2010; Liu, Gomez & Lago-Penas, 2015; Liu et al., 2016)
V21 m Red Cards Where a player is booked by the referee due to more severe illegal actions, or after a first yellow card.
(Lago-Ballesteros & Lago-Pe˜nas, 2010; Liu et al., 2016)
V22 m Fouls Where a player is fouled by an opponent. (Lago-Ballesteros & Lago-Pe˜nas, 2010; Liu, Gomez & Lago-Penas, 2015)
V23 m Offside When the ball is passed to a player ahead of all
outfield players of the opponent team. (Lago-Ballesteros & Lago-Pe˜nas, 2010)
Adapted by the authors.
Table 3– Three Groups of Performance Variables.
Groups Variables
GV1 Goals scored Goals, Shots, Shots on Target, Goals Conceded, Penalties Scored, Hit Woodwork, Errors Leading to goal, Own goals
GV2 Offensive phase Passes, Crosses, Offsides, Big Chances Created
GV3 Defensive phase
Saves, Tackles, Blocked Shots, Interceptions, Clearances, Clean Sheets, Headed Clearances, Aerial Battles / Duels Won, Fouls, Yellow Cards, Red Cards
Adapted by the authors.
3 RESULTS AND DISCUSSION
The rankings derived from probabilistic scores are presented in Table 4 for FA Premier League 2015/2016 season. The scores were initially calculated based on the 23 variables taken together and then for the groups of variables.
These global scores represent the probabilities of having the largest value in all variables, cor-responding to the pessimistic progressive point of view. The decision maker in the pessimistic progressive (PP) point of view pays attention to maximizing the probabilities of preference ac-cording to all the criteria examined. The progressive decision maker pays greater attention to small differences between the best values; in sports, this reflects the idea that the teams are ori-ented to seek the victory in the game. The conservative decision maker is associated with the idea of avoiding losses, which in football is important for the teams avoiding relegation.
The data base was also submitted to the Fuzzy MULTIMOORA and Fuzzy VIKOR methods. The results are also described in Table 4. The correlation between the Premier League Official ranking of the 2015-2016 season and the three MCDM methods is presented in Table 5.
Table 4– Ranks of different MCDA methods.
Teams PL Official CPP-PP Fuzzy MMOORA Fuzzy Vikor
Rank Rank Rank Rank
Number of variables 1 23 23 23
Type of variables Total points Skills Skills Skills
Criteria weight 1 1 1 1
Arsenal 2 2 4 5
Aston Villa 20 20 16 20
Bournemouth 16 10 8 16
Chelsea 10 16 14 17
Crystal Palace 15 15 12 9
Everton 11 6 5 4
Leicester City 1 1 1 1
Liverpool 8 5 6 7
Manchester City 4 4 2 3
Manchester United 5 8 9 10
Newcastle United 18 19 13 14
Norwich City 19 18 17 18
Southampton 6 7 18 8
Stoke City 9 14 11 15
Sunderland 17 11 10 11
Swansea City 12 13 19 12
Tottenham Hotspur 3 3 3 2
Watford 13 12 7 13
West Bromwich Albion 14 17 20 19
West Ham United 7 9 15 6
Created by the authors.
Table 5– Correlation indices.
PL Official Rank PL Official Rank PL Official Rank
× × ×
CPP Rank Fuzzy MMOORA Rank Fuzzy Vikor Rank
Spearman index 0,854 0,564 0,782
Kendall index 0,695 0,421 0,611
Created by the authors.
In regard to relegation, the probabilistic approach is also reliable in reflecting the reality of clubs. The numbers of Newcastle United, Norwich City and Aston Villa were the worst, as reflected in the final league table (relegated to Football League Championship) and when analyzed by the CPP method. The other methods were not able to arrive at such a close adequacy in relation to PL Official Rank.
For the teams in the intermediate group, a comparison is more difficult because these teams form a more homogeneous group, so that small differences in the variables affect the ranks. There is a difference of only 1 point between the teams placed from fifth to tenth and between the 11th and 17th the maximum difference was of only three points. A global comparison may be done using Kendall and Spearman correlation coefficients.
The correlation indices between the Premier League Official and the CPP ranking are higher and reveal the adequacy of this method to the context. It is important to remark that one method cannot here be considered better than another because, despite the graphical resemblance, CPP and Fuzzy MCDA methods embody different concepts. The interpretation of CPP may be easier because uncertainty is directly modeled by CPP. One possible reason for the higher correlation found for the CPP results may be that the use of a density function takes into account in the computations the probabilities of all values while the computation based on TFN takes into ac-count effectively only the central and extreme values. In fact, the CPP algorithm considers all values distributed by a probabilistic law. On the other hand, the fuzzy logic algorithm simplifies computation by prioritizing minimum or maximum values of a fuzzy number, thus excluding information considered in the probabilistic method. In what might seem paradoxical for methods applied to uncertain contexts, precision may have made a difference.
Thus, by the probabilistic method of CPP, a multiple criteria vision is obtained which takes into account variables expected to partially determine match results. This demonstrates that the 23 variables collected by the FA Premier League website are suitable to distinguish winning teams from losing teams.
In a second analysis, CPP was employed to analyze the teams’ performances by the three GV described in Table 3. For each group, a PP point of view is represented in Table 6 and a CP point of view is represented in Table 8. A global score is obtained in both tables by combining the GV results by a PO point of view. This approach was proposed by Sant’Anna (2015, p. 40-41) and assumes that a good performance in at least one group of variables may be enough to determine a good global performance. A pessimistic composition of the three GV scores would lead to the same global scores of the PP combination of the 23 variables as a unique group.
To obtain information on which kind of variables are more important, Table 6 presents the cor-relation between each variable group and the 2015/2016 Premier League Final Rank.
Table 6– PP Rank Composition by GV1, GV2, GV3.
Teams PL Official PP PP PP PO PP
Rank GV1 GV2 GV3 Composition Rank
Number of variables 1 23 23 23 23 23
Type of variables Total points Skills Skills Skills Skills Skills
Criteria weight 1 1 1 1 1 1
Arsenal 2 2.19E-10 3.67E-05 5.62E-15 3.67E-05 1
Aston Villa 20 3.94E-15 4.24E-06 9.01E-17 4.24E-06 6
Bournemouth 16 4.55E-13 1.00E-06 6.03E-16 1.00E-06 14
Chelsea 10 4.98E-13 1.57E-06 1.78E-17 1.57E-06 11
Crystal Palace 15 1.10E-13 3.18E-06 4.48E-17 3.18E-06 8
Everton 11 3.73E-12 6.00E-06 5.56E-16 6.00E-06 4
Leicester City 1 7.58E-09 7.32E-06 1.09E-13 7.32E-06 3
Liverpool 8 2.11E-11 2.57E-06 6.09E-16 2.57E-06 10
Manchester City 4 4.81E-10 1.68E-05 1.59E-15 1.68E-05 2
Manchester United 5 6.24E-12 3.47E-06 7.36E-17 3.47E-06 7
Newcastle United 18 8.27E-14 1.16E-06 1.67E-17 1.16E-06 13
Norwich City 19 4.17E-14 4.20E-07 1.11E-16 4.20E-07 18
Southampton 6 2.26E-11 4.32E-06 9.03E-17 4.32E-06 5
Stoke City 9 2.35E-12 3.63E-07 1.89E-17 3.63E-07 19
Sunderland 17 2.71E-13 1.62E-07 2.50E-15 1.62E-07 20
Swansea City 12 1.42E-13 7.88E-07 1.45E-16 7.88E-07 15
Tottenham Hotspur 3 4.45E-09 2.84E-06 1.54E-15 2.85E-06 9
Watford 13 2.97E-13 1.26E-06 9.27E-17 1.26E-06 12
West Bromwich Albion 14 1.12E-13 7.25E-07 4.45E-17 7.25E-07 17
West Ham United 7 7.61E-12 7.64E-07 1.67E-16 7.64E-07 16
Created by the authors.
Table 7– Correlation Indices to PP Composition Variables.
PL Official Rank PL Official Rank PL Official Rank PL Official Rank PL Official Rank
×CPP Rank ×GV1 ×GV2 ×GV3 ×GV Rank
Spearman index 0,854 0,949 0,558 0,453 0,558
Kendall index 0,695 0,832 0,411 0,337 0,411
Created by the authors.
how much score opportunities can be built or disarmed. What matters is the number of effective actions that contribute to directly score a goal.
Table 8– CP Rank Composition by GV1, GV2, GV3.
Teams PL Official CP CP CP PO CP
Rank GV1 GV2 GV3 Composition Rank
Number of variables 1 23 23 23 23 23
Type of variables Total points Skills Skills Skills Skills Skills
Criteria weight 1 1 1 1 1 1
Arsenal 2 7.17E-01 8.86E-01 6.74E-01 9.89E-01 5
Aston Villa 20 2.34E-01 7.51E-01 4.92E-01 9.03E-01 20
Bournemouth 16 6.75E-01 8.12E-01 6.44E-01 9.78E-01 11
Chelsea 10 6.45E-01 8.46E-01 4.70E-01 9.71E-01 14
Crystal Palace 15 6.86E-01 8.38E-01 6.25E-01 9.81E-01 10
Everton 11 7.91E-01 9.09E-01 6.03E-01 9.92E-01 4
Leicester City 1 8.50E-01 8.36E-01 7.61E-01 9.94E-01 2
Liverpool 8 7.65E-01 8.61E-01 5.10E-01 9.84E-01 7
Manchester City 4 8.52E-01 9.19E-01 6.53E-01 9.96E-01 1
Manchester United 5 7.40E-01 8.88E-01 3.52E-01 9.81E-01 9
Newcastle United 18 6.05E-01 8.43E-01 5.60E-01 9.73E-01 13
Norwich City 19 5.51E-01 7.72E-01 3.39E-01 9.32E-01 18
Southampton 6 8.08E-01 8.08E-01 5.61E-01 9.84E-01 8
Stoke City 9 6.22E-01 6.94E-01 5.29E-01 9.45E-01 17
Sunderland 17 7.16E-01 5.79E-01 6.68E-01 9.60E-01 16
Swansea City 12 5.69E-01 8.35E-01 5.47E-01 9.68E-01 15
Tottenham Hotspur 3 8.39E-01 8.92E-01 6.11E-01 9.93E-01 3
Watford 13 7.26E-01 8.09E-01 5.27E-01 9.75E-01 12
West Bromwich Albion 14 4.54E-01 6.68E-01 6.20E-01 9.31E-01 19
West Ham United 7 7.04E-01 8.62E-01 6.88E-01 9.87E-01 6
Created by the authors.
It is interesting to notice that Tottenham Hotspur occupies the ninth position in this rank, which demonstrates the instability of the team throughout its campaign this season. It appears in ninth position in the offensive phase and in the fifth position in the defensive phase, which results in a lower rank in this analysis than those presented in Appendices III and IV. Its superior perfor-mance with respect to the variables in the goals scored group, presented in Appendix II – where it can be seen that Tottenham Hotspur occupies a second position with 1.82 goals per match – kept the team disputing the championship until the final rounds, but was not enough to grant it a better final rank under this point of view.
Other teams that call for analysis are Everton, which appears in the PP rank in the fourth position, Southampton, appearing in fifth position and the relegated Aston Villa, in the sixth position. All these three teams presented an interesting offensive organization, with passing accuracy of 78% to 81% and more than 400 passes per match.
in GV3. In a closer look at the variables the difference of 0.10 between goals scored per match and goals conceded per match will call attention. The balance between making and conceding goals may be a problem to be more deeply investigated by the managers of this club.
In another case, the problems that Southampton presented in its defensive line are registered by its PP rank in thirteenth position. The team is among the top 5 teams in the PP rank for both the offensive phase and construction of goals. With 18 victories, 9 draws and 11 defeats, Southampton ended the competition in sixth place, 3 points behind the fourth team.
Aston Villa is an extreme case. It had its major problems in defense with an impressive number of 2 goals conceded per match. Its construction of goals was obtained with only 0.71 goals per match, ending the competition with a goal difference of minus 49.
The irregularity of Chelsea’s season may also be highlighted here, though its performance in Table 5 with respect to each group of variables is similar. A deeper analysis may reveal a large variability within the variables within the groups, primarily in the defensive phase. The numbers are very close to or worse than those of the relegated teams this season. This poor performance caused the team to change its coach and players during the season in such a way to improve its median campaign.
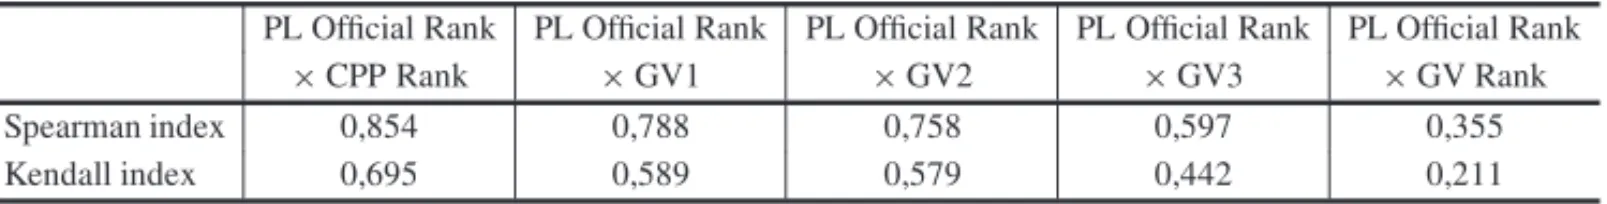
When the decision maker aims to differentiate alternatives near to worst performance by the idea of avoiding losses and, possibly, relegation, the CP point of view is the more adequate. In this case, none of the correlations presented in Table 8 shows a better performance than that obtained by CPP with the 23 variables. What shows that none of the groups of variables within a conservative view has a strong effect to the 2015/2016 Premier League Final Rank.
In Table 8, attention should be focused on those teams that wanted to avoid relegation. When we combine the conservative pessimistic GV scores, Newcastle United is not found among the possible candidates for relegation. Newcastle United, even with good construction in the offen-sive phase and being in a ninth position in this group of variables, was not successful in goal conversions, with just 1.16 goals per game and 1.71 goals conceded per match. Fundamentally, in football, goals are required. Of the last 24 available points, Newcastle United only managed to conquer 2 points, which determined the destiny of the team at the end of the season.
Combining analyses performed from a CP point of view through an optimistic perspective, the analysis depicted in Table 8 shows the reality of clubs who wish to stay in the elite of English Football, where they want to be better in each of the groups of variables presented. However, long term experience seems to indicate that teams fighting to avoid relegation should care about overall excellence and not only seeking to be better in one group of variables.
Table 9– Correlation Indices to CP Composition Variables.
PL Official Rank PL Official Rank PL Official Rank PL Official Rank PL Official Rank
×CPP Rank ×GV1 ×GV2 ×GV3 ×GV Rank
Spearman index 0,854 0,788 0,758 0,597 0,355
Kendall index 0,695 0,589 0,579 0,442 0,211
Created by the authors.
4 CONCLUSION
The purpose of this study was to explore football match related statistics in the Premier League for last season (2015/2016). Three different methods, Composition of Probabilistic Preferences (CPP), Fuzzy Multimoora Method and Fuzzy Vikor Method were employed to determine if it is possible to distinguish winning teams from losing teams on the basis of 23 performance indica-tors. On this point, CPP proved more efficient in predicting the final standings of the champi-onship. The Spearman index for PL Official Rank×CPP Rank is around 0,85 and the Kendall index around 0,69.
The uncertain and imprecise football variables are well modeled by CPP with a triangular density function rather than by TFN. CPP algorithms consider all values of a probabilistic distribution while fuzzy logic, prioritizing minimum or maximum values of a fuzzy number, explores less information.
In addition, CPP analyses based on goals scored, attack phase and defensive phase from different points of view were performed. By this way, the effects of technical performance of the teams at each moment of a football match may be better understood. Thus, information is gathered to help in-depth understanding each phase of the game for different decision maker’s points of view.
Evidence was found that the variables in the group GV1, related to the final offensive steps of the team, presents a better correlation with the premier League final rank. This means that the best strategy would be to prioritize being able to transpose the defense to score goals against the opponent.
Several other issues can be raised. For instance: Are the teams that make more goals always the best? Better offensive performance always results in scoring more? How much the defensive performance improves the chances of winning the matches?
Future investigations should attempt to apply CPP during the championship and not only at the end of the season. Useful information might also be gathered by looking at player individual rankings. In that case, CPP should be applied not only to technical performance variables but also to physical performance variables. Furthermore, it would also be interesting to apply CPP to different leagues, to determine if different aspects may be more important in different contexts.
ACKNOWLEDGMENTS
The authors are grateful for two Pesquisa Operacional referees, whose insightful analyses we evaluate that considerably improved the article.
REFERENCES
[1] ALMEIDATA, YAMAKAMIA & TAKAHASHIMT. 2006. Sistema imunol´ogico artificial para re-solver o problema da ´arvore geradora m´ınima com parˆametrosfuzzy,Pesquisa Operacional,27(1): 131–154.
[2] ANVARI A, ZULKIFLIN & ARGHISHO. 2014. Application of a modified VIKOR method for decision-making problems in lean tool selection.International Journal of Advanced Manufacturing Technology,71(5-8): 829–841.
[3] BALEZENTISˇ T & BALEZENTISˇ A. 2014. A Survey on Development and Applications of the Multi-criteria Decision Making Method MULTIMOORA. Journal of Multi-Criteria Decision Analysis, 21(3-4): 209–222.
[4] BESTERS LM, VAN OURS JC & VAN TUIJL MA. 2016. Effectiveness of In-Season Manager Changes in English Premier League Football.De Economist,164(3): 335–356.
[5] BRADLEYPS, CARLINGC, ARCHERD, ROBERTSJ, DODDSA, DIMASCIOM & KRUSTRUPP. 2011. The effect of playing formation on high-intensity running and technical profiles in English FA Premier League soccer matches.Journal of Sports Sciences,29(8): 821–830.
[6] BRAUERSWKM, BALEZENTISˇ A & BALEZENTISˇ T. 2011. MULTIMOORA for the EU Member States updated with fuzzy number theory.Technological and Economic Development of Economy, 17(2): 259–290.
[7] BRAUERSWKM & ZAVADSKASEK. 2006. The MOORA method and its application to privatization in a transition economy.Control and Cybernetics,35(2): 445–469.
[8] BRAUERSWKM & ZAVADSKASEK. 2010. Project management by MULTIMOORA as an instru-ment for transition economies.Technological and Economic Development of Economy,16(1): 5–24.
[9] BRAUERSWKM & ZAVADSKASEK. 2012a. A multi-objective decision support system for project selection with an application for the Tunisian textile industry.E&M Ekonomie a Management,15(1): 28–43.
[10] BRAUERSWKM & ZAVADSKASEK. 2012b. Robustness of MULTIMOORA: A Method for Multi-Objective Optimization.Informatica,23(1): 1–25.
[12] CASTELLANOJ. 2010. Analysis of the possession ball in soccer: frequency, duration and transition. European Journal of Human Movement,21: 179–196. Retrieved fromhttp://www.eurjhm.
com/index.php/eurjhm/article/view/214/401.
[13] CHIODOE & LAURIAD. 2015. Some Basic Properties of the Failure Rate of Redundant Reliability Systems in Industrial Electronics Applications.IEEE Transactions on Industrial Electronics,62(8): 5055–5062.
[14] DELIGNETTE-MULLERML & DUTANGC. 2014. fitdistrplus: An R Package for Fitting Distribu-tions.J. Stat. Softw.,64: 1–34.
[15] DRUSTB, ATKINSONG & REILLYT. 2007. Future perspectives in the evaluation of the physiolog-ical demands of soccer.Sports Medicine,37(9): 783–805.
[16] DUCKSTEINL & OPRICOVIC S. 1980. Multiobjective optimization in river basin development. Water Resources Research,16(1): 14–20.
[17] EAVESSJ. 2015. A history of sports notational analysis: a journey into the nineteenth century. Inter-national Journal of Performance Analysis in Sport,15(3): 1160–1176.
[18] FERNANDEZ-NAVARROJ, FRADUAL, ZUBILLAGAA, FORDPR & MCROBERTAP. 2016. Attack-ing and defensive styles of play in soccer: analysis of Spanish and English elite teams. 414 (April).
[19] GARCIAPADEA & SANT’ANNAAP. 2015. Vendor and Logistics Provider Selection in the Con-struction Sector: a Probabilistic Preferences Composition Approach.Pesquisa Operacional,35(2): 363–375.
[20] GAVIAO˜ LO, SILVA RFDA, SANT’ANNA, AP & LIMAGBA. 2016. Ordenac¸˜ao de Munic´ıpios por Potencial de Contaminac¸˜ao de ´Aguas com F´armacos Oncol´ogicos por Composic¸˜ao Probabil´ıstica de Preferˆencias [Powerpoint slides in Portuguese]. InSimp´osio Brasileiro de Pesquisa Operacional, (p. 12). Vit´oria.
[21] GIBBONSJD & CHAKRABORTIS. 2011. Nonparametric statistical inference. In:International en-cyclopedia of statistical science. Springer Berlin Heidelberg, 977–979.
[22] GOVINDANK, RAJENDRANS, SARKISJ & MURUGESANP. 2015. Multi criteria decision mak-ing approaches for green supplier evaluation and selection: a literature review.Journal of Cleaner Production,98: 66–83.
[23] HAUKEJ & KOSSOWSKIT. 2011. Comparison of values of Pearson’s and Spearman’s correlation coefficients on the same sets of data.Quaestiones Geographicae,30(2): 87–93.
[24] JATO-ESPINOD, CASTILLO-LOPEZE, RODRIGUEZ-HERNANDEZJ & CANTERAS-JORDANAJC. 2014. A review of application of multi-criteria decision making methods in construction.Automation in Construction,45: 151–162.
[25] KENDALLMG. 1938. A new measure of rank correlation.Biometrika,30(1/2): 81–93.
[26] LAGO-BALLESTEROSJ & LAGO-PENAS˜ C. 2010. Performance in Team Sports: Identifying the Keys to Success in Soccer.Journal of Human Kinetics,25(July): 85–91.
[27] LAGO-PENAS˜ C & LAGO-BALLESTEROSJ. 2011. Game location and team quality effects on per-formance profiles in professional soccer.Journal of Sports Science and Medicine,10(3): 465–471.
[29] LARKINP, CONNORDO & WILLIAMSAM. 2016. Establishing validity and reliability of a move-ment awareness and technical skill (MATS) analysis instrumove-ment in soccer, 191–202.
[30] LEIVAV, SANTOS-NETOM, CYSNEIROSFJA & BARROSM. 2014. Birnbaum-Saunders statistical modelling: a new approach.Statistical Modelling,14(1): 21–48.
[31] LEONETI AB. 2016. Considerations Regarding the Choice of Ranking Multiple Criteria Decision Making Methods.Pesquisa Operacional,36: 259–277.
[32] LIUH, G ´OMEZM-A, GONC¸ALVESB & SAMPAIOJ. 2016. Technical performance and match-to-match variation in elite football teams.Journal of Sports Sciences,34(6): 509–518.
[33] LIUH, GOMEZM-A, LAGO-PENAS˜ C & SAMPAIOJ. 2015. Match statistics related to winning in the group stage of 2014 Brazil FIFA World Cup.Journal of Sports Sciences,33(5): 1205–1213.
[34] LIUH, GOMEZMA & LAGO-PENASC. 2015. Match Performance Profiles of Goalkeepers of Elite Football Teams.International Journal of Sports Science & Coaching,10(4): 669–682.
[35] LIUH, YIQ, GIMENEZ´ J-V, G ´OMEZMA & LAGO-PENAS˜ C. 2015. Performance profiles of foot-ball teams in the UEFA Champions League considering situational efficiency.International Journal of Performance Analysis in Sport, 15 april, 371–390.
[36] MARDANIA, JUSOHA, MD NORK, KHALIFAHZ, ZAKWANN & VALIPOURA. 2015. Multiple criteria decision-making techniques and their applications – a review of the literature from 2000 to 2014.Economic Research-Ekonomska Istraˇivanja,28(1): 516–571.
[37] MARDANIA, JUSOHA & ZAVADSKASEK. 2015. Fuzzy multiple criteria decision-making tech-niques and applications – Two decades review from 1994 to 2014.Expert Systems with Applications, 42(8): 4126–4148.
[38] MARDANIA, JUSOHA, ZAVADSKAS EK, KHALIFAH Z & NOR KMD. 2015. Application of multiple-criteria decision-making techniques and approaches to evaluating of service quality: a sys-tematic review of the literature.Journal of Business Economics and Management,16(5): 1034–1068.
[39] MILLARDSP. 2013. EnvStats, an R Package for Environmental Statistics. Wiley Online Library.
[40] MOURAFA, MARTINSLEB & CUNHASA. 2014. Analysis of football game-related statistics using multivariate techniques.Journal of Sports Sciences,32(20): 1881–1887.
[41] OPRICOVICS. 1998. Multicriteria optimization of civil engineering systems.Faculty of Civil Engi-neering, Belgrade,2(1): 5–21.
[42] OPRICOVICS. 2007. A fuzzy compromise solution for multicriteria problems.International Journal of Uncertainty, Fuzziness and Knowledge-Based Systems,15(3): 363–380.
[43] OPRICOVICS. 2011. Fuzzy VIKOR with an application to water resources planning.Expert Systems with Applications,38(10): 12983–12990.
[44] OPRICOVICS & TZENGGH. 2004. Compromise solution by MCDM methods: A comparative anal-ysis of VIKOR and TOPSIS.European Journal of Operational Research,156(2): 445–455.
[45] SANT’ANNAAP. 2015.Probabilistic Composition of Preferences, Theory and Applications.
[47] SANT’ANNAAP, COSTAHG, NEPOMUCENODO & PEREIRAV. 2016. A probabilistic approach applied to the classification of courses by multiple evaluators,36: 469–485.https://doi.org/
10.1590/0101-7438.2016.036.03.0469.
[48] SANT’ANNAAP & GOMESLFAM. 2003. New Evidence on the Formation of Preferences of Betters in horse races. InEncontro Nacional de Engenharia de Produc¸˜ao XXIII ENEGEP, (pp. 1–6). Ouro Preto – MG.
[49] SANT’ANNAAP & SANT’ANNALAFP. 2001. Randomization as a stage in criteria combining. In International Conference on Industrial Engineering and Operations Management – VII ICIEOM, (pp. 248–256). Salvador.
[50] SANT’ANNAAP & SOARES DEMELLO JCCB. 2012. Validating Rankings in Soccer Champi-onships.Pesquisa Operacional,32(2): 407–422.
[51] SGROF, BARRESIM & LIPOMAM. 2015. The analysis of discriminant factors related to team match performances in European football Championship 2012.Journal of Physical Education and Sport,15(3): 460–465.
[52] SHAFIZADEHM, TAYLORM & LAGO-PENAS˜ C. 2013. Performance Consistency of International Soccer Teams in Euro 2012: a Time Series Analysis.Journal of Human Kinetics,38(September): 213–226.
[53] SILVARC. 2008. Relac¸˜ao entre modelos de programac¸˜ao n˜ao-linear com incerteza no conjunto de restric¸ ˜oes.Pesquisa Operacional,28(3): 383–398.
[54] SOLTANI A, HEWAGE K, REZA B & SADIQ R. 2015. Multiple stakeholders in multi-criteria decision-making in the context of municipal solid waste management: a review.Waste Management, 35: 318–328.
[55] SPEARMANC. 1904. The proof and measurement of association between two things.The American Journal of Psychology,15(1): 72–101.
[56] TENGAA, HOLMEI, RONGLANLT & BAHRR. 2010. Effect of playing tactics on achieving score-box possessions in a random series of team possessions from Norwegian professional soccer matches. Journal of Sports Sciences,28(3): 245–255.
[57] WOODSCT, RAYNORAJ, BRUCEL, MCDONALDZ & ROBERTSONS. 2016. The application of a multi-dimensional assessment approach to talent identification in Australian football.Journal of Sports Sciences,34(14): 1340–1345.
[58] YUP-L. 1973. A class of solutions for group decision problems.Management Science,19(8): 936– 946.
[59] ZADEHLA. 1965. Information and control.Fuzzy Sets,8(3): 338–353.
Appendix I– CPP 2nd stage results.
PL 15-16 V1 V2 V3 V4 V5
P.max P.min P.max P.min P.max P.min P.max P.min P.max P.min Arsenal 0.081 0.020 0.060 0.015 0.079 0.016 0.026 0.156 0.264 0.010 Aston Villa 0.012 0.237 0.019 0.171 0.023 0.164 0.029 0.072 0.022 0.177 Bournemouth 0.020 0.043 0.027 0.035 0.029 0.046 0.033 0.038 0.024 0.107 Chelsea 0.043 0.024 0.040 0.020 0.041 0.025 0.039 0.025 0.034 0.029 Crystal Palace 0.016 0.066 0.028 0.033 0.032 0.036 0.039 0.025 0.032 0.034 Everton 0.043 0.024 0.031 0.026 0.042 0.024 0.039 0.025 0.054 0.017 Leicester City 0.123 0.019 0.039 0.021 0.044 0.023 0.291 0.008 0.115 0.012 Liverpool 0.064 0.021 0.142 0.012 0.065 0.017 0.029 0.072 0.044 0.021 Manchester City 0.183 0.017 0.111 0.012 0.078 0.016 0.047 0.019 0.042 0.021 Manchester United 0.024 0.035 0.023 0.058 0.030 0.045 0.033 0.038 0.032 0.034 Newcastle United 0.019 0.046 0.020 0.118 0.032 0.038 0.033 0.038 0.026 0.064 Norwich City 0.016 0.066 0.022 0.073 0.026 0.074 0.026 0.156 0.025 0.078 Southampton 0.043 0.024 0.038 0.021 0.037 0.028 0.033 0.038 0.052 0.018 Stoke City 0.017 0.056 0.022 0.072 0.026 0.077 0.047 0.019 0.036 0.027 Sunderland 0.023 0.037 0.024 0.049 0.029 0.049 0.033 0.038 0.027 0.054 Swansea City 0.018 0.053 0.024 0.048 0.028 0.057 0.047 0.019 0.026 0.064 Tottenham Hotspur 0.141 0.018 0.233 0.011 0.261 0.011 0.047 0.019 0.059 0.016 Watford 0.017 0.061 0.025 0.044 0.029 0.050 0.060 0.015 0.026 0.071 West Bromwich Albion 0.014 0.110 0.020 0.144 0.022 0.184 0.026 0.156 0.024 0.119 West Ham United 0.081 0.020 0.052 0.016 0.048 0.021 0.039 0.025 0.036 0.027
PL 15-16 V7 V8 V9 V10 V11
P.max P.min P.max P.min P.max P.min P.max P.min P.max P.min Arsenal 0.222 0.013 0.214 0.013 0.046 0.023 0.027 0.041 0.067 0.021 Aston Villa 0.019 0.077 0.017 0.134 0.044 0.024 0.031 0.033 0.104 0.018 Bournemouth 0.021 0.058 0.019 0.086 0.026 0.088 0.027 0.041 0.032 0.032 Chelsea 0.016 0.205 0.023 0.043 0.051 0.021 0.052 0.023 0.019 0.111 Crystal Palace 0.030 0.028 0.021 0.058 0.051 0.021 0.019 0.094 0.047 0.024 Everton 0.090 0.016 0.026 0.034 0.060 0.019 0.030 0.034 0.019 0.123 Leicester City 0.027 0.032 0.069 0.017 0.030 0.048 0.196 0.016 0.217 0.016 Liverpool 0.055 0.019 0.030 0.029 0.023 0.183 0.203 0.016 0.021 0.071 Manchester City 0.046 0.020 0.099 0.015 0.025 0.123 0.030 0.034 0.030 0.035 Manchester United 0.023 0.046 0.214 0.013 0.026 0.088 0.038 0.027 0.026 0.045 Newcastle United 0.018 0.106 0.021 0.058 0.043 0.025 0.054 0.022 0.033 0.031 Norwich City 0.027 0.032 0.016 0.204 0.033 0.039 0.016 0.208 0.017 0.216 Southampton 0.034 0.025 0.035 0.024 0.028 0.065 0.027 0.039 0.052 0.023 Stoke City 0.017 0.150 0.026 0.034 0.050 0.021 0.027 0.040 0.024 0.053 Sunderland 0.025 0.038 0.019 0.086 0.265 0.011 0.041 0.026 0.023 0.056 Swansea City 0.039 0.022 0.023 0.043 0.047 0.022 0.019 0.116 0.041 0.026 Tottenham Hotspur 0.121 0.015 0.042 0.021 0.026 0.096 0.063 0.021 0.033 0.031 Watford 0.023 0.046 0.030 0.029 0.050 0.021 0.055 0.022 0.098 0.019 West Bromwich Albion 0.025 0.038 0.030 0.029 0.037 0.031 0.019 0.107 0.058 0.022 West Ham United 0.121 0.015 0.030 0.029 0.039 0.029 0.027 0.040 0.038 0.028
Appendix I (continuation)– CPP 2nd stage results.
PL 15-16 V12 V13 V20 V21 V6
P.max P.min P.max P.min P.max P.min P.max P.min P.max P.min Arsenal 0.025 0.075 0.026 0.080 0.044 0.030 0.204 0.014 0.030 0.044 Arsenal 0.035 0.033 0.035 0.029 0.099 0.021 0.023 0.041 0.037 0.035 Bournemouth 0.032 0.036 0.046 0.021 0.031 0.043 0.034 0.025 0.029 0.045 Chelsea 0.022 0.139 0.024 0.149 0.045 0.029 0.081 0.017 0.027 0.051 Crystal Palace 0.034 0.034 0.035 0.029 0.046 0.029 0.018 0.080 0.214 0.019 Everton 0.037 0.030 0.038 0.027 0.024 0.075 0.041 0.022 0.034 0.037 Leicester City 0.045 0.025 0.043 0.022 0.215 0.017 0.017 0.102 0.031 0.042 Liverpool 0.026 0.061 0.025 0.111 0.067 0.023 0.085 0.017 0.034 0.038 Manchester City 0.031 0.039 0.044 0.022 0.039 0.032 0.131 0.015 0.062 0.026 Manchester United 0.020 0.199 0.023 0.171 0.022 0.119 0.102 0.016 0.035 0.037 Newcastle United 0.031 0.039 0.032 0.038 0.025 0.068 0.022 0.044 0.033 0.039 Norwich City 0.138 0.016 0.264 0.010 0.024 0.077 0.020 0.056 0.042 0.031 Southampton 0.060 0.021 0.043 0.023 0.045 0.029 0.025 0.034 0.183 0.020 Stoke City 0.023 0.094 0.027 0.064 0.036 0.036 0.028 0.030 0.022 0.077 Sunderland 0.241 0.014 0.061 0.017 0.039 0.033 0.016 0.146 0.017 0.239 Swansea City 0.048 0.023 0.052 0.018 0.019 0.206 0.044 0.021 0.027 0.050 Tottenham Hotspur 0.046 0.024 0.056 0.018 0.028 0.052 0.052 0.019 0.028 0.049 Watford 0.031 0.041 0.025 0.114 0.049 0.027 0.020 0.055 0.024 0.063 West Bromwich Albion 0.037 0.030 0.048 0.020 0.040 0.032 0.015 0.201 0.052 0.028 West Ham United 0.039 0.029 0.054 0.018 0.063 0.024 0.022 0.045 0.039 0.033
PL 15-16 V14 V15 V16 V17 V18
P.max P.min P.max P.min P.max P.min P.max P.min P.max P.min Arsenal 0.067 0.021 0.025 0.075 0.026 0.080 0.021 0.138 0.025 0.050 Arsenal 0.104 0.018 0.035 0.033 0.035 0.029 0.246 0.009 0.235 0.014 Bournemouth 0.032 0.032 0.032 0.036 0.046 0.021 0.091 0.012 0.050 0.022 Chelsea 0.019 0.111 0.022 0.139 0.024 0.149 0.036 0.022 0.042 0.024 Crystal Palace 0.047 0.024 0.034 0.034 0.035 0.029 0.033 0.024 0.042 0.024 Everton 0.019 0.123 0.037 0.030 0.038 0.027 0.039 0.019 0.050 0.022 Leicester City 0.217 0.016 0.045 0.025 0.043 0.022 0.021 0.138 0.018 0.213 Liverpool 0.021 0.071 0.026 0.061 0.025 0.111 0.032 0.026 0.063 0.019 Manchester City 0.030 0.035 0.031 0.039 0.044 0.022 0.024 0.064 0.025 0.050 Manchester United 0.026 0.045 0.020 0.199 0.023 0.171 0.020 0.161 0.019 0.147 Newcastle United 0.033 0.031 0.031 0.039 0.032 0.038 0.075 0.013 0.028 0.040 Norwich City 0.017 0.216 0.138 0.016 0.264 0.010 0.091 0.012 0.042 0.024 Southampton 0.052 0.023 0.060 0.021 0.043 0.023 0.024 0.064 0.031 0.033 Stoke City 0.024 0.053 0.023 0.094 0.027 0.064 0.039 0.019 0.021 0.098 Sunderland 0.023 0.056 0.241 0.014 0.061 0.017 0.059 0.014 0.031 0.033 Swansea City 0.041 0.026 0.048 0.023 0.052 0.018 0.034 0.023 0.031 0.033 Tottenham Hotspur 0.033 0.031 0.046 0.024 0.056 0.018 0.020 0.161 0.028 0.040 Watford 0.098 0.019 0.031 0.041 0.025 0.114 0.032 0.026 0.031 0.033 West Bromwich Albion 0.058 0.022 0.037 0.030 0.048 0.020 0.029 0.030 0.022 0.068 West Ham United 0.038 0.028 0.039 0.029 0.054 0.018 0.033 0.024 0.168 0.015 Observation: Goals Conceded (V17), Errors Leading to Goal (V18), Own Goals (V19), Yellow Cards (V20), Red Cards (V21),
Appendix I (continuation)– CPP 2nd stage results.
PL 15-16 V19 V20 V21 V22 V23
P.max P.min P.max P.min P.max P.min P.max P.min P.max P.min Arsenal 0.051 0.014 0.014 0.243 0.047 0.020 0.025 0.048 0.051 0.023 Arsenal 0.103 0.011 0.197 0.019 0.031 0.026 0.046 0.026 0.014 0.229 Bournemouth 0.020 0.156 0.023 0.050 0.018 0.081 0.016 0.197 0.023 0.043 Chelsea 0.034 0.022 0.029 0.036 0.092 0.016 0.062 0.023 0.066 0.021 Crystal Palace 0.103 0.011 0.033 0.033 0.023 0.040 0.065 0.022 0.039 0.026 Everton 0.025 0.044 0.016 0.128 0.092 0.016 0.016 0.218 0.018 0.079 Leicester City 0.020 0.156 0.019 0.078 0.031 0.026 0.026 0.044 0.016 0.119 Liverpool 0.025 0.044 0.036 0.031 0.031 0.026 0.067 0.022 0.071 0.020 Manchester City 0.025 0.044 0.036 0.031 0.015 0.203 0.048 0.025 0.022 0.049 Manchester United 0.034 0.022 0.050 0.026 0.018 0.081 0.208 0.017 0.031 0.031 Newcastle United 0.034 0.022 0.033 0.033 0.092 0.016 0.031 0.035 0.020 0.061 Norwich City 0.034 0.022 0.036 0.031 0.031 0.026 0.026 0.046 0.084 0.020 Southampton 0.020 0.156 0.028 0.038 0.220 0.013 0.028 0.040 0.131 0.018 Stoke City 0.020 0.156 0.021 0.058 0.047 0.020 0.028 0.040 0.204 0.016 Sunderland 0.025 0.044 0.045 0.027 0.023 0.040 0.037 0.030 0.058 0.022 Swansea City 0.255 0.008 0.033 0.033 0.018 0.081 0.027 0.043 0.041 0.025 Tottenham Hotspur 0.051 0.014 0.125 0.021 0.015 0.203 0.057 0.023 0.028 0.034 Watford 0.034 0.022 0.146 0.020 0.031 0.026 0.126 0.019 0.017 0.101 West Bromwich Albion 0.051 0.014 0.050 0.026 0.031 0.026 0.037 0.030 0.025 0.039 West Ham United 0.034 0.022 0.029 0.036 0.092 0.016 0.024 0.052 0.041 0.025 Observation: Goals Conceded (V17), Errors Leading to Goal (V18), Own Goals (V19), Yellow Cards (V20), Red Cards (V21),
Appendix II– CPP 3rd stage results GV1.
GV1 PP PP PO PO CP CP CO CO
Rank Rank Rank Rank
Arsenal 2.187E-10 4 5.136E-01 3 7.168E-01 9 0.999999999999741 5
Aston Villa 3.942E-15 20 1.281E-01 20 2.343E-01 20 0.999999780962030 20
Bournemouth 4.550E-13 12 2.853E-01 11 6.749E-01 13 0.999999999985799 15
Chelsea 4.978E-13 11 2.218E-01 12 6.452E-01 14 0.999999999996882 11
Crystal Palace 1.099E-13 17 1.881E-01 17 6.859E-01 12 0.999999999992223 13
Everton 3.727E-12 9 2.881E-01 10 7.913E-01 5 0.999999999999696 7
Leicester City 7.584E-09 1 6.816E-01 1 8.499E-01 2 0.999999999999983 1.5
Liverpool 2.108E-11 6 3.709E-01 6 7.652E-01 6 0.999999999999706 6
Manchester City 4.814E-10 3 4.824E-01 4 8.523E-01 1 0.999999999999981 3
Manchester United 6.244E-12 8 3.874E-01 5 7.401E-01 7 0.999999999997944 9 Newcastle United 8.274E-14 18 1.810E-01 18 6.049E-01 16 0.999999999942001 17
Norwich City 4.170E-14 19 1.626E-01 19 5.506E-01 18 0.999999999766941 18
Southampton 2.264E-11 5 3.673E-01 7 8.077E-01 4 0.999999999999803 4
Stoke City 2.345E-12 10 3.449E-01 8 6.219E-01 15 0.999999999985841 14
Sunderland 2.710E-13 14 2.043E-01 14 7.159E-01 10 0.999999999994008 12
Swansea City 1.416E-13 15 2.008E-01 15 5.686E-01 17 0.999999999983690 16
Tottenham Hotspur 4.452E-09 2 6.761E-01 2 8.395E-01 3 0.999999999999983 1.5
Watford 2.973E-13 13 2.111E-01 13 7.262E-01 8 0.999999999996923 10
West Bromwich Albion 1.121E-13 16 1.993E-01 16 4.545E-01 19 0.999999999416289 19 West Ham United 7.610E-12 7 3.423E-01 9 7.042E-01 11 0.999999999999514 8
Appendix III– CPP 3rd stage results GV2.
GV1 PP PP PO PO CP CP CO CO
Rank Rank Rank Rank
Arsenal 3.666E-05 1 4.446E-01 1 8.861E-01 5 0.999999692650327 3
Aston Villa 4.236E-06 6 2.902E-01 2 7.509E-01 17 0.999996422713184 15
Bournemouth 1.003E-06 14 1.234E-01 15 8.121E-01 13 0.999997197567777 14
Chelsea 1.567E-06 11 1.547E-01 12 8.464E-01 8 0.999998368503557 9
Crystal Palace 3.184E-06 8 2.722E-01 3 8.378E-01 10 0.999997994219116 11
Everton 6.003E-06 4 1.934E-01 7 9.088E-01 2 0.999999748096891 2
Leicester City 7.315E-06 3 2.579E-01 5 8.357E-01 11 0.999999136470623 6
Liverpool 2.567E-06 10 1.716E-01 9 8.609E-01 7 0.999999084912791 7
Manchester City 1.678E-05 2 2.577E-01 6 9.187E-01 1 0.999999820804166 1
Manchester United 3.467E-06 7 1.868E-01 8 8.878E-01 4 0.999999393016960 5 Newcastle United 1.160E-06 13 1.351E-01 13 8.432E-01 9 0.999997859757944 12
Norwich City 4.203E-07 18 1.031E-01 18 7.723E-01 16 0.999988473080744 17
Southampton 4.320E-06 5 2.584E-01 4 8.081E-01 15 0.999998458732760 8
Stoke City 3.627E-07 19 9.842E-02 19 6.935E-01 18 0.999987233705528 18
Sunderland 1.617E-07 20 7.961E-02 20 5.794E-01 20 0.999891385142310 20
Swansea City 7.880E-07 15 1.170E-01 16 8.348E-01 12 0.999997241864082 13
Tottenham Hotspur 2.844E-06 9 1.615E-01 11 8.922E-01 3 0.999999572365489 4
Watford 1.262E-06 12 1.622E-01 10 8.087E-01 14 0.999995829855388 16
Appendix IV– CPP 3rd stage results GV3.
GV1 PP PP PO PO CP CP CO CO
Rank Rank Rank Rank
Arsenal 5.624E-15 2 5.850E-01 3 6.735E-01 3 1.000000000000000 1
Aston Villa 9.014E-17 14 3.777E-01 11 4.917E-01 17 0.999999999999999 13
Bournemouth 6.031E-16 7 4.575E-01 9 6.439E-01 6 1.000000000000000 1
Chelsea 1.784E-17 19 3.086E-01 18 4.705E-01 18 0.999999999999996 18
Crystal Palace 4.481E-17 16 3.194E-01 16 6.254E-01 7 1.000000000000000 1
Everton 5.558E-16 8 4.938E-01 6 6.033E-01 10 1.000000000000000 1
Leicester City 1.088E-13 1 6.616E-01 1 7.614E-01 1 1.000000000000000 1
Liverpool 6.094E-16 6 5.541E-01 4 5.099E-01 16 0.999999999999999 13
Manchester City 1.586E-15 4 4.917E-01 7 6.530E-01 5 1.000000000000000 1
Manchester United 7.361E-17 15 4.308E-01 10 3.521E-01 19 0.999999999999972 20 Newcastle United 1.666E-17 20 2.966E-01 20 5.603E-01 12 0.999999999999999 13
Norwich City 1.107E-16 11 4.990E-01 5 3.392E-01 20 0.999999999999984 19
Southampton 9.027E-17 13 3.416E-01 15 5.615E-01 11 1.000000000000000 1
Stoke City 1.887E-17 18 3.017E-01 19 5.291E-01 14 0.999999999999998 17
Sunderland 2.496E-15 3 5.924E-01 2 6.679E-01 4 1.000000000000000 1
Swansea City 1.453E-16 10 3.615E-01 12 5.467E-01 13 1.000000000000000 1
Tottenham Hotspur 1.544E-15 5 4.903E-01 8 6.113E-01 9 1.000000000000000 1
Watford 9.272E-17 12 3.594E-01 13 5.271E-01 15 0.999999999999999 13
West Bromwich Albion 4.454E-17 17 3.185E-01 17 6.201E-01 8 1.000000000000000 1 West Ham United 1.673E-16 9 3.556E-01 14 6.878E-01 2 1.000000000000000 1
Appendix V– CPP 3rd stage results Composition.
Compositions PP PP PP PO PP PO PO PO PO PO