DOI: http://dx.doi.org/10.1590/2446-4740.01216
*e-mail: [email protected]
Received: 17 February 2016 / Accepted: 02 October 2016
Analysis of serum cortisol levels by Fourier Transform Infrared
Spectroscopy for diagnosis of stress in athletes
Lia Campos Lemes*, Paulo Cesar Caetano Júnior, Juliana Ferreira Strixino, Josafá Aguiar, Leandro Raniero
Abstract Introduction Fourier-transform infrared (FT-IR) spectroscopy is a technique with great potential for body luids analyses. The aim of this study was to examine the impact of session training on cortisol concentrations in rugby players by means of infrared analysis of serum. Methods: Blood collections were performed pre, post and 24 hours after of rugby training sessions. Serum cortisol was analyzed by FT-IR spectroscopy and chemiluminescent immunoassay. Results: There was a signiicant difference between the integrated area, in the region of 1180-1102 cm-1, of the spectra for pre, post and post 24 h serums. The cortisol concentration obtained by chemiluminescent immunoassay showed no signiicant difference between pre, post and post 24 h. Positive correlations were obtained between the techniques (r = 0.75), post (r = 0.83) and post 24 h (r = 0.73). Conclusion: The results showed no increase in cortisol levels of the players after the training sessions, as well as positive correlations indicating that FT-IR spectroscopy have produced promising results for the analysis of serum for diagnosis of stress.
Keywords: Infrared spectroscopy, Blood, Cortisol, Sports medicine.
Introduction
The goal in training of elite athletes is to provide training loads that are effective in improving performance during competitions. A successful process requires the interaction between the training load and recovery time, in order to avoid stress, which can lead to decreased performance and increased risk of injury (Ferrari et al., 2013; Meeusen et al., 2013).
This imbalance between the overall strain experienced during exercise training and the athlete’s tolerance to such effort may induce overreaching or overtraining syndrome, which are characterized
by diminished sport-speciic physical performance,
accelerated fatiguability and subjective symptoms of stress (Urhausen et al., 1995).
Exercise produces stress response activating the sympathoadrenal medullary system and the hypothalamic pituitary adrenal axis (HPA). Thus, researchers have examined the human stress response to exercise by means of cortisol (a stress biomarker) in various situations including pre-exercise, during exercise, and post-exercise (Backes et al., 2015; Cunniffe et al., 2010; Dickerson and Kemeny, 2004; Hill et al., 2008; Moreira et al., 2013).
Traditional clinical trials used for analysis of cortisol are relatively expensive and laborious, making
it dificult for many teams to monitor athletes without substantial inancial support. In order to minimize
such dificulties, new laboratory tools have been
proposed to characterize biological samples as an alternative technique for health monitoring of athletes (Ellis and Goodacre, 2006; Khaskheli et al., 2013; Petibois et al., 2000).
FT-IR spectroscopy is a technique with great
potential for the analysis of body luids (Petibois et al., 2000; Yoshida et al., 2013), which has some advantages compare to standard laboratory analysis, for example, it can provide real-time information without the use of reagents and requires a small sample volume (Franck et al., 1998; Khaustova et al., 2010; Petibois et al., 2000). FT-IR spectroscopy allows measuring the frequency and intensity at which a given sample absorbs infrared radiation, providing
the identiication of functional groups like carboxyl, amine, hydroxyl, carbonyl, etc. The quantiication
by FT-IR spectroscopy is done using the absorption bands of the vibrational modes of molecular radicals in spectral range of 4000-700 cm-1 (Khaustova et al.,
2010; Petibois et al., 2000; Stuart, 1997).
Some studies have shown the determination of glucose (Petibois et al., 1999) and immunoglobulins (Sankari et al., 2010) in serum samples, as well as lactate, glycerol, triglycerides, fatty acyl, total amino acids plasma concentrations (Petibois et al., 2002) using FT-IR spectroscopy. However, there are few
Participants
The sample was composed of 10 male rugby players (Age: 22 ± 3 years; Height: 1.79 ± 6 cm; Body mass: 87 ± 10 Kg). All players had experience
with this sport for approximately ive years and train
twice a day (90-120 minutes per session), four days per week.
This study was approved by the Ethics Research Committee of the University of Vale of Paraiba (No. 255.474). All volunteers provided written informed consent before participation.
Training session
The training session was performed at 21:30 h, which was started with a 20 min warm-up (stretching
and running) and sport-speciic exercises (technical
drills and tactical drills). After this stage the players performed a simulated rugby match. In addition, all
oficial rules were maintained and no player was
substituted during the match.
The intensity of the training session was assessed by training load, which was calculated by multiplying the exercise duration (min) by the ‘session rating of
perceived exertion’ scale (Session-RPE), as deined by
the Borg CR-10 scale (Foster, 1998). The RPE of each player was recorded 30 min after the training session.
Blood samples and analyses
Blood collection was performed approximately 30 min before (~21:00 h - pre-session), after (~23:30 h - post-session) and 24 h after the training session.
The blood sample was collected from a supericial
forearm vein with subjects in the seated position using standard venipuncture technique. Eight milliliters of blood was collected into sterile tube, gel-barrier vacuum (BD Vacutainer SST Advance Tube, 5 mL, Gold). After collection, the serum was separated by centrifugation at 3000 rpm for 10 minutes and stored in sterilized tubes of 2 ml at -20°C until the analysis.
controlled by a computer using Spotlight 400 Software. For each sample, eight random points were performed
along the thin ilm.
Statistical analyses
Data were reported as means and standard deviation (SD). After checking the normality of distribution (Kolmogorov-Smirnov test), the differences between the data obtained by FT-IR spectroscopy and chemiluminescent immunoassay methods (pre, post and post 24h session training) were determined using a one-way ANOVA with a
post hoc test (Tukey). Statistical signiicance was set
at p < 0.05. The relationships between the integrated area of spectra of serum and cortisol concentrations
were analyzed using Pearson’s coeficient.
The FT-IR spectra of serum sample were standardized by baseline correction and normalization (0-1). The area was calculated by integrating the spectral region within 1180-1102 cm-1. All data were analyzed
using Excel 2007, Origin V8.5, and OPUS V4.2.
Results
The study included 10 players, which ranked sessions as follows: 7 players = intense; 3 players = somewhat intense. Training load was rated 480 ± 98 (Means ± SD), indicating an intense training session.
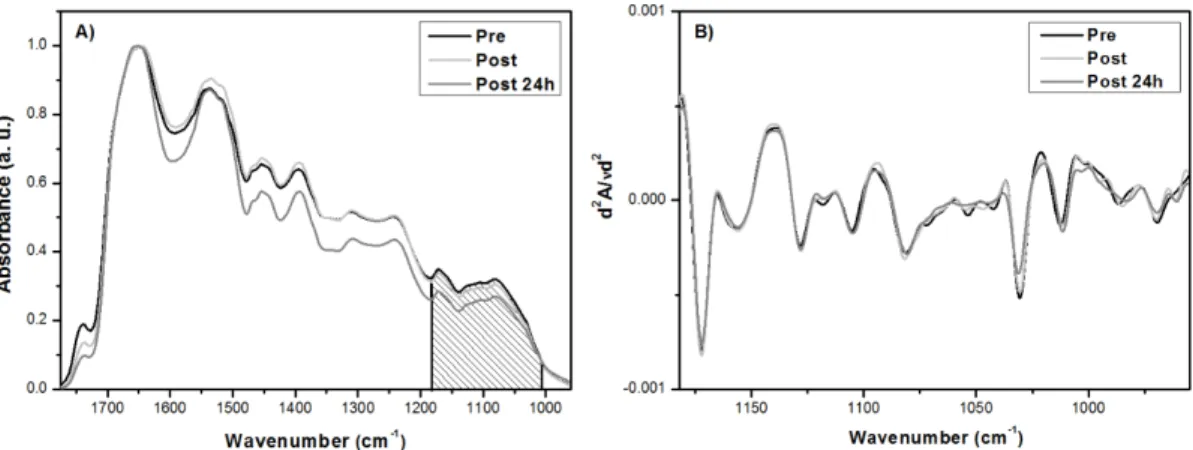
The average FT-IR spectra of the serum samples collected pre-session training (Pre), post-session training (Post) and 24 h after session training (Post 24 h) are shown in Figure 1A. In order to improve the visualization of differences between the absorption bands, the second derivative of FT-IR spectra was used, as shown in Figure 1B. The results showed differences between the samples in the spectral region 1590-1004 cm-1. The region 1180-1102 cm-1 (marked)
is highlighted because it is predominantly attributed to cortisol (Caetano et al., 2016; Khaustova et al., 2010).
collected pre and post-session training and post 24 h of recovery for the spectral region 1180-1102 cm-1,
predominantly attributed to cortisol. There was a
signiicant difference between the integrated area of
spectra of serum pre, post and post 24h.
The cortisol concentrations obtained by chemiluminescent immunoassay method are shown in Figure 3. There were no signiicant differences between the cortisol concentrations in pre, post and post 24h session training. These results are in accordance with the FT-IR results, showing that the training session did not cause relevant changes in cortisol concentrations.
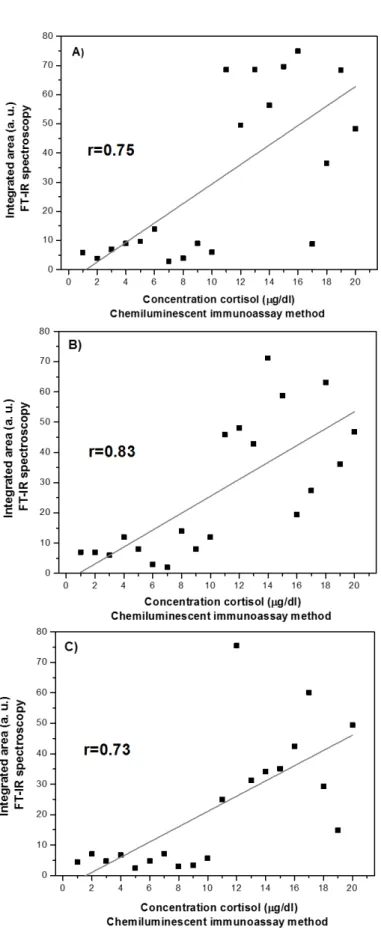
The correlation between the integrated area of the spectra of the serum samples and cortisol concentrations
obtained by chemiluminescent immunoassay method are shown in Figure 4. Positive correlations were observed between the integrated area of the spectra regions predominantly associated with cortisol and cortisol concentrations, with the values obtained before (r=0.75) (Figure 4A), after (r=0.83) (Figure 4B) and after 24 h (r=0.73) (Figure 4C) the rugby training session.
Discussion
The aim of this study was to examine the impact of session training on the serum cortisol concentrations in rugby players, using FT-IR spectroscopy and chemiluminescent immunoassay method.
Figure 1. (A) Average FT-IR spectra of the serum samples recorded in the 1800-900 cm–1 region for samples collected pre, post and post
24 h training session. (B) Second derivative of serum spectra in the region of 1180 to 1102 cm-1.
The training load was used as an indicator of exercise intensity since it has been widely used as a useful tool for prescribing exercise intensity, due to its relationship with physiological indicators of exercise stress (Irving et al., 2006; Nakamura et al., 2010). This method showed that the training session performed by the volunteers was intense.
Infrared analysis was focused on the spectral region of 1180 to 1102 cm-1, which is attributed predominantly
to cortisol. In order to amplify the spectral variations between the average FT-IR spectra of the serum samples collected pre, post and post 24 h, the second derivative of the spectra was used and showed that the main differences occur in the following spectral regions: 1104, 1117, 1128, 1156 and 1172 cm-1. These
results indicate that biochemical changes do exist in serum after a training session, as shown in other studies (Déléris and Petibois, 2003; Galliera et al., 2014).
The results of the integrated area were signiicantly
different for three sampling times (pre, post and post 24h). There was a decrease in the spectral band for serum collected after physical effort, which can be explained by factors such as no increase in cortisol concentrations and the complexity of the serum spectra due to the absorption of proteins, hormones, lipids, carbohydrates, etc. (Petibois et al., 2000).
The spectral region of 1180 to 1102 cm-1
corresponds to group C-O and C-O-C, which is assigned to cortisol, because this hormone is formed by C21H30O5 (Khaustova et al., 2010). However, other
components present in serum, such as lactate and glycerides, may also have absorption bands in this region (Petibois et al., 2000).
The cortisol response was confirmed by chemiluminescent immunoassay method, which is used to determine the concentration of samples according to the intensity of the luminescence that the chemical reaction emits. The immunoreaction indicates the interaction between antigen and antibody.
This method has high sensitivity and good speciicity, but requires some speciic reagents and always needs a
long incubation period, which, in turn, leads to several hours to complete the analysis (Wang et al., 2012).
The results obtained by chemiluminescent immunoassay showed that the cortisol concentration
was not signiicantly different for pre, post and 24h
session. Thus, the stress imposed by the training session was not enough to increase cortisol concentrations. These results show that the FT-IR spectroscopy has the necessary sensitivity for this type of analysis, even in the case were no increase in the absorption bands assigned to cortisol was observed.
Some authors report that high-intensity running and impacts commonly associated with rugby have
caused signiicant changes in markers of muscle
an additional stressor in sports, helps to explain our results, since blood collection was performed around a training session. In other words, a representative increase in cortisol would be found if our experiments
were performed around an oficial match, as shown
by Lindsay et al. (2015b), who found a signiicant
increase in cortisol after an oficial rugby game.
These results area corroborated by other studies that
showed that levels of cortisol after an oficial match
are considerably higher compared to a simulated match (Haneishi et al., 2007; Moreira et al., 2013).
In addition, cortisol levels show a circadian rhythm in which levels increase dramatically on awakening and gradually decrease throughout the day, reaching the lowest levels late in the evening (Dickerson and Kemeny, 2004). Thus, this could also explain part of our results, since the experiment was performed at night (~21:30h).
Correlation coeficient was used to establish
the statistical associations between the parameters obtained by FT-IR spectroscopy and chemiluminescent immunoassay method. There were positive correlations between the integrated area of the serum spectra and cortisol concentrations for pre (r = 0.75), post (r = 0.83) and post 24 h (r = 0.73).
In addition to checking the relationship between the techniques, the results of this study showed that the training load could be increased during the training sessions of the volunteers, since no relevant changes were found in the levels of cortisol pre, post, and post 24 h of recovery after the training session. Unlike the training load, that showed an intense session, the results of FT-IR spectroscopy and chemiluminescent immunoassay showed that the game was somewhat intense. Thus it is important that the training load is associated with another test to properly rate the intensity of training sessions. This is important because a successful training not only must involve overloads but must also avoid the combination of excessive overload and inadequate
recovery. When athletes do not suficiently respect the
balance between training and recovery, overtraining
for monitoring players that belong to teams without
proper inancial support.
In conclusion, the results showed that no increase in cortisol levels were found in players after the training session, as well as positive correlations were obtained between infrared analysis and chemiluminescent immunoassay. FT-IR spectroscopy has produced promising results for serum analyses involving the detection of stress without the use of any additional reagent.
References
Backes TP, Horvath PJ, Kazial KA. Salivary alpha amylase and salivary cortisol response to fluid consumption in exercising athletes. Biology of Sport. 2015; 32(4):275-80. http://dx.doi. org/10.5604/20831862.1163689. PMid:26681828.
Caetano PC Jr, Carvalho Aguiar J, Ferreira-Strixino J, José Raniero L. Isokinetic muscle performance and salivary immune-endocrine responses in handball players by Fourier transform infrared spectroscopy. Revista Andaluza de Medicina del Deporte. 2016. In press. http://dx.doi. org/10.1016/j.ramd.2015.11.007.
Cunniffe B, Hore AJ, Whitcombe DM, Jones KP, Baker JS, Davies B. Time course of changes in immuneoendocrine markers following an international rugby game. European Journal of Applied Physiology. 2010; 108(1):113-22. PMid:19756700. http://dx.doi.org/10.1007/s00421-009-1200-9.
Déléris G, Petibois C. Applications of FT-IR spectrometry to plasma contents analysis and monitoring. Vibrational Spectroscopy. 2003; 32(1):129-36. http://dx.doi.org/10.1016/
S0924-2031(03)00053-5.
Dickerson SS, Kemeny ME. Acute stressors and cortisol responses: a theoretical integration and synthesis of laboratory research. Psychological Bulletin. 2004; 130(3):355-91. PMid:15122924. http://dx.doi.org/10.1037/0033-2909.130.3.355.
Ellis DI, Goodacre R. Metabolic fingerprinting in disease diagnosis: biomedical applications of infrared and Raman spectroscopy. Analyst. 2006; 131(8):875-85. PMid:17028718. http://dx.doi.org/10.1039/b602376m.
season. Biology of Sport. 2013; 30(4):289-94. PMid:24744500. http://dx.doi.org/10.5604/20831862.1077555.
Foster C. Monitoring training in athletes with reference to overtraining syndrome. Medicine and Science in Sports and Exercise. 1998; 30(7):1164-8. PMid:9662690. http://dx.doi. org/10.1097/00005768-199807000-00023.
Franck P, Nabet P, Dousset B. Applications of infrared spectroscopy to medical biology. Cellular and Molecular Biology. 1998; 44(2):273-5. PMid:9593577.
Galliera E, Lombardi G, Marazzi MG, Grasso D, Vianello E, Pozzoni R, Banfi G, Corsi Romanelli MM. Acute exercise in elite rugby players increases the circulating level of the cardiovascular biomarker GDF-15. Scandinavian Journal of Clinical and Laboratory Investigation. 2014; 74(6):492-9. PMid:247923674(6):492-9. http://dx.doi.org/10.3109/00365513.2 014.905697.
Haneishi K, Fry AC, Moore CA, Schilling BK, Li Y, Fry MD. Cortisol and stress responses during a game and practice in female collegiate soccer players. Journal of Strength and Conditioning Research. 2007; 21(2):583-8. http://dx.doi. org/10.1519/R-20496.1. PMid:17530979.
Hejazi K, Hosseini SR. Influence of selected exercise on serum immunoglobulin, testosterone and cortisol in semi-endurance elite runners. Asian Journal of Sports Medicine. 2012; 3(3):185-92. PMid:23012638.
Hill EE, Zack E, Battaglini C, Viru M, Viru A, Hackney AC. Exercise and circulating cortisol levels: the intensity threshold effect. Journal of Endocrinological Investigation. 2008; 31(7):587-91. PMid:18787373. http://dx.doi. org/10.1007/BF03345606.
Irving BA, Rutkowski J, Brock DW, Davis CK, Barrett EJ, Gaesser GA, Weltman A. Comparison of Borg- and OMNI-RPE as markers of the blood lactate response to exercise. Medicine and Science in Sports and Exercise. 2006; 38(7):1348-52. PMid:16826034. http://dx.doi. org/10.1249/01.mss.0000227322.61964.d2.
Khaskheli AR, Sirajuddin, Sherazi STH, Mahesar SA, Kandhro AA, Kalwar NH, Mallah MA. Estimation of ibuprofen in urine and tablet formulations by transmission Fourier Transform Infrared spectroscopy by partial least square. Spectrochimica Acta Part A: Molecular and Biomolecular Spectroscopy. 2013; 102:403-7. http://dx.doi.org/10.1016/j. saa.2012.10.021.
Khaustova S, Shkurnikov M, Tonevitsky E, Artyushenko V, Tonevitsky A. Noninvasive biochemical monitoring of physiological stress by Fourier transform infrared saliva spectroscopy. Analyst. 2010; 135(12):3183-92. PMid:20953513. http://dx.doi. org/10.1039/c0an00529k.
Lindsay A, Lewis J, Scarrott C, Draper N, Gieseg SP. Changes in acute biochemical markers of inflammatory and structural stress in rugby union. Journal of Sports Sciences. 2015a; 33(9):882-91. PMid:25358055. http://dx.doi.org/1 0.1080/02640414.2014.971047.
Lindsay A, Lewis JG, Scarrott C, Gill N, Gieseg SP, Draper N. Assessing the effectiveness of selected biomarkers in the acute and cumulative physiological stress response in professional rugby union through non-invasive assessment.
International Journal of Sports Medicine. 2015b; 36(6):446-54. PMid:25760150. http://dx.doi.org/10.1055/s-0034-1398528.
Meeusen R, Duclos M, Foster C, Fry A, Gleeson M, Nieman D, Raglin J, Rietjens G, Steinacker J, Urhausen A, Prevention, diagnosis, and treatment of the overtraining syndrome: joint consensus statement of the European College of Sport Science and the American College of Sports Medicine. Medicine and Science in Sports and Exercise. 2013; 45(1):186-205. PMid:23247672. http:// dx.doi.org/10.1249/MSS.0b013e318279a10a.
Moreira A, Freitas CG, Nakamura FY, Drago G, Drago M, Aoki MS. Effect of match importance on salivary cortisol and immunoglobulin A responses in elite young volleyball players. Journal of Strength and Conditioning Research. 2013; 27(1):202-7. PMid:22395269. http://dx.doi.org/10.1519/ JSC.0b013e31825183d9.
Mujika I, Chatard JC, Padilla S, Guezennec CY, Geyssant A. Hormonal responses to training and its tapering off in competitive swimmers: Relationships with performance. European Journal of Applied Physiology and Occupational Physiology. 1996; 74(4):361-6. PMid:8911829. http://dx.doi. org/10.1007/BF02226933.
Nakamura FY, Moreira A, Aoki MS. Monitoramento da carga de treinamento: a percepção subjetiva do esforço da sessão é um método confiável? Revista da Educação Física. 2010; 21(1):1-11. http://dx.doi.org/10.4025/reveducfis.v21i1.6713.
Petibois C, Cazorla G, Cassaigne A, Déléris G. Application of FT-IR spectrometry to determine the global metabolic adaptations to physical conditioning in sportsmen. Applied Spectroscopy. 2002; 56(10):1259-67. http://dx.doi.org/10. 1366/000370202760354957.
Petibois C, Déléris G, Cazorla G. Perspectives in the utilisation of Fourier-transform infrared spectroscopy of serum in sports medicine: health monitoring of athletes and prevention of doping. Sports Medicine (Auckland, N.Z.). 2000; 29(6):387-96. PMid:10870865. http://dx.doi. org/10.2165/00007256-200029060-00002.
Petibois C, Rigalleau V, Melin AM, Perromat A, Cazorla G, Gin H, Déléris G. Determination of glucose in dried serum samples by Fourier-transform infrared spectroscopy. Clinical Chemistry. 1999; 45(9):1530-5. PMid:10471657.
Quarrie RL, Hopkins WG. Changes in player characteristics and match activities in Bledisloe Cup rugby from 1972 to 2004. Journal Sports Science. 2007; 25(8):895-903. http://
dx.doi.org/10.1080/02640410600944659. PMid:17474043.
Sankari G, Krishnamoorthy E, Jayakumaran S, Gunasekaran S, Vishnu Priya V. Shyama Subramaniam, Subramaniam S, Surapaneni Krishna Mohan. Analysis of serum immunoglobulins using Fourier transform infrared spectral measurements. Biology and Medicine. 2010; 2(3):42-8.
Sapolsky RM, Romero LM, Munck AU. How do glucocorticoids influence stress responses? Integrating permissive, suppressive, stimulatory, and preparative actions. Endocrine Reviews. 2000; 21(1):55-89. PMid:10696570. http://dx.doi.org/10.1210/edrv.21.1.0389.
PMid:10413266. http://dx.doi.org/10.1080/026404199365902. jpba.2012.12.009.
Authors
Lia Campos Lemes1*, Paulo Cesar Caetano Júnior1, Juliana Ferreira Strixino1, Josafá Aguiar1, Leandro Raniero1
1 Laboratório de Nanosensores, Instituto de Pesquisa e Desenvolvimento – IP&D, Universidade do Vale do Paraíba –