*e-mail: [email protected]
Received: 13 February 2016 / Accepted: 30 September 2016
Volumetric T1 and T2 magnetic resonance brain toolkit for relaxometry
mapping simulation
Antonio Carlos da Silva Senra Filho*
Abstract Introduction: Relaxometry images are an important magnetic resonance imaging (MRI) technique in the clinical
routine. Many diagnoses are based on the relaxometry maps to infer abnormal state in the tissue characteristic relaxation constant. In order to study the performance of these image processing approaches, a controlled simulated environment is necessary. However, a simulated relaxometry image tool is still lacking. This study proposes a computational anatomical brain phantom for MRI relaxometry images, which aims to offer an easy and lexible toolkit to test different image processing techniques, applied to MRI relaxometry maps in a controlled simulated environment. Methods: A pipeline of image processing techniques such as brain extraction, image segmentation,
normalization to a common space and signal relaxation decay simulation, were applied to a brain structural ICBM brain template, on both T1 and T2 weighted images, in order to simulate a volumetric brain relaxometry phantom. The FMRIB Software Library (FSL) toolkits were used here as the base image processing needed to all the relaxometry reconstruction. Results: All the image processing procedures are performed using automatic
algorithms. In addition, different artefact levels can be set from different sources such as Rician noise and radio-frequency inhomogeneity noises. Conclusion: The main goal of this project is to help researchers in their future
image processing analysis involving MRI relaxometry images, offering reliable and robust brain relaxometry simulation modelling. Furthermore, the entire pipeline is open-source, which provides a wide collaboration between researchers who may want to improve the software and its functionality.
Keywords: Relaxometry, Magnetic resonance imaging, Brain phantom, Simulation.
Introduction
Magnetic resonance imaging (MRI) is crucial for many applications in the clinic routine. Due to its clinical importance, several MRI techniques are being intensely researched for better image acquisitions and processing. One classical MRI technique is the relaxometry, which measures the characteristic energy decay after a radio-frequency pulse, also known as the relaxometry constants (T2 or T1, depending the weighted imaging technique used) (Carneiro et al., 2006; Deoni, 2010; Haacke et al., 1999). This process
is widely used for different studies, especially for brain research in clinical applications (Cheng et al., 2012; Ellingson et al., 2012; Hasan et al., 2012;
Kosior et al., 2011), which plays an important role in the diagnosis of several brain diseases, e.g. in Parkinson (Barbosa et al., 2015), Alzheimer (House et al., 2006) and Multiple Sclerosis (Burgetova et al., 2010;
Ellingson et al., 2012). For this reason, this classical imaging technique still has an intensive investment.
Following the MRI acquisition and hardware improvement, investigation into image processing related to the relaxometry acquisitions also increased in the scientiic literature. Signal decay modelling
(Lebel and Wilman, 2010), image denoising algorithms (Feng et al., 2014; Senra et al., 2014)
and multi-echo spatial acquisition (Kumar et al., 2012) are some examples of the different image acquisition and processing applied to relaxometry images in order to obtain a more precise relaxation estimate. However, a simulated environment is also important for the development of the research, giving a standard and controlled environment to test new image acquisitions and image processing techniques. In contrast, some computational brain simulations for structural and functional MRI images are well known and widely used in many studies (Chau and McIntosh, 2005; Cocosco et al., 1997; Drobnjak et al.,
2006; Rykhlevskaia et al., 2008), but, unfortunately,
the relaxometry image simulation is still lacking for brain studies.
image processing toolkit to generate brain relaxometry images for research development.
Methods
The image used as ground-truth tissues to build the simulated relaxometry dataset here is based on the ICBM MRI template (MNI152 brain templates), providing both T1 and T2 weighted MRI images (Chau and McIntosh, 2005; Grabner et al., 2006).
The ICBM template is well-known in the scientiic literature in several brain studies, which provides a standard brain anatomical template from a sample of registered and normalized group of healthy individuals (Chau and McIntosh, 2005). Furthermore, with the ICBM template, the brain could be divided in different tissues, namely the white matter (WM), gray matter (GM) and cerebrospinal luid (CSF), among others (Cocosco et al., 1997; Collins et al.,
1998). For simplicity, this version of relaxometry simulation only uses the WM, GM and CSF tissues in the simulation process.
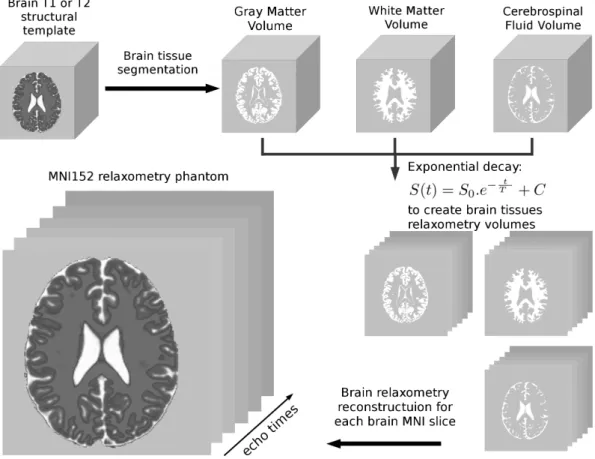
In summary, the brain tissues classiication and further signal decay simulation are based on a sequential image processing pipeline (Figure 1). Firstly, the brain extraction procedure follows with the neck removal option in the FSL-BET toolkit (Jenkinson et al., 2012; Popescu et al., 2012), which seems to be
more appropriate for structural MRI brain extraction (Popescu et al., 2012) and results in an image without voxels belonging on non-brain tissue. Secondly, the image segmentation process follows to extract each brain tissue, i.e. WM, GM, and CSF. In the tissue segmentation step, the expectation maximization algorithm, based on the image histogram classiication by the Gaussian mixture models (Jenkinson et al., 2012) and a Markov Random Field classiier are used to separate each brain tissue (Woolrich et al., 2009). Finally, the signal decay is simulated using a irst order exponential decay, providing the T1 and T2 characteristic tissue signal behaviour for each voxel in the whole brain. The mathematical model (Equation 1) used here is a irst order exponential, which is expected to simulate a irst approximation of the natural magnetization relaxation seen in the
Figure 1. Computational pipeline to reconstruct the tridimensional magnetic resonance imaging relaxometry maps. The entire image processing
MRI phenomena (Haacke et al., 1999). The T1 and T2 tissue decay constants are set using the normal brain tissue characteristics, reported in the literature (Wansapura et al., 1999), but the user can set other brain tissue relaxation constants according to their own criteria.
( ) .
t T
t o
S =S e− +C (1)
Where S0 is the irst signal acquired from the irst echo, the S(t) is the signal acquired after a time t, T is the tissue characteristic relaxation constant (T1 or T2) and C is an offset for exponential adjustment. The entire image processing pipeline used here uses the FMRIB Software Library (FSL) tools (Jenkinson et al., 2012).
In order to add more complexity in the brain simulations, two different image artefact possibilities are available: the Rician noise background and the radio-frequency (rf) coil inhomogeneity. Both types of artefacts are commonly assumed in anatomical MRI acquisition techniques and have an important impact for the majority of image processing approaches (Cárdenas-Blanco et al., 2008; Haacke et al., 1999).
The Rician noise intensity is based on the brightest tissue for each image acquisition, i.e. the WM signal intensity for T1 images and the CSF signal intensity on T2 images, and the rf inhomogeneity is based on low-frequency rf coils templates (Cocosco et al., 1997). Therefore, three different artefact levels for both the Rician noise (0%, 3% and 9%) and rf inhomogeneity artefacts (0%, 20% and 40%) are available. Here, for the image noise estimate, the same procedure was applied as that described in the BrainWeb brain simulation toolkit (Cocosco et al., 1997).
Furthermore, to provide a comparison between the simulation and real relaxometry estimative, a statistical analysis was conducted using real relaxometry data. A set of 10 real relaxometry images
from control asymptomatic subjects, with the same imaging acquisition protocol, was used. The imaging parameters were set as following: GRASE sequence, TR = 3000 ms, EPI factor 3, FOV = 230 × 230 mm2, in-plane resolution = 0.479 × 0.479 mm2, 20 slices, slice thickness = 2 mm, eleven time echos (TE = 24, 36, 48, 60, 72, 84, 96, 108, 120, 132 and 144 ms), and acquisition time = 6 min. A two-tailed statistical t-test (signiicance level of 95%) was used to show whether the simulation images provide the same T2 estimate as given in the real data. Furthermore, the absolute error (AE) analysis, between the simulated and real T2 estimate, was also calculated in the same dataset. Only a T2 relaxometry was conducted, but it is assumed that these results could relect a similar performance in a T1 weighted relaxometry case.
Results
After the image preparation, i.e. brain extraction, brain tissue segmentation and noise simulation procedures, the relaxometry reconstruction is conducted. These initial image preparation steps are illustrated
in Figure 1, where the image voxel-wise relaxometry
signals are modelled using Equation 1. Each brain tissue has a different relaxation constant value and for this reason, the WM, GM, and CSF tissues must be segmented before the signal decay simulation.
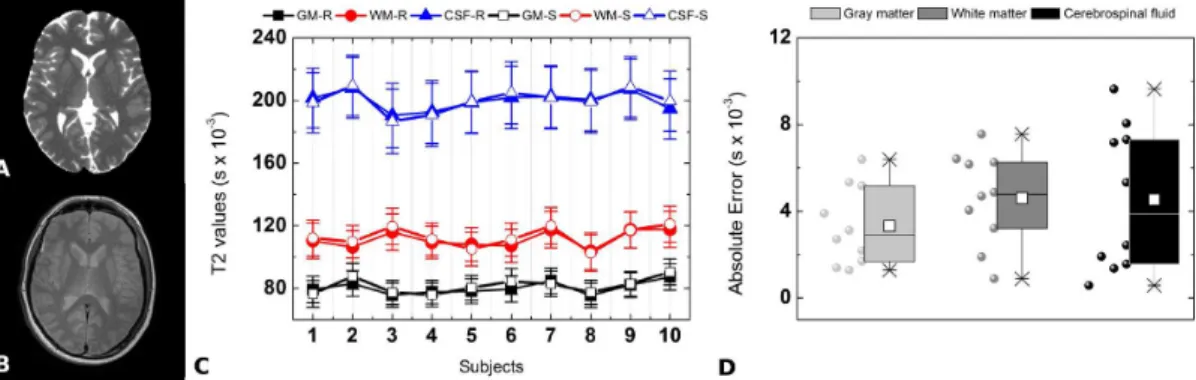
It were reconstructed a whole-brain T2 relaxometry map for each real relaxometry subject. The same irst order exponential was used here. The mean T2 value, for each brain tissue, found in the real data was used as initial parameter to create the T2 simulation. All segmented brain tissues (GM, WM, and CSF) were used as samples to calculate the mean T2 values. Figure 2A, B show an example for each T2 image, simulated and real, respectively. The noise and rf
Figure 2. Comparison between the real and simulated T2 relaxometry maps. A middle brain axial slice is given for (A) simulated and (B) real
inhomogeneity intensity for the simulated comparison were set as 3% and 20%, respectively, which gives a reasonable approximation for the artefact found in the real data. In addition to the T2 estimate, it is possible to compare the Absolute Error (AE) given by the absolute difference between the simulated and real relaxometry maps, which infer the accuracy of the simulation procedure. Figure 2C, D illustrate the results for the T2 relaxometry estimate and AE analysis.
Discussion
The brain relaxometry simulation models created here show a reliable brain structural dependence and also offer a better alternative when compared with the geometrical brain phantom provided in other image simulation tools (Hellerbach et al., 2013;
Koay et al., 2007; Van De Walle et al., 2000). Brain
structural and functional MRI image simulations are already available for different open-source toolkits, but only for limited options of MRI acquisitions (Jenkinson et al., 2012). The relaxometry mapping simulation still needs further developments and the toolkit presented here could be a further step in this necessary development.
Figure 2C shows the T2 values for each subject for GM, WM, and CSF tissues. Firstly, the T2 value variability is expected, due to image artefacts, where for both the real and simulated dataset offered a T2 variation of around 10%. For this reason, it is important to simulate those Rician and rf coil inhomogeneities in order to obtain a realistic signal variability. Secondly, the T2 simulated values (GM, WM, and CSF) also showed a statistical equivalence compared with the real data. Here the statistical test was evaluated, for all brain tissues, and maintained the H0 hypothesis, i.e. the simulated and real T2 estimate are not statistically different from each other. Finally, the AE analysis reveals that the simulated dataset offers T2 variability similar to what is seen in the real situation, roughly 10% of the mean value, where its signal luctuation is directly referred with the noise intensity given in the initial simulation parameters.
Additionally, this entire project is freely available for download on the internet (http://acsenrailho.github. io/relaxophantom) and it has an open-source license, which provides the liberty to use, adapt and share. Suggestions and collaborations of other researchers are also welcome for the improvement of this tool. At this stage, the toolkit only offers a limited range of noise and simulation parameters, which restricts a more complex study approach. However, in the near future, there is a plan for the expansion of new features such as other non-linear exponential decay simulations, magnetic susceptibility ield inhomogeneity, partial segmentation to simulate the partial volume effect in
near structural boundaries (WM/GM interface and deep gray matter structures) as well as adding other brain tissues such as fat, blood and others (Cocosco et al., 1997). Moreover, a graphic user interface could be implemented to offer a friendly interaction between the user and the software, which is at the moment, only via command terminal lines.
In conclusion, the tool described here is a suitable alternative for recreating a reasonable brain relaxometry acquisition with controlled imaging artefacts, bringing the convenience of a robust neuroscience toolkit for future research and brain image processing studies.
Acknowledgements
The author would like to thank CAPES and CNPQ (201871/2015-7/SWE) for the financial support and both Jeam Haroldo Oliveira Barbosa and Prof. Dr. Carlos Ernesto Garrido Salmon for providing the real relaxometry dataset and for the fruitful discussions.
References
Barbosa JHO, Santos AC, Tumas V, Liu M, Zheng W, Haacke EM, Salmon CEG. Quantifying brain iron deposition in patients with Parkinson’s disease using quantitative susceptibility mapping, R2 and R2. Magnetic Resonance Imaging. 2015; 33(5):559-65. PMid:25721997.http://dx.doi.org/10.1016/j. mri.2015.02.021.
Burgetova A, Seidl Z, Krasensky J, Horakova D, Vaneckova M. Multiple sclerosis and the accumulation of iron in the Basal Ganglia: quantitative assessment of brain iron using MRI t(2) relaxometry. European Neurology. 2010; 63(3):136-43. PMid:20130410.http://dx.doi.org/10.1159/000279305. Cárdenas-Blanco A, Tejos C, Irarrazaval P, Cameron I. Noise in magnitude magnetic resonance images. Concepts in Magnetic Resonance – Part A. 2008; 32(6):409-16. http:// dx.doi.org/10.1002/cmr.a.20124.
Carneiro AAO, Vilela GR, Araujo DB, Baffa O. MRI relaxometry: methods and applications. Brazilian Journal of Physics. 2006; 36(1a):9-15. http://dx.doi.org/10.1590/ S0103-97332006000100005.
Chau W, McIntosh AR. The Talairach coordinate of a point in the MNI space: how to interpret it. NeuroImage. 2005; 25(2):408-16. PMid:15784419.http://dx.doi.org/10.1016/j. neuroimage.2004.12.007.
Imaging. 1998; 17(3):463-8. PMid:9735909.http://dx.doi. org/10.1109/42.712135.
Deoni SCL. Quantitative relaxometry of the brain. Topics in Magnetic Resonance Imaging. 2010; 21(2):101-13. PMid:21613875. http://dx.doi.org/10.1097/RMR.0b013e31821e56d8. Drobnjak I, Gavaghan D, Pitt-Francis J, Jenkinson M. Development of a functional magnetic resonance imaging simulator for modeling realistic rigid-body motion artifacts. Magnetic Resonance in Medicine. 2006; 56(2):364-80. PMid:16841304.http://dx.doi.org/10.1002/mrm.20939. Ellingson BM, Cloughesy TF, Lai A, Nghiemphu PL, Lalezari S, Zaw T, Motevalibashinaeini K, Mischel PS, Pope WB. Quantification of edema reduction using differential quantitative T2 (DQT2) relaxometry mapping in recurrent glioblastoma treated with bevacizumab. Journal of Neuro-Oncology. 2012; 106(1):111-9. PMid:21706273.http://dx.doi.org/10.1007/ s11060-011-0638-x.
Feng Y, He T, Feng M, Carpenter JP, Greiser A, Xin X, Chen W, Pennell DJ, Yang GZ, Firmin DN. Improved pixel-by-pixel MRI R2* relaxometry by nonlocal means. Magnetic Resonance in Medicine. 2014; 72(1):260-8. PMid:23963595. http://dx.doi.org/10.1002/mrm.24914.
Grabner G, Janke AL, Budge MM, Smith D, Pruessner J, Collins DL. Symmetric atlasing and model based segmentation: an application to the hippocampus in older adults. In: MICCAI 2006: 9th International Conference on Medical Image Computing and Computer Assisted Intervention; 2006 Oct 1-6; Copenhagen, Denmark. Montréal: Springer; 2006. p. 58-66. PMID:17354756.
Haacke EM, Brown RW, Thompson MR, Venkatesan R. Magnetic resonance imaging: physical principles and sequence design. 4th ed. Hoboken: Wiley; 1999.
Hasan KM, Walimuni IS, Kramer LA, Narayana PA. Human brain iron mapping using atlas-based T2 relaxometry. Magnetic Resonance in Medicine. 2012; 67(3):731-9. PMid:21702065. http://dx.doi.org/10.1002/mrm.23054.
Hellerbach A, Schuster V, Jansen A, Sommer J. MRI phantoms: are there alternatives to Agar? PLoS One. 2013; 8(8):e70343. PMid:23940563.http://dx.doi.org/10.1371/ journal.pone.0070343.
House MJ, St. Pierre, TG, Foster JK, Martins RN, Clarnette R. Quantitative MR imaging R2 relaxometry in elderly participants reporting memory loss. American Journal of Neuroradiology. 2006; 27(2):430-9. PMD 16484425. Jenkinson M, Beckmann CF, Behrens TEJ, Woolrich MW, Smith SM. FSL. NeuroImage. 2012; 62(2):782-90. PMid:21979382. http://dx.doi.org/10.1016/j.neuroimage.2011.09.015. Koay CG, Sarlls JE, Özarslan E. Three-dimensional analytical magnetic resonance imaging phantom in the Fourier domain.
Magnetic Resonance in Medicine. 2007; 58(2):430-6. PMid:17616967.http://dx.doi.org/10.1002/mrm.21292. Kosior RK, Lauzon ML, Federico P, Frayne R. Algebraic T2 estimation improves detection of right temporal lobe epilepsy by MR T2 relaxometry. NeuroImage. 2011; 58(1):189-97. PMid:21689766.http://dx.doi.org/10.1016/j. neuroimage.2011.06.002.
Kumar D, Nguyen TD, Gauthier SA, Raj A. Bayesian algorithm using spatial priors for multiexponential T 2 relaxometry from multiecho spin echo MRI. Magnetic Resonance in Medicine. 2012; 68(5):1536-43. PMid:22266707.http:// dx.doi.org/10.1002/mrm.24170.
Lebel RM, Wilman AH. Transverse relaxometry with stimulated echo compensation. Magnetic Resonance in Medicine. 2010; 64(4):1005-14. PMid:20564587.http://dx.doi.org/10.1002/ mrm.22487.
Popescu V, Battaglini M, Hoogstrate WS, Verfaillie SCJ, Sluimer IC, van Schijndel RA, van Dijk BW, Cover KS, Knol DL, Jenkinson M, Barkhof F, de Stefano N, Vrenken H. Optimizing parameter choice for FSL-Brain Extraction Tool (BET) on 3D T1 images in multiple sclerosis. NeuroImage. 2012; 61(4):1484-94. PMid:22484407.http://dx.doi. org/10.1016/j.neuroimage.2012.03.074.
Rykhlevskaia E, Gratton G, Fabiani M. Combining structural and functional neuroimaging data for studying brain connectivity: A review. Psychophysiology. 2008; 45(2):173-87. PMid:17995910. http://dx.doi.org/10.1111/j.1469-8986.2007.00621.x. Senra ACS, Fo, Barbosa JHO, Salmon CEG, Murta, LOM Jr. Anisotropic anomalous diffusion filtering applied to relaxation time estimation in Magnetic Resonance Imaging. In: EMBC 2014: Proceedings of the 36th Annual International Conference of the IEEE Engineering in Medicine and Biology Society; 2014 Aug 26-30; Chicago, USA. New York: IEEE; 2014. p. 3893-6. http://dx.doi.org/10.1109/EMBC.2014.6944474. Van De Walle R, Barrett HH, Myers KJ, Altbach MI, Desplanques B, Gmitro AF, Cornelis J, Lemahieu I. Reconstruction of MR images from data acquired on a general nonregular grid by pseudoinverse calculation. IEEE Transactions on Medical Imaging. 2000; 19(12):1160-7. PMid:11212364.http://dx.doi. org/10.1109/42.897806.
Wansapura JP, Holland SK, Dunn RS, Ball WS Jr. NMR relaxation times in the human brain at 3.0 tesla. Journal of Magnetic Resonance Imaging. 1999; 9(4):531-8. PMid:10232510. http://dx.doi.org/10.1002/(SICI)1522-2586(199904)9:4<531::AID-JMRI4>3.0.CO;2-L. Woolrich MW, Jbabdi S, Patenaude B, Chappell M, Makni S, Behrens T, Beckmann C, Jenkinson M, Smith SM. Bayesian analysis of neuroimaging data in FSL. NeuroImage. 2009; 45(1 Suppl):S173-86. PMid:19059349.http://dx.doi.org/10.1016/j. neuroimage.2008.10.055.
Author
Antonio Carlos da Silva Senra Filho1,2*
1 Department of Computing and Mathematics, Faculty of Philosophy, Science and Letters of Ribeirão Preto, Universidade
de São Paulo – USP, Avenida Bandeirantes, 3900, Monte Alegre, CEP 14040900, Ribeirão Preto, SP, Brazil.
2 Department of Neuroimaging, Institute of Psychiatry, Psychology & Neuroscience, King’s College London, London,