Abstract
In the present investigation, response of the stiffened sandwich foam panels with closed-cell aluminum foam cores subjected to blast load is examined. The panels have the metal foam sand-wiched between two steel sheets. To improve resistance of the sandwich foam panel against blast, stiffeners are provided and their dynamic response under varying blast load is studied. Blast load is applied using blast equations available in LS-DYNA which takes into account reflection of blast from surface of the sandwich foam panel. Finite element based numerical simulations for dy-namic analysis are performed employing a combination of shell and solid elements for steel sheets and metal foam, respectively. Quantitative assessment of dynamic response of the sandwich foam panels is made, primarily focusing on peak central point displacement of back-sheet (opposite to explosion) of the panel. Several analyses are carried out with an objective to understand the effects of stiffener configuration, foam thickness, foam density, and standoff distance on the blast response. Results indicate that the provision of stiffeners along with metal foam considerably increases blast resistance as compared to the unstiffened panels with the metal foam.
Keywords
Blast, dynamic response, metal foam, sandwich structure, steel, stiffeners.
Blast Resistance of Stiffened Sandwich Panels
with Closed-Cell Aluminum Foam
1 INTRODUCTION
Foam core sandwich panels have experienced an increased use for various applications such as sacri-ficial blast walls in buildings, side walls in cargo containers and boxes, and various military applica-tions (Ashby et al., 2000). These panels possess excellent properties such as lightweight, high specif-ic stiffness, moisture independency, and corrosion resistance. In the past, several researchers studied
Manmohan Dass Goel a Vasant A. Matsagar b Anil K. Gupta c
a Scientist, CSIR-Advanced
Materi-als and Processes Research Institute (AMPRI), Council of Scientific and Industrial Research (CSIR), Bhopal - 462 026, India.
E-mail: [email protected] bAssociate Professor, Department of
Civil Engineering, Indian Institute of Technology (IIT) Delhi, New Delhi - 110 016, India.
E-mail: [email protected] c Former Director, CSIR-Advanced
Materials and Processes Research Institute (AMPRI), Council of Scien-tific and Industrial Research (CSIR), Bhopal - 462 026, India.
E-mail: [email protected]
Latin American Journal of Solids and Structures 11 (2014) 2497-2515
blast response of the sandwich foam panels and presented the effectiveness of these panels under blast loading (Guruprasad and Mukherjee, 2000a and 2000b, Hanssen et al., 2002a and 2002b, Qiu et al., 2003, Xue and Hutchinson, 2003, Radford et al., 2006, Sriram et al., 2006, Nemat-Nasser et al., 2007, Bahei-El-Din and Dvorak, 2008, Tekalur et al., 2008, Karagiozova et al., 2009, Zhu et al., 2009, and Langdon et al., 2010). Recently, with the advancement in technology, metal foam has emerged as an important material in blast resistance applications due to their high energy absorp-tion potential (Ashby et al., 2000). This foam has several advantages in comparison with other commonly used sandwich core materials which include (i) higher specific stiffness; (ii) lighter in weight; (iii) fire resistant; and (iv) reusability.
Most of the past research work has been carried out on the sandwich foam panels with different varieties of core ranging from fiber reinforced polymer (FRP), natural material (air, sand/soils), polymeric foams, honeycombs and commercially available metal foams (Hanssen et al., 2002a and 2002b, Qiu et al., 2003, Xue and Hutchinson, 2003, Radford et al., 2006, Sriram et al., 2006, Nemat-Nasser et al., 2007, Bahei-El-Din and Dvorak, 2008, Tekalur et al., 2008, Karagiozova et al., 2009, Zhu et al., 2009, Langdon et al., 2010, Jing et al., 2013, Chang et al., 2013, and Liu et al., 2013). No studies, however, have been reported on the stiffened sandwich foam panels and their blast re-sponse, except author’s recent work on the response of stiffened polymer foam sandwich structures under impulsive loading (Goel et al., 2013a). Goel et al. (2013a) have reported effectiveness of ened sandwich structures with polymeric foams in blast resistance; however, effectiveness of stiff-ened metal foam sandwich structures has never been investigated.
In the present investigation, newly developed metal foam (Mondal et al., 2009a and 2009b) namely, closed-cell aluminum foam (ACCF) has been explored for its potential in blast applications, and its performance for blast resistance is presented. Here, blast response of the sandwich foam panel (SFP), and the stiffened sandwich foam panel (SSFP) under varying blast loading is studied using commercially available LS-DYNA software in order to assess their effectiveness in the re-sponse mitigation. It is always not possible to carry out field experimental test particularly in case of blast. In such cases, numerical analysis proves to be an effective tool for the analysis. Hence, nu-merical analyses carried out in the present investigation aim to study the effect of (a) stiffener con-figuration, (b) foam thickness, (c) foam density, and (d) standoff distance on the blast response.
2 STIFFENED SANDWICH FOAM PANEL GEOMETRY AND MATERIAL PROPERTIES
All the panels considered in present investigation have steel face- and back-sheets with ACCF as core. Back-sheet is on the opposite side of the explosion. The panels are square in shape (2 m × 2 m) with steel sheets of 10 mm thickness on each side. The back-sheet is stiffened by stiffeners of 100 mm width and 10 mm thickness for all the ten stiffened configurations with same materials (steel) as that of the face- and back-sheets. In order to investigate the effect of foam thickness on the blast response of stiffened sandwich foam panels, three foam thicknesses, 50 mm, 100 mm, and 150 mm, are considered.
stiff-Latin American Journal of Solids and Structures 11 (2014) 2497-2515
ener configurations, i.e. SSFP (P2 to P11). These configurations are arranged as per their increasing
weights. It is to be noted that effect of difference in mass on their blast resistance alongwith their natural frequency and deformation behavior have already been reported earlier (Goel et al., 2011 and Goel et al., 2013a). The face-sheet and stiffened back-sheet are made of steel considering elastic-plastic and strain hardening behavior with Young’s modulus, E = 210 GPa, Poisson’s ratio, = 0.3, and density, = 7,800 kg/m3 (Goel et al., 2011). The static yield stress of steel in the face- and back-sheets is 300 MPa. The steel face- and back-sheets along with stiffeners are modeled using elastic-plastic material model, i.e. MAT_024 (MAT_PIECEWISE_LINEAR_PLASTICITY) of LS-DYNA. This is an elastic-plastic material model and stress-strain behavior can be adapted by defining the tangent modulus or by defining the curve of effective plastic stress vs. effective plastic strain, which is equivalent to true stress vs. true strain in case of uniaxial stresses (LS-DYNA, 2011). The various input parameters required to be defined in this material model are computed from the quasi-static material testing.
Figure 1: Sandwich foam panel configurations arranged in order of increasing weights.
CSIR-Latin American Journal of Solids and Structures 11 (2014) 2497-2515
AMPRI using BiSS Universal Testing Machine (Model Bi-00-002, 50 kN Load Cell) at a strain rate of 0.001/s. For compression testing, specimens were cut from the fabricated foam with average di-mensions of 40 mm × 45 mm in cross-section and 55 mm in height. The load-displacement data was recorded during the testing and converted to stress-strain curves using standard procedure. The mechanical behavior of these foam materials is reported elsewhere in details (Mondal et al., 2009a and 2009b, and Goel et al., 2013b). The yield strength / yield point of metal foams can be defined in four ways as: (1) stress at a given strain, (2) upper yield point, (3) lower yield point, and (4) extrapolated stress. In the present investigation, yield strength / yield point is considered as upper yield point as shown in Figure 2. Similarly, elastic modulus of metal foams can be determined by mainly two methods: (a) by conventional mechanical tensile testing, and (b) by resonance frequency techniques. Herein, the resonance frequency technique is employed for determination of elastic mod-ulus (Mondal et al., 2009a and 2009b). It is to be noted that this foam has closed cell structure which is considered superior in energy absorption applications as compared to the open cell foam (Ashby et al., 2000).
0.0 0.2 0.4 0.6 0.8
0 2 4 6 8 10 12
RD = 0.107
RD = 0.114
Stress (M
P
a)
Strain
Yield point Plastic collapse region
Densification region
Linear elastic region Aluminum
Closed Cell Foam (ACCF)
RD = 0.100
Figure 2: Compressive stress-strain curves for closed-cell aluminum foam.
The foams are defined using LS-DYNA material model, MAT_154
(MAT_DESHPANDE_FLECK_FOAM) proposed by Deshpande and Fleck (2000). Following Deshpande-Fleck foam model, yield stress function (Φ) of foam material is defined as,
y e σ
σ
Φ , where, σy is the yield stress of foam material and σeis the equivalent stress defined
as,
22 m 2 2 VM 2 e
3 / α 1
σ α σ σ
. In this expression,
VM is the von-Mises stress and σm is the mean stress.The shape of yield surface is controlled by the shape parameter,
α
. The yield stress is governed by the model presented by Hanssen et al. (2002a and 2002b) as,
β
D 2
D p y
1 1 ln
α λ σ σ
e e e
e
Latin American Journal of Solids and Structures 11 (2014) 2497-2515
where,
e
is engineering strain;p
σ is plateau stress; λ, α2, and β are material parameters; and
D
e is the foam densification strain expressed in terms of density of the foam (
f
ρ ) and density of the parent material (ρ0) as,
0 f D
ρ ρ
ln
e (2)
A nonlinear curve fit program in MATLAB is developed to compute the different parameters of the foam model. Table 1 shows various mechanical properties obtained using the MATLAB non-linear curve fit program for the foam used in the present investigation.
Type of Foam RD E
(GPa)
(MPa)
2
(MPa)
σp
(MPa)
Closed-cell aluminum foam
(ACCF)
0.100 1.1 0.0253 1.605 2.17 0.77
0.107 1.2 0.202 2.086 2.14 1.17
0.114 1.3 0.861 1.27 2.18 1.71
Table 1: Foam material properties.
3 FINITE ELEMENT MODELS AND BLAST LOADING
Latin American Journal of Solids and Structures 11 (2014) 2497-2515
4 BLAST LOADING
The blast load in the present investigation is applied on face-sheet of the sandwich foam panels using blast function (LOAD_BLAST_ENHANCED) available in LS-DYNA with CONWEP (CONWEP, 1991). This formulation takes into account pressure enhancement due to reflection of blast from the surface of sandwich foam panels and is analyzed for three different standoff dis-tances, i.e. 1.5 m, 2.0 m, and 2.5 m. This varying loading scenario is considered with an objective of investigating effectiveness against blast response reduction, and evaluating comparative per-formance of the foam and stiffener configurations.
Time dependent blast pressure, P(t) on the face is determined based on the input amount of
Tri-nitrotoluene (TNT), the standoff distance, and angle of incidence, . Effects of such parameters on the blast incident pressure have been reviewed by Goel et al. (2012). The blast pressure is comput-ed using following equation in LS-DYNA,
t
P
θ
P
θ
θ
P
rcos
2
i1
cos
2
2
cos
(3)where, Pr and Pi are the reflected and incident pressures, respectively. Computation of Pr and Pi
is reported in details elsewhere (Goel et al., 2012). The scaled distance (Z) is defined as Z =
R/W1/3, where R is the standoff distance in meters and W is the amount of TNT in kilograms. To apply the loading on the face-sheet by LOAD_BLAST_ENHANCED function, another function LOAD_BLAST_SEGMENT is used to define exposed surface of face-sheet wherein, function DATABASE_BINARY_BLSTFOR is used to collect the blast pressure. The calculated loading is presented in Figure 3 for three different standoff distances considered. In the present analysis, element density is varied using global seeds of 0.01, 0.05, and 0.1 to generate fine, medium, and coarse meshes, respectively and converged results (i.e. finite element mesh with global seed of 0.05) are only presented. Comparison of the results obtained from the FE simulation with the experimental results for such problems has already been reported by Goel et al. (2011 and 2013a).
Latin American Journal of Solids and Structures 11 (2014) 2497-2515 5 RESULTS AND DISCUSSION
Numerical analyses carried out in the present investigation aim to study the effect of (a) stiffener configuration, (b) foam thickness, (c) foam density, and (d) standoff distance on the blast re-sponse. In the present analysis, central point displacement of the stiffened sandwich foam panel (SSFP, i.e. P2 to P11) is compared with the sandwich foam panel (SFP, i.e. P1) designated as base
model (referenced as 100% weight). It is to be noted that the displacement is recorded at the center of the back-sheet in all cases with respect to time, and absolute peak values (peak) are presented wherever applicable. The measure of effectiveness of the sandwich foam panel is quanti-fied using central point displacement; such that lower the central point displacement higher the effectiveness.
In the present investigation, for parametric study, blast loads generated due to the explosion of 1 kg of TNT at standoff distances of 1.5 m, 2.0 m, and 2.5 m are considered. The peak pres-sures resulting due to this combination of TNT and standoff distances are shown in Figure 3. The face-sheet of the panels is exposed to blast and the TNT is placed exactly at the centre maintain-ing the considered standoff distances of the panels (Figure 3). Three different relative densities (RD) of the foam (0.100, 0.107, and 0.114) are used for core material, as reported in Table 1. Figure 4 shows the central point displacement time histories of the SSFP-ACCF panels for three thicknesses of the foam core (tf = 50, 100, and 150 mm), for a foam relative density of 0.100 and standoff distance of 1.5 m subjected to the blast loading. Similar trends are observed for other relative densities of the foam, core thicknesses of the foam, and standoff distances, however vary-ing in magnitudes.
Latin American Journal of Solids and Structures 11 (2014) 2497-2515 -0.02 -0.01 0.00 0.01 0.02
0.00 0.01 0.02 0.03 0.04 0.05 -0.02
-0.01 0.00 0.01 0.02
0.00 0.01 0.02 0.03 0.04 0.05 -0.02 -0.01 0.00 0.01 0.02 SSFP-ACCF Ce n tr al Po int D isp la ce me n t ( m )
P1 ; peak = 0.02057 m P2 ; peak = 0.00585 m P3 ; peak = 0.00418 m P4 ; peak = 0.01693 m P5 ; peak = 0.01527 m
P10 ; peak = 0.01723 m P11 ; peak = 0.00418 m
SSFP-ACCF
P6 ; peak = 0.00568 m P7 ; peak = 0.02047 m P8 ; peak = 0.00670 m P9 ; peak = 0.00451 m
SSFP-ACCF Ce nt ra l Poi n t D isp la ce me nt ( m ) Time (s)
P1 ; peak = 0.02072 m P2 ; peak = 0.00490 m P3 ; peak = 0.00395 m P4 ; peak = 0.01670 m P5 ; peak = 0.01420 m
P10; peak = 0.01745 m P11; peak = 0.00807 m P6 ; peak = 0.00558 m
P7 ; peak = 0.02069 m P8 ; peak = 0.01086 m P9 ; peak = 0.00440 m
SSFP-ACCF
P10 ; peak = 0.01731 m P11 ; peak = 0.00393 m
SSFP-ACCF
Time (s)
P6 ; peak = 0.00498 m P7 ; peak = 0.02042 m P8 ; peak = 0.00663 m P9 ; peak = 0.00413 m
t f = 100 mm t
f = 100 mm
t
f = 150 mm tf = 150 mm
SSFP-ACCF Ce n tr al P o in t D is p la ce me n t ( m )
P1 ; peak = 0.02070 m P2 ; peak = 0.00626 m P3 ; peak = 0.00422 m P4 ; peak = 0.01828 m P5 ; peak = 0.01700 m
t f = 50 mm t
f = 50 mm
Latin American Journal of Solids and Structures 11 (2014) 2497-2515 -0.02 -0.01 0.00 0.01 0.02 -0.008 -0.006 -0.004 -0.002 0.000 0.002 -0.004 -0.002 0.000 0.002 -0.02 -0.01 0.00 0.01 -0.02 -0.01 0.00 0.01 -0.006 -0.004 -0.002 0.000 0.002
0.00 0.01 0.02 0.03 0.04 0.05 -0.004
-0.002 0.000 0.002
0.00 0.01 0.02 0.03 0.04 0.05 -0.02
-0.01 0.00 0.01
0.00 0.01 0.02 0.03 0.04 0.05 -0.010 -0.005 0.000 0.005 -0.02 -0.01 0.00 0.01 0.02 -0.010 -0.005 0.000 0.005 0.010
P1 P2 P3 P4 P5 P6 P7 P8 P9 P10 P11
-0.024 -0.020 -0.016 -0.012 -0.008 -0.004 P
1 P2
RD = 0.100 RD = 0.107 RD = 0.114, TNT = 1 kg, R = 1.5 m, t
f = 50 mm
P 3 P 4 Cent ra l P o int Di spl a cem ent (m) P
5 P6
P 9 Stiffener Configurations P10 Time (s) P 11 P
7 P8
RD = 0.100 RD = 0.107 RD = 0.114
Latin American Journal of Solids and Structures 11 (2014) 2497-2515
Case 1: Sandwich foam panels with 50, 100, and 150 mm thick foam core with 1 kg TNT and 1.5 m standoff distance
Comparison of peak central point displacements of the sandwich foam panels with different rela-tive densities for 50 mm thick foam core show that the panels with foam relarela-tive density of 0.100 results in lowest peak central point displacement for all the panel configurations (except P3 and
P9) as compared to the panels with foam core relative densities of 0.107 and 0.114 for the same
level of blast loading (Table 2 and Figure 4). The lowest central point displacement (i.e. 4.13 mm) for 50 mm thick foam core is observed for the panel configuration P9 with RD = 0.114
(Ta-ble 2). However, the panel configuration P11 with RD = 0.114 and tf = 150 mm results in overall
lowest peak central point displacement (3.67 mm) for 1.5 m standoff distance (Table 2). This may be attributed to the fact that higher foam thickness available in these configurations result in lower impulse transfer to the back-sheet. It can further be noted that the introduction of foam results in higher response reduction except configuration P7 for all the relative densities of foam
and configuration P4 for RD = 0.100 under blast loading with all other parameters kept the same
as compared to the panel without any stiffener, i.e. P1. The reason for higher peak displacement
in case of the panels P4 and P7 is attributed to the fact that stiffeners in these configurations do
not pass through the centre point of the panels resulting in localized response. Similar observa-tions are made for the foam core thicknesses of 100 and 150 mm for P7, whereas configuration P4
results in lower peak central point displacement as compared to P1. However, in case of P1
con-figuration, increasing foam relative density results in enhancement of peak central point dis-placement with the higher thickness of foam core. Further, improved performance of the low den-sity foam with lowest foam thickness is achieved because the low denden-sity foam hardens at low stress levels than those with higher density foams for the same level of blast loading (Figure 2).
Panels Nomenclature
Peak Central Point Displacement (m) , peak
Stiffened Sandwich Foam Panel (SSFP)
ACCF, RD = 0.107, R = 1.5 m ACCF, RD = 0.114, R = 1.5 m
tf = 50
mm
tf = 100
mm
tf = 150
mm
tf = 50
mm
tf = 100
mm
tf = 150
mm
P1 (SFP) 0.02003 0.02142 0.02215 0.02200 0.02215 0.02290
P2 0.00646 0.00585 0.00585 0.00666 0.00585 0.00523
P3 0.00413 0.00417 0.00399 0.00421 0.00399 0.00368
P4 0.01926 0.01853 0.01979 0.02047 0.01979 0.01920
P5 0.01757 0.01552 0.01590 0.01739 0.01590 0.01592
P6 0.00572 0.00542 0.00505 0.00574 0.00505 0.00490
P7 0.02177 0.02193 0.02314 0.02253 0.02314 0.02368
P8 0.01133 0.00690 0.00683 0.01153 0.00683 0.00683
P9 0.00435 0.00434 0.00421 0.00413 0.00421 0.00369
P10 0.01797 0.01803 0.01882 0.01862 0.01882 0.02004
P11 0.00821 0.00413 0.00399 0.00853 0.00399 0.00367
Latin American Journal of Solids and Structures 11 (2014) 2497-2515 Case 2: Sandwich foam panels with 50, 100, and 150 mm thick foam core
with 1 kg TNT and 2 m standoff distance
Comparison of peak central point displacements of the sandwich foam panels with 50, 100, and 150 mm thick foam core with different relative densities show that the panels with foam relative density of 0.100 results in lowest peak central point displacement for all the panel configurations for the same level of blast loading (Figure 4). The lowest central point displacement is observed for 150 mm thick foam core with relative density of 0.100 for the panel configuration P11 (3.05
mm) for 2 m standoff distance (Table 3 and Figure 4).
Panels Nomenclature
Peak Central Point Displacement (m) , peak
Stiffened Sandwich Foam Panel (SSFP)
ACCF, RD = 0.107, R = 2 m ACCF, RD = 0.114, R = 2 m
tf = 50
mm
tf = 100
mm
tf = 150
mm
tf = 50
mm
tf = 100
mm
tf = 150
mm
P1 (SFP) 0.01596 0.02007 0.02008 0.01953 0.02109 0.02081
P2 0.00443 0.00431 0.00378 0.00464 0.00448 0.00385
P3 0.00328 0.00329 0.00316 0.00339 0.00340 0.00320
P4 0.01558 0.01607 0.01457 0.01618 0.01677 0.01478
P5 0.01308 0.01163 0.01147 0.01299 0.01220 0.01188
P6 0.00431 0.00450 0.00441 0.00441 0.00462 0.00440
P7 0.01836 0.01973 0.01924 0.01957 0.02057 0.01978
P8 0.00823 0.00626 0.00620 0.00852 0.00621 0.00624
P9 0.00356 0.00371 0.00360 0.00340 0.00377 0.00371
P10 0.01360 0.01510 0.01549 0.01458 0.01597 0.01566
P11 0.00664 0.00327 0.00311 0.00708 0.00337 0.00374
Table 3: Peak central point displacements for SFP- and SSFP-ACCF for different thicknesses and R = 2 m.
It can be further noted that the introduction of foam results in higher response reduction except for configuration P7 (50 mm thick foam core) for all foam relative densities however, excluding
foam relative density of 0.114 and 150 mm thick foam. The peak displacement of P7 configuration
with tf = 150 mm is 19.78 mm whereas the peak displacement of P1 configuration is 20.81 mm for
the same level of blast loading (Table 3). The reason for higher peak displacement in case of the panel P7 is attributed to the fact that stiffeners in this configuration do not pass through the
centre point of the panel, i.e. peak displacement point.
Latin American Journal of Solids and Structures 11 (2014) 2497-2515
Case 3: Sandwich foam panels with 50, 100, and 150 mm thick foam core with 1 kg TNT and 2.5 m standoff distance
The peak central point displacements of panels in this scenario of loading results in similar trend as observed for Case 2. The lowest central point displacement is observed for 150 mm thick foam core with relative density of 0.100 for the panel configuration P11 (2.45 mm) for 2.5 m standoff
distance (Table 4 and Figure 4).
It can be further noted that the introduction of foam results in higher response reduction ex-cept for configuration P7 (50 mm thick foam core) for all the relative densities of the foam. The
panel configuration P7, however, results in higher peak displacement as compared to that of the
P1 configuration with 50 mm thick foam for the same level of blast loading, for the same reason
as mentioned above that the stiffeners do not pass through the centre point of the panel.
The peak central point displacements of panels for this combination of loading exhibit varied trends for all the thicknesses of the foam core. Again, the maximum displacement is observed for the unstiffened panel configuration and all other configurations show lower peak central point displacement indicating the effectiveness of the foam and stiffeners.
Panels Nomenclature
Peak Central Point Displacement (m), peak
Stiffened Sandwich Foam Panel (SSFP)
ACCF, RD = 0.107, R = 2.5 m ACCF, RD = 0.114, R = 2.5 m
tf = 50
mm
tf = 100
mm
tf = 150
mm
tf = 50
mm
tf = 100
mm
tf = 150
mm
P1 (SFP) 0.01326 0.01820 0.01838 0.01867 0.01923 0.01946
P2 0.00357 0.00334 0.00308 0.00299 0.00351 0.00336
P3 0.00281 0.00278 0.00267 0.00421 0.00300 0.00284
P4 0.01438 0.01376 0.01311 0.01532 0.01450 0.01370
P5 0.01113 0.01027 0.00977 0.01098 0.01075 0.01015
P6 0.00343 0.00367 0.00347 0.00353 0.00379 0.00370
P7 0.01775 0.01807 0.01745 0.01907 0.01902 0.01849
P8 0.00778 0.00508 0.00539 0.00813 0.00504 0.00577
P9 0.00311 0.00323 0.00310 0.00328 0.00345 0.00330
P10 0.01336 0.01403 0.01382 0.01429 0.01482 0.01459
P11 0.00581 0.00278 0.00260 0.00630 0.00299 0.00284
Table 4: Peak central point displacements for SFP- and SSFP-ACCF for different thicknesses and R = 2.5 m
Parametric Study
Latin American Journal of Solids and Structures 11 (2014) 2497-2515 5.1 Effect of stiffener configurations
With the introduction of the stiffeners, the central point displacement decreases significantly in all the configurations as compared to the SFP only (i.e. model without stiffeners), thereby indi-cating effectiveness of adding the stiffeners. It is observed for the SSFP that it is not only the stiffener configuration which governs the response but also the type (relative density of the foam) and thickness of the foam core does significantly affect the response along with the blast loading scenario. Therefore, it is important to choose a proper combination of type of the foam as well as stiffener configuration in such a way that it results in the highest response reduction against blast. From Figure 6, it is concluded that the panels with circular stiffener configurations (P7,
P10, and P11) exhibit lower response reduction as compared to the panels with rectangular
stiffen-er configurations. It is found that introduction of foam results in highstiffen-er response reduction except for the panel with circular configuration for all the relative densities of foam and the panel with rhombus configuration (i.e. P4) for 0.100 relative density of foam with all other parameters kept
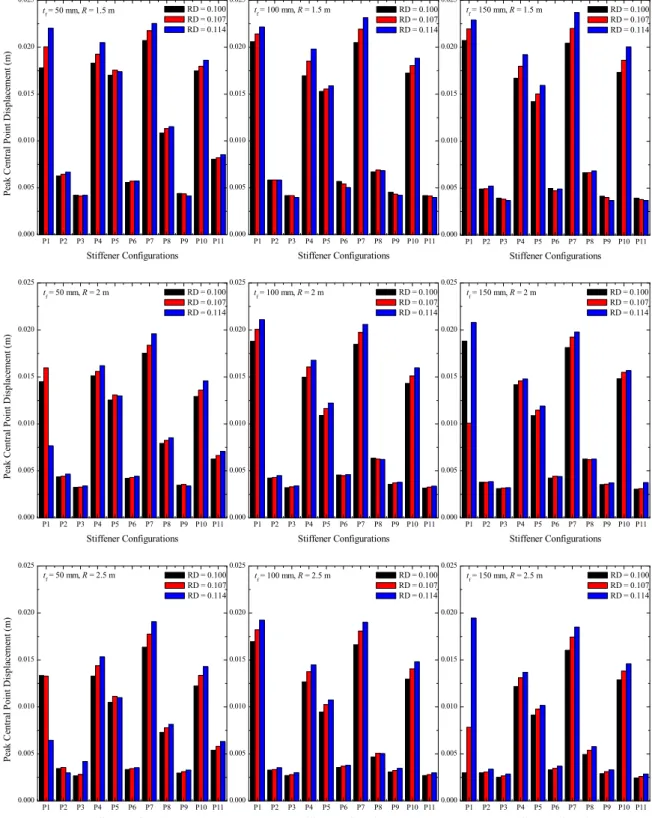
Latin American Journal of Solids and Structures 11 (2014) 2497-2515 P1 P2 P3 P4 P5 P6 P7 P8 P9 P10 P11 0.000 0.005 0.010 0.015 0.020 0.025 t
f = 100 mm, R = 1.5 m
Stiffener Configurations RD = 0.100 RD = 0.107 RD = 0.114
P1 P2 P3 P4 P5 P6 P7 P8 P9 P10 P11 0.000 0.005 0.010 0.015 0.020 0.025 P eak C ent ra l P o in t D is p lace m en t (m ) Stiffener Configurations RD = 0.100 RD = 0.107 RD = 0.114
t
f = 50 mm, R = 1.5 m
P1 P2 P3 P4 P5 P6 P7 P8 P9 P10 P11 0.000 0.005 0.010 0.015 0.020 0.025 t
f = 150 mm, R = 1.5 m
Stiffener Configurations RD = 0.100 RD = 0.107 RD = 0.114
P1 P2 P3 P4 P5 P6 P7 P8 P9 P10 P11 0.000 0.005 0.010 0.015 0.020 0.025 t
f = 50 mm, R = 2 m
P eak C en tr al P o in t D is p lacemen t ( m ) Stiffener Configurations RD = 0.100 RD = 0.107 RD = 0.114
P1 P2 P3 P4 P5 P6 P7 P8 P9 P10 P11 0.000 0.005 0.010 0.015 0.020 0.025 t
f = 100 mm, R = 2 m
Stiffener Configurations RD = 0.100 RD = 0.107 RD = 0.114
P1 P2 P3 P4 P5 P6 P7 P8 P9 P10 P11 0.000 0.005 0.010 0.015 0.020 0.025 t
f = 150 mm, R = 2 m
Stiffener Configurations RD = 0.100 RD = 0.107 RD = 0.114
P1 P2 P3 P4 P5 P6 P7 P8 P9 P10 P11 0.000 0.005 0.010 0.015 0.020 0.025 t
f = 50 mm, R = 2.5 m
P eak C ent ra l P o in t D is p lacem ent ( m ) Stiffener Configurations RD = 0.100 RD = 0.107 RD = 0.114
P1 P2 P3 P4 P5 P6 P7 P8 P9 P10 P11 0.000 0.005 0.010 0.015 0.020 0.025 t
f = 100 mm, R = 2.5 m
Stiffener Configurations RD = 0.100 RD = 0.107 RD = 0.114
P1 P2 P3 P4 P5 P6 P7 P8 P9 P10 P11 0.000 0.005 0.010 0.015 0.020 0.025 t
f = 150 mm, R = 2.5 m
Stiffener Configurations RD = 0.100 RD = 0.107 RD = 0.114
Latin American Journal of Solids and Structures 11 (2014) 2497-2515 5.2 Effect of foam thickness
From Figure 6 it is observed that the central point displacement decreases with the increase in the foam core thickness for the ACCF. This is evident because of higher energy dissipation and increased stiffness of the core. Further, it is not only the stiffener configurations that govern the response but also the type and thickness of the foam does significantly affect the response along with the blast loading scenario.
5.3 Effect of foam relative density
It is evident from the trends observed in Figure 6 that the higher density of foam core results in higher peak central point displacements. Further, it is found that panels with least foam relative density results in lowest peak central point displacement for all the panel configurations (except for P3 and P9) as compared to the panels with other foam core relative densities for the same
level of blast loading. Moreover, it is observed that lowest central point displacement for 50 mm thick foam core for the panel configuration P9 with highest foam relative density for least standoff
distance considered in the present investigation. From this study, it is observed that lowest ty foam largely performs better with lowest foam thickness in comparison with higher foam densi-ties and thicknesses for least standoff distance considered in the present investigation.
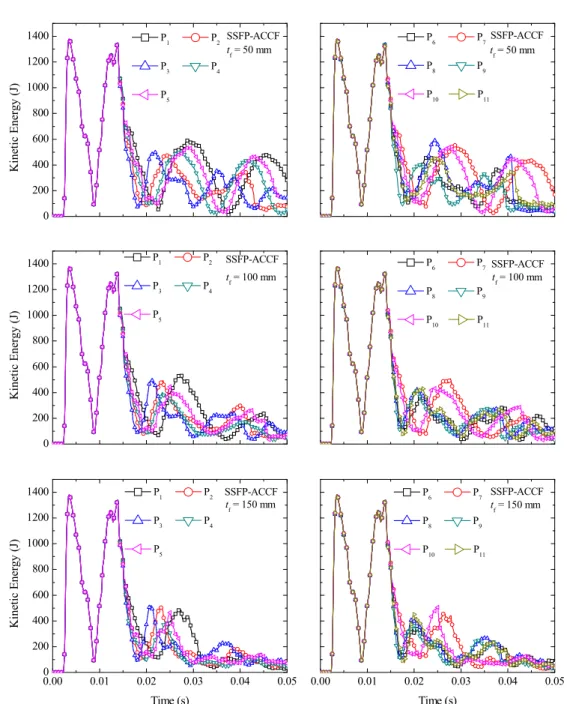
5.4 Energy balance study
Latin American Journal of Solids and Structures 11 (2014) 2497-2515 0 200 400 600 800 1000 1200 1400
0.00 0.01 0.02 0.03 0.04 0.05
0 200 400 600 800 1000 1200 1400
0.00 0.01 0.02 0.03 0.04 0.05
0 200 400 600 800 1000 1200 1400 SSFP-ACCF In te rn al E n erg y (J )
P1 P2
P
3 P4
P5
SSFP-ACCF P
6 P7
P
8 P9
P
10 P11
SSFP-ACCF Int erna l En er gy (J ) Time (s) P
1 P2
P3 P4
P
5
SSFP-ACCF P
6 P7
P
8 P9
P
10 P11
SSFP-ACCF
Time (s)
P6 P7
P
8 P9
P10 P11
t f = 100 mm t
f = 100 mm
t
f = 150 mm tf = 150 mm
SSFP-ACCF Int erna l En er gy (J ) P
1 P2
P3 P4
P
5 tf = 50 mm
t f = 50 mm
Latin American Journal of Solids and Structures 11 (2014) 2497-2515 0
200 400 600 800 1000 1200 1400
0.00 0.01 0.02 0.03 0.04 0.05 0
200 400 600 800 1000 1200 1400
0.00 0.01 0.02 0.03 0.04 0.05 0
200 400 600 800 1000 1200 1400
SSFP-ACCF
K
ine
ti
c Ene
rgy (J)
P1 P2
P3 P4
P5
SSFP-ACCF P6 P7
P8 P9
P10 P11
SSFP-ACCF
K
inet
ic E
n
er
gy (J
)
Time (s)
P
1 P2
P3 P4
P5
SSFP-ACCF P6 P7
P8 P9
P10 P11
SSFP-ACCF
Time (s)
P6 P7
P8 P9
P10 P11
t f = 100 mm t
f = 100 mm
t
f = 150 mm tf = 150 mm
SSFP-ACCF
K
ine
ti
c Ene
rgy (
J)
P1 P2
P
3 P4
P5
t f = 50 mm t
f = 50 mm
Figure 8: Kinetic energies for SSF- and SSF-ACCF, tf = 50, 100, and 150 mm, foam RD = 0.100, R = 1.5 m.
6 CONCLUSIONS
Latin American Journal of Solids and Structures 11 (2014) 2497-2515
1. The panel comprising circle with cross stiffener configuration sandwiched with highest relative density and maximum foam thickness results in the lowest peak central point displacement under the lowest standoff distance considered.
2. Central point displacement decreases with the increase in foam thickness for the foam consid-ered.
3. Introduction of foam results in higher response reduction except for the panel with circular con-figuration.
4. Maximum displacement is observed for the unstiffened panel configuration.
5. Lowest density foam largely performs better with lowest foam thickness in comparison with higher foam densities and thicknesses for least standoff distance considered in the present investiga-tion.
6. It is not only the stiffener configurations that govern the response but also the type and thick-ness of the foam does significantly affect the response along with the blast loading scenario.
7. The total internal energy of the unstiffened sandwich foam panel is higher than that of the ened sandwich foam panel and so is the kinetic energy for both the types of foams and all the stiff-ener configurations considered in the present investigation.
References
ALTAIR (2007). User Manual. Altair Engineering Corporation, U.S.A.
Ashby, M.F., Evans, A.G. and Fleck, N.A., (2000). Metal Foams: A Design Guide, Butterworth Heinmann, Ox-ford, U.K.
Bahei-El-Din, Y.A. and Dvorak, G.J., (2008). Enhancement of blast resistance of sandwich plates, Composites Part B: Engineering, 39(1): 120-27.
Chang, Q., Shu, Y., Li-Jun, Y., Zhi-Yong, W., Zhen-Hua, L., (2013). Blast resistance and multi-objective optimi-zation of aluminum foam-cored sandwich panels, Composite Structures, 105: 45-57.
CONWEP (1991). Conventional Weapons Effects Program, Version 2.00; US Army Engineer Waterways Experi-mental Station, Vicksburg, Mississippi, U.S.A.
Deshpande, V.S. and Fleck, N.A., (2000). Isotropic constitutive models for metallic foams, Journal of the Mechan-ics and PhysMechan-ics of Solids, 48(6): 1253-83.
Goel, M.D., Matsagar,V.A., Gupta, A.K., (2011). Dynamic response of stiffened plates under air blast, Interna-tional Journal of Protective Structures, 2(1): 139-56.
Goel, M.D., Matsagar,V.A., Gupta, A.K., Marburg, S., (2012). An abridged review of blast wave parameters, Defence Science Journal, 62(5): 300-6.
Goel, M.D., Matsagar, V.A., Marburg, S., Gupta, A.K., (2013a). Comparative performance of stiffened sandwich foam panels under impulsive loading, Journal of Performance of Constructed Facilities, ASCE, 27(5): 540-49. Goel, M.D., Matsagar, V.A., Gupta, A.K., Marburg, S., (2013b). Strain rate sensitivity of closed cell aluminum fly ash foam, Transactions of Nonferrous Metals Society of China, 23: 1080-89.
Guruprasad, S. and Mukherjee, A., (2000a). Layered sacrificial claddings under blast loading part-I analytical studies, International Journal of Impact Engineering, 24(9): 957-73.
Guruprasad, S. and Mukherjee, A., (2000b). Layered sacrificial claddings under blast loading part-II experimental studies, International Journal of Impact Engineering, 24(9): 975-84.
Latin American Journal of Solids and Structures 11 (2014) 2497-2515 Hanssen, A.G., Hopperstad, O.S., Langseth, M., Ilstad, H., (2002b). Validation of constitutive models applicable to aluminum foams, International Journal of Mechanical Sciences, 44: 359-406.
Jing, L., Yang, F., Wang, Z., Zhao, L., (2013).A numerical simulation of metallic cylindrical sandwich shell sub-jected to air blast loading, Latin American Journal of Solids and Structures, 10: 631-45.
Karagiozova, D., Nurick, G.N., Langdon, G.S., Yuen, S.C.K., Chi, Y., Bartle, S., (2009). Response of flexible sandwich-type panels to blast loading, Composites Science and Technology, 69(6): 754-63.
Langdon, G.S., Nurick, G.N., Yahya, M.Y., Cantwell, W.J., (2010). The response of honeycomb core sandwich panels with aluminum and composite face sheets to blast loading, Journal of Sandwich Structures and Materials, 12(6): 733-54.
Liu, H., Cao, Z.K., Yao, G.C., Luo, H.J., Zu, G.Y., (2013). Performance of aluminum foam–steel panel sandwich composites subjected to blast loading, Materials and Design, 47: 483-88.
LS-DYNA (2011). Theory Manual, Livermore Software Technology Corporation, Livermore, California, U.S.A. Mondal, D.P., Goel, M.D., Das, S., (2009a). Compressive deformation and energy absorption characteristics of closed cell aluminium-fly ash particle composite foam, Materials Science and Engineering: A, 507(1-2): 102-9. Mondal, D.P., Goel, M.D., Das, S., (2009b). Effect of strain rate and relative density on compressive deformation behavior of closed cell aluminum-fly ash composite foam, Materials and Design, 30(4): 1268-74.
Nemat-Nasser, S., Kang, W.J., McGee, J.D., Guo, W.-G., Isaacs, J.B., (2007). Experimental investigation of ener-gy-absorption characteristics of components of sandwich structures, International Journal of Impact Engineering, 34(6): 1119-46.
Qiu, X., Deshpande, V.S., Fleck, N.A., (2003). Finite element analysis of the dynamic response of clamped sand-wich beams subject to shock loading, European Journal of Mechanics - A/Solids, 22(6): 801-14.
Radford, D.D., McShane, G.J., Deshpande, V.S., Fleck, N.A., (2006). The response of clamped sandwich plates with metallic foam cores to simulated blast loading, International Journal of Solids and Structures, 43(7-8): 2243-59.
Sriram, R., Vaidya, U.K., Kim, J.-E., (2006). Blast impact response of aluminum foam sandwich composites, Journal of Materials Science, 41(13): 4023-39.
Tekalur, S.A., Shukla, A., Shivakumar, K., (2008). Blast resistance of polyuria based layered composite materials, Composite Structures, 84(3): 271-81.
Xue, Z. and Hutchinson, J.W., (2003). Preliminary assessment of sandwich plates subject to blast loads, Interna-tional Journal of Mechanical Sciences, 45(4): 687-705.