Abstract
For the properties of polymer are relative to its structure, the main purpose of the present work is to investigate the mechanical properties of the aeronautical PMMA which has been treated by the directional tensile technology. Isodyne images reveal the stress state in directional PMMA. And then, an anisotropic mechanical model is established. Furthermore, all mechanical parameters are measured by the digital image correlation method. Finally, based on the anisotropic mechanical model and mechanical parameters, the FEM numerical simulation and experimental methods are applied to analyze the fracture mechanical properties along different directions.
Keywords
aeronautical PMMA, isodyne method, digital image correlation
method, anisotropy, fracture
Study of anisotropic mechanical properties for
aeronautical PMMA
1 INTRODUCTION
Polymethyl methacrylate (PMMA) has many excellent performances such as lightweight, high temperature resistance, high light transmittance, and superior mechanical properties. Thus, the structures made of PMMA are widely used in aviation field.
The mechanical properties of PMMA have attracted considerable attentions since several planes crashed were caused by the cracks in the hatch. The researches in the fatigue and fracture properties of polymer materials started from the 1960s for the strict requirements of strength and reliability. Berry (1961) confirmed that Griffith strength theory could be used to analyze the brittle fracture of PMMA. Recently, this theory and experiments have become the important principles to analyze the brittle fracture of polymer material. Mukherjee and Burns (1971) proposed that the fatigue behaviors of PMMA were determined by three parameters: stress intensity factor amplitude,
W ei Shang a,b * Xiaojing Yang c Lina Zhang d
aInstitute of Engineering Mechanics, Tianjin Chengjian University, Tianjin 300384, China
bTianjin Key Laboratory of Soft Soil Characteristics and Engineering Environment, Tianjin Chengjian University, Tianjin 300384, China cSchool of Materials Science and Engineering, Hebei University of Technology, Tianjin 300130, China dAVIC Beijing Institute of
Aeronautical materials, Beijing 100095, China
Latin American Journal of Solids and Structures 11 (2014) 1777-1790
average stress intensity factor and frequency. Woo and Chow (1984) unified fatigue crack propagation formula of metal aluminum and nonmetal PMMA. They proposed that strain energy release rate amplitude should be used to analyze the crack propagation but not stress intensity factor amplitude. Cheng (1990a, 1990b) studied the influence of temperature and loading rate to tensile strength and fracture toughness of PMMA. Kim (1993, 1994) proposed that fatigue crack growth rate of most polymers increased with the temperature increasing and decreased with the loading frequency increasing. Ramsteiner and Armbrust (2001) solved some fatigue experimental questions of polymers such as the measurement of crack propagation, the influence of the specimen shape and the applied frequency, the measurement with constant or increasing stress intensity amplitude, and the propagating crack as a signal for transitions in internal deformation mechanisms. Yao (2002, 2003, 2004) investigated dynamic fracture behavior of thin PMMA plates with three- and four-parallel edge cracks by means of the method of caustics in combination with a high-speed Schardin camera; dynamic fracture behavior of the thin PMMA sheet with two overlapping offset-parallel cracks under tensile loading using the optical method of caustics in combination with a Cranz-Schardin high-speed camera; and the fracture characterization of a V-notch tip in PMMA material by means of an optical caustics method, respectively. Sahraoui and El Mahi (2009) measured the dynamic fracture toughness of notched PMMA at high impact velocities, where the classical method was limited by the inertial effects. The direct measurements of the specimen deflection were successfully used for the toughness evaluation.
Sauer and Hsiao have started to investigate the craze phenomenon of polymer early in 1949. Simultaneously, Kies and his co-workers got some inspiration for the top of PMMA hatch have the better craze resistance, and researched biaxial and multiaxial tension directional PMMA. Directional PMMA is manufactured in the following way: PMMA plate is pulled under directional stresses according to a pre-selected temperature curve including the heating, keeping and cooling. Compared with normal PMMA, directional PMMA has more excellent mechanical properties such as higher pull strength and elasticity module. Some important elements of airplanes are made of directional PMMA plates such as hatches.
The previous studies have made a tremendous contribution to the failure research of PMMA. However, most of the previous researches are based on the isotropic mechanical model. On account of the special processing of directional PMMA, it is difficult to reflect the mechanical properties of directional PMMA with the isotropic mechanical model. The purpose of this paper is to establish an anisotropic mechanical model by isodyne method and measure all the mechanical parameters by the digital image correlation method for the aeronautical directional PMMA. Furthermore, we also utilized the FEM numerical simulation and experimental methods to study the fracture mechanics properties of directional PMMA in two different directions: One is along the direction of directional tension and the other is along the vertical direction of directional tension.
2 ANISOTROPIC MECHANICAL MODEL
Latin American Journal of Solids and Structures 11 (2014) 1777-1790
incident laser beam radiates along x direction, the laser beam is 45° polarized light with the z axis. The scattered light reflected by the mirror is collected by the lens and camera. The laser beam can scan along y direction by a mechanical system to obtain a full image. In this way, the optical slices with 3D stress information can be also recorded.
Figure 1: Optical system and experimental arrangement.
In order to investigate the mechanical properties of different directions for the directional PMMA plate, two specimens are cut from a directional PMMA plate along different directions, which is shown in Fig. 2. Pulling loads in manufacture are in the x-y plane.
Figure 2: Specimens for stress analysis: (a) biaxial tension PMMA plate; (b) two specimens along different directions.
Latin American Journal of Solids and Structures 11 (2014) 1777-1790
vertical plane to the directional PMMA plate can be obtained. The equipment of isodyne experiment is shown in Fig. 3.
Figure 3: Equipment of isodyne experiment..
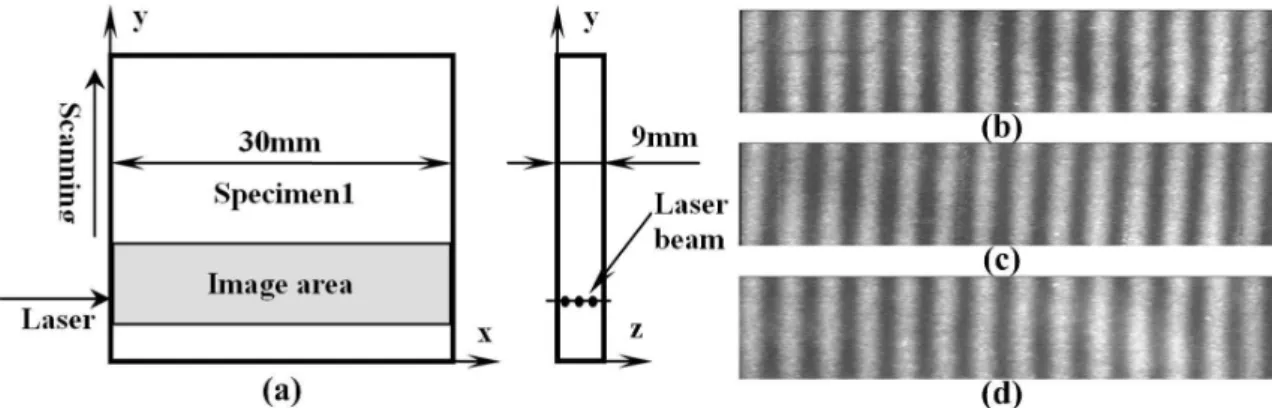
Three images are obtained as the incident laser beam scans along y direction in x-y plane with different thickness of the directional PMMA plate, which is shown in Fig. 4. The experimental results present that there is the same stress state along the thickness of the PMMA plate.
Latin American Journal of Solids and Structures 11 (2014) 1777-1790
Fig. 5 shows three images obtained as the incident laser beam radiates along x direction, y direction and an angle with x direction in x-y plane. The experimental results present that in x-y plate there is same stress state in different directions.
Figure 5: Stress analysis in x-y plane: (a) specimen size and scanning mode; (b) isodyne image as incident laser beam along x direction; (c) isodyne image as incident laser beam along y direction; (d) isodyne image as incident
laser beam along an angle with x direction.
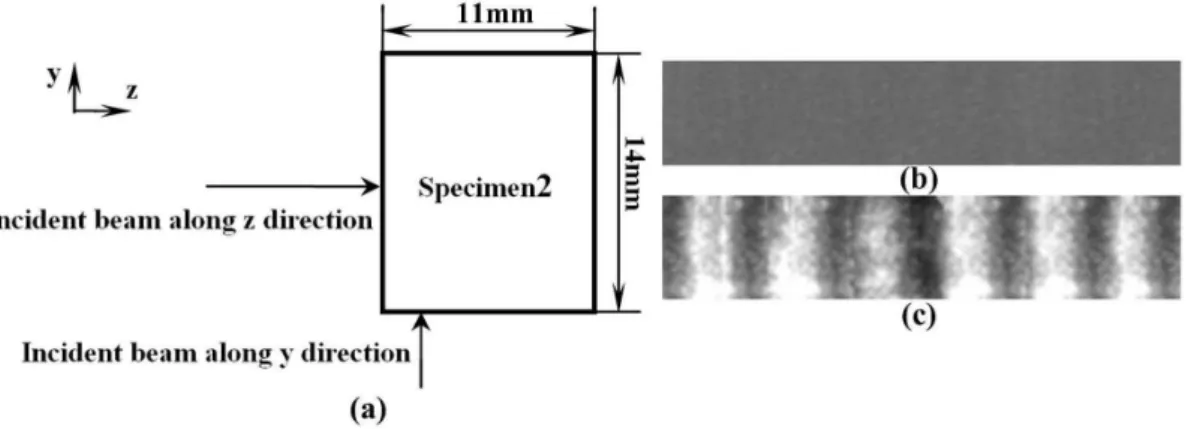
The images shown in Fig. 6 are obtained as the incident laser beam is along z and y direction in y-z plane. There are no fringes in Fig. 6 (b). So the remained stresses are in the isotropy state in the x-y plane. This phenomenon can be explained according to the principle of isodx-yne method. In other direction the isodyne image shows parallel fringes in Fig. 6 (c). So no remained stresses in z direction are detected according to Fig. 5 and Fig. 6.
Figure 6: Stress analysis in y-z plane: (a) specimen size and scanning mode; (b) isodyne image as incident laser beam along z direction; (c) isodyne image as incident laser beam along y direction.
According to the fringe patterns and fringe spacing shown in Fig. 4, Fig. 5 and Fig. 6 by isodyne method, following assumptions are educed.
(1) There are the same stress states with different thickness in the x-y plane from the images in Fig. 4;
Latin American Journal of Solids and Structures 11 (2014) 1777-1790
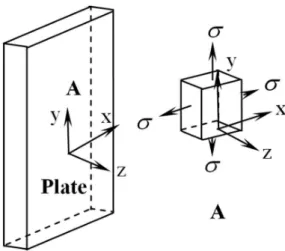
Figure 7: Stress state of directional PMMA plate.
The previous experiments revealed that the stresses are in the isotropy state in the x-y plane. There are residual stresses in the x-y plane due to the uniform pulling bi-axially and no residual stresses in the z direction shown in Fig. 6. So directional PMMA is not the uniform material.
An anisotropic mechanical model (Lekhniskii, 1981) can be applied to describe the mechanical properties of directional PMMA. Five independent mechanical parameters will be introduced to describe mechanical properties of the material. The flexibility matrix is:
11 12 13
12 11 13
13 13 33
44
44
11 12
0
0
0
0
0
0
0
0
0
0
0
0
0
0
0
0
0
0
0
0
0
0
0
0 2(
)
s
s
s
s
s
s
s
s
s
s
s
s
s
−
(1) Elastic modulus:1 2
1/
11,
31/
33E
=
E
=
s
E
=
s
(2)Poisson ratios:
21 12
s
12/
s
11,
13 23s
13/
s
33,
31 32s
13/
s
11ν
=
ν
=
−
ν
=
ν
=
−
ν
=
ν
=
−
(3)Shear modulus:
23 31 1/ 44, 12 1/ (211 2 12)
G =G = s G = s − s (4)
Elastic modulus E1, E2 and E3 correspond to the load along the x, y and z directions,
Latin American Journal of Solids and Structures 11 (2014) 1777-1790
corresponding along the y direction, ν31 and ν32 corresponding along the z direction; Shear modulus
G12, G23 and G31 correspond to the shear force in the x-y, y-z and z-x planes respectively.
3 MECHANICAL PARAMETERS TESTING
In order to measure the mechanical parameters of directional PMMA, digital image correlation method (Chu et al., 1985) is adopted to do the experiment. The information carrier of the displacement is the gray distribution of the object surface. Gray images before and after deformation are recorded by the CCD camera and analyzed to obtain the displacement information. The size of the specimen is limited shown in Fig. 6, so the compression test substitutes the tensile test to measure the mechanical parameters. Because the initial stage of the compression curve is nonlinear, load begins from P0 (P0≠0) for reducing error. Elastic modulus is tested by the
Eq. 5.
0 0
/
(
n) /[ (
n)]
E
=
Δ
σ
Δ
ε
=
P
−
P
A
ε
−
ε
(5)where E is elastic modulus, Pn is the end load, P0 is the initial load, εn is the end strain, ε0 is the
initial strain and A is the cross section area.
The Poisson ratio (Zhao et al., 1996) is worked out according to the Eq. 6.
(6)
where ∆ε’ and ∆ε are the transverse strain increment and axial strain increment respectively.
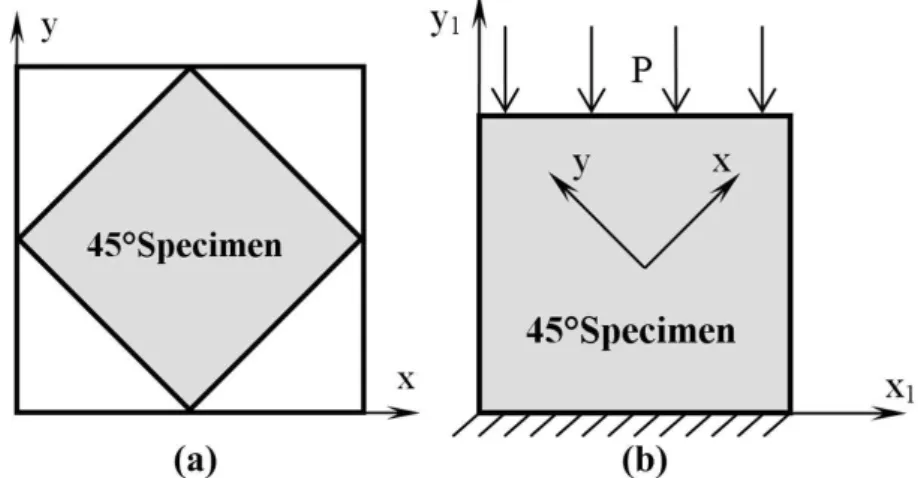
The 45° specimen shown in Fig. 8 is used to measure the shear modulus (Xu et al., 2003; Divos et al., 1998) according to the Eq. 7.
Figure 8: Shear modulus measurement: (a) 45° specimen; (b) loading mode.
(7) '
/
ν
=
−Δ
ε
Δ
ε
45
/[2 (
1 2)]
Latin American Journal of Solids and Structures 11 (2014) 1777-1790
where G is the shear modulus, ∆P45 is the load increment, ε1 is the strain increment along x1
direction, ε2 is the strain increment along y1 direction, and A is the cross section area.
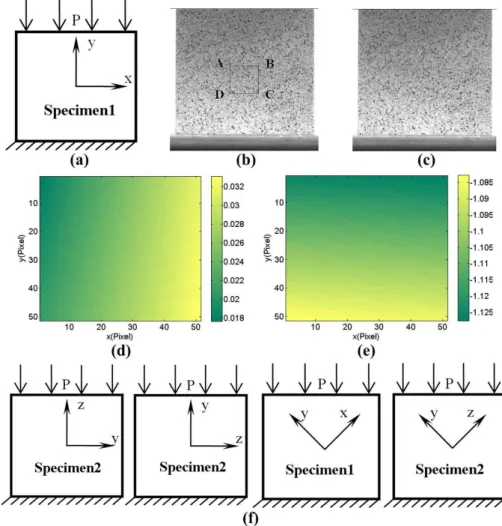
The specimen1 is loaded along the y direction shown in Fig. 9 (a). According to the gray images of the tested object before and after loading shown in Fig. 9 (b) and (c), the displacement values of the area ABCD along the x and y directions are worked out by digital image correlation method, which is shown in Fig. 9 (d) and (e). According to the Eq. 5 and Eq. 6 the elastic modulus and Poisson ratios are both obtained by the stress and strain which are calculated by the load and displacement values. By the same way through loading different specimens along different directions shown in Fig. 9 (f), all mechanical parameters are measured by the digital image correlation method. The measured values of all mechanical parameters are shown in Table 1, which can reflect the anisotropic mechanical behaviors in directional PMMA.
Figure 9: Mechanical parameters measurement: (a) specimen1 loaded along y; (b) image before loading; (c) image after loading; (d) displacement field along x direction; (e) displacement field along y direction; (f) different specimens
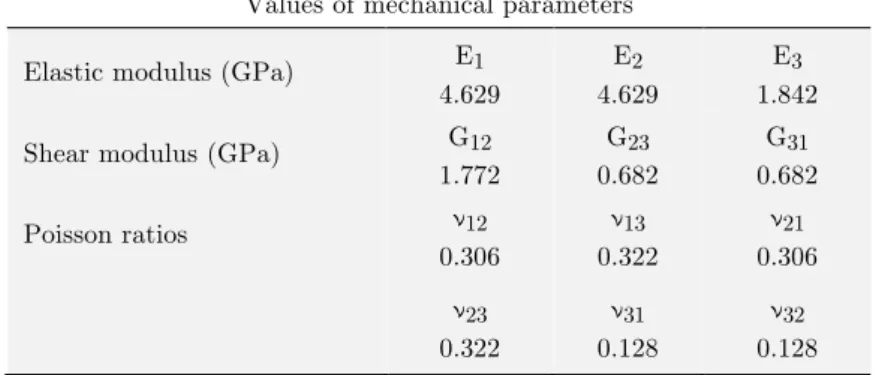
Latin American Journal of Solids and Structures 11 (2014) 1777-1790 Values of mechanical parameters
Elastic modulus (GPa) E1
4.629
E2
4.629
E3
1.842
Shear modulus (GPa) G12
1.772
G23
0.682
G31
0.682
Poisson ratios ν12
0.306
ν13
0.322
ν21
0.306
ν23
0.322
ν31
0.128
ν32
0.128
Table 1: Values of mechanical parameters of directional PMMA.
4 FRACTURE MECHANICAL PROPERTIES BY FEM
Because of the anisotropic mechanical behaviors in directional PMMA, the fracture mechanical properties of crack propagation along different directions are different. According to the anisotropic mechanical model and mechanical parameters, finite element method (Chan et al., 1970) is used to calculate stress field and strain field around the tip of crack along different directions. One is along the direction of directional tension; the other is along the vertical direction of directional tension. Three point bending specimen is modeled and the size and load of specimen1 and specimen2 are the same shown in Fig. 10 (a). The length of the model is 40cm, the width is 10cm, and the length of crack is 5 cm. The area of the crack tip is singularity, so around this area singularity element which is a kind of triangular element of six nodes is used shown in Fig. 10 (b).
Latin American Journal of Solids and Structures 11 (2014) 1777-1790
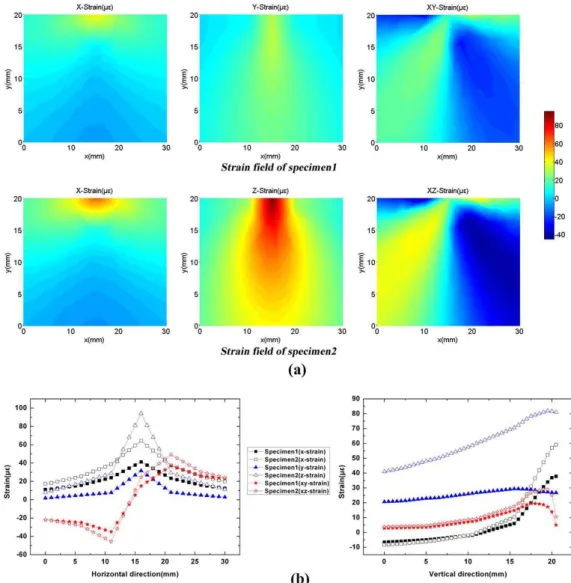
Directional PMMA is a kind of polymer material. It is composed of molecular chains and brittle material, so the damage of directional PMMA is relative with the deformation. As shown in Fig. 11 (a) and (b), the analysis to the strain around the tip of crack shows that the values of shear stress are small compared with normal stress, but the values of shear strain and normal strain are in the same level, so shear stress could not be neglected. In the same stress state, the strain values around the tip of the specimen2 are larger than that of the specimen1, so the crack along the vertical direction of directional tension extends more easily.
Figure 11: Results of numerical simulation: (a) strain fields of different specimens; (b) strain values along horizontal and vertical directions around the crack tip.
5 FRACTURE MECHANICAL PROPERTIES BY EXPERIMENT
Latin American Journal of Solids and Structures 11 (2014) 1777-1790
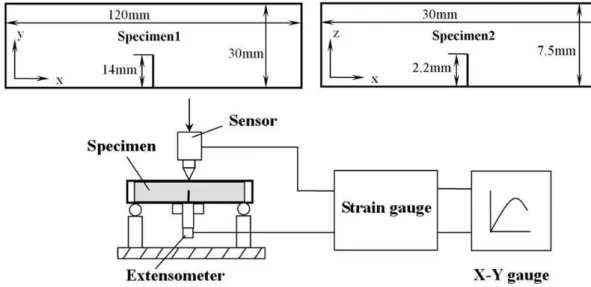
tension; the other is along the vertical direction of directional tension. Because the two directions are both the principal directions of directional PMMA (Walsh et al., 1972), traditional method (Feddersen et al., 1996) can be used to test the fracture toughness. Fracture toughness value is only related to the properties of the materials, so fracture toughness values of directional PMMA are tested with the simple three point bending beams. The sizes of specimens and testing process of fracture toughness are shown in Fig. 12.
Figure 12: Traditional schematic diagram of fracture toughness testing.
Eq. 8 is the expressions of stress intensity factor.
3/ 2
(
)
I
PS
a
K
f
BW
W
=
2 ,
4
W
=
B S
=
W
2 1/ 2
2
3/ 2
3( ) [1.99 ( )(1 )(2.15 3.93 2.7 )]
( )
2
2(1 )(1 )
a a a a a
a W W W W W
f
a a
W
W W
− − − −
=
+ −
(8)
Latin American Journal of Solids and Structures 11 (2014) 1777-1790
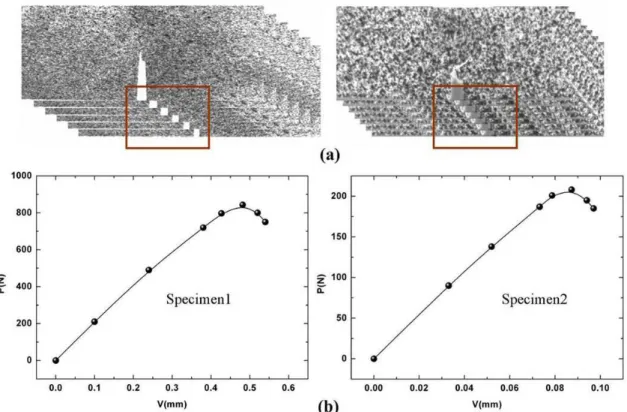
Figure 13: Fracture toughness testing: (a) speckle patterns of different loads of specimen1 and specimen2; (b) P-V curves of specimen1 and specimen2.
According to P-V curve of the specimen1 shown in Fig. 13 (b), critical load is maximum load 817 N. The fracture toughness value 194.87 N/mm3/2 of the specimen1 is obtained using the critical load and specimen size by the Eq. 8. According to P-V curve of the specimen2 shown in Fig. 13 (b), critical load is maximum load 208 N. By the same way the fracture toughness value 91.32 N/mm3/2 of the specimen2 is obtained. The experiment results show that fracture toughness value along the direction of tension direction is larger than that of along the vertical direction of tension direction shown in Table 2. So the crack along the vertical direction of directional tension extends more easily.
Values of fracture toughness
Fracture toughness(N/mm3/2) Specimen1 Specimen2
194.87 91.32
Table 2: Values of fracture toughness along different directions.
6 DISCUSSIONS AND CONCLUSIONS
Latin American Journal of Solids and Structures 11 (2014) 1777-1790
of directional tension, the mechanical properties are enhanced, while along the vertical direction of directional tension, the mechanical properties are relatively weak.
As the anisotropic mechanical properties in the directional PMMA, the fracture mechanical properties of crack propagation along different directions are different which are analyzed by the FEM numerical simulation and experimental methods. The stain values of the crack tip along the different directions of crack propagation are calculated by the FEM numerical simulation method, which indicates that the crack along the vertical direction of directional tension extends more easily than that along the direction of directional tension. Fracture toughness value measured by experiment along the direction of directional tension is larger than that along the vertical direction of directional tension. So the crack along the vertical direction of directional tension extends more easily. The conclusions of experimental and FEM numerical simulation methods are consistent.
Acknowledgements
This work is supported by National Natural Science Foundation of China (No. 11072176, No. 51301057), National Natural Science Foundation of Hebei (No. B2013202211) and Open Project of Key Lab Adv Energy Mat Chem (Nankai Univ) (KLAEMCOP201101).
References
Berry, J.P. (1961). Fracture processes in polymeric materials. I. The surface energy of poly (methyl methacrylate). Journal of Polymer Science 50: 107-115.
Mukherjee, B., Burns, D.J. (1971). Fatigue-crack growth in polymathlmethacrylate. Experimental Mechanics 11: 433-439.
Woo, C.W., Chow, C.L. (1984). Fatigue crack propagation in aluminum and PMMA. International Journal of Fracture 26: 37-34.
Cheng, W.M., Miller, G.A. (1990a). Mechanical behavior poly (methlmethacrylate). Part 1 Tensile strength and fracture toughness. Journal of Materials Science 25: 1917-1923.
Cheng, W.M., Miller, G.A. (1990b). Mechanical behavior poly (methlmethacrylate). Part 2 Temperature and frequency effects on fatigue crack propagation behavior. Journal of Materials Science 25: 1924-1930.
Kim, H.S., Mai. Y.M. (1993). Effect of temperature on fatigue crack growth in unplasticized polyvinyl chloride. Journal of Materials Science 28: 5479-5485.
Kim, H.S., Wang, X.M. (1994). Temperature and frequency effects on fatigue crack growth of UPVC. Journal of Materials Science 29: 3209-3214.
Ramsteiner, F., Armbrust, T. (2001). Fatigue crack growth in polymers. Polymer Testing 20: 321-327.
Yao, X.F., Jin, G.C., et al. (2002). Experimental studies on dynamic fracture behavior of thin plates with parallel
single edge cracks. Polymer Testing 21: 933-940.
Yao, X.F., Xu, W., et al. (2003). Experimental study of dynamic fracture behavior of PMMA with overlapping
offset-parallel cracks. Polymer Testing 22: 663-670.
Xu, W., Yao, X.F., et al. (2004). Fracture characterizations of V-notch tip in PMMA polymer material. Polymer
Testing 23: 509-515.
Sahraoui, S., El Mahi, A., et al. (2009). Measurement of the dynamic fracture toughness with notched PMMA
Latin American Journal of Solids and Structures 11 (2014) 1777-1790
Pindera, J.T., Krasnowski, B.R., Pindera, M.J. (1985). Theory of elastic and photoelastical isodynes. samples of application in composite structures. Experimental Mechanics 25: 272-281.
Pindera, M.J., Pindera, J.T., Ji, Xi. (1989a). Three-dimensional effects in beams: Isodyne assessment of a plane solution. Experimental Mechanics 29: 23-31.
Pinder, J.T., Pindera, M.J. (1989b). Isodyne Stress Analysis. Kluwer Academic Publishers, Dordrecht, the Netherlands.
Lekhniskii, S.G. (1981). Theory of elasticity of an anisotropic body. Mir Publisher.
Chu, T.C., Ranson, W.F., et al. (1985). Application of Digital Image Correlation Technique to Experimental
Mechanics. Experimental Mechanics 25: 232-244.
Zhao, W., Jin, G. (1996). An Experimental Study on Measurement of Poisson's Ratio with Digital Correlation Method. Journal of Applied Polymer Science 60: 1083-1088.
Xu, M.Q., Lu, Z.Y. (2003). Determination of Loblolly’s Shear Modulus. Mechanics in Engineering 25: 57-60. Divos, F., Tanaka, T., et al. (1998). Determination of shear modulus on construction size timber. Wood Science &
Technology 31: 394-402.
Chan, S.K., Tuba I.S., Wilson, W.K. (1970). On the finite element method in linear fracture mechanics. Engineering Fracture Mechanics 2: 1-17.
Walsh, P.F. (1972). Linear fracture mechanics in orthotropic materials. Engineering Fracture Mechanics 4: 533-541.
Feddersen, C.E. (1996). Plane Strain Crack Toughness Testing. USA: ASTM.