Abstract
Concrete barriers prevent vehicles from entering the opposite lane and going off the road. An important factor in the design of concrete barriers is impact load, which a vehicle exerts upon collision with a concrete barrier. This study suggests that a height of 813 mm, a base width of 600 mm, and a top width of 240 mm are optimum dimen-sions for a concrete barrier. These dimendimen-sions ensure the stability of concrete barriers during vehicle collisions. An analytical and experi-mental model is used to analyze the concrete barrier design. The LS-DYNA software is utilized to create the analytical models because it can effectively simulate vehicle impact on concrete barriers. Field tests are conducted with a vehicle, whereas laboratory tests are con-ducted with machines that simulate collisions. Full-scale tests allow the actual simulation of vehicle collisions with concrete barriers. In the vehicle tests, a collision angle of 25°, collision speeds of 100 km per hour, and a vehicle weighing more than 2 t are considered in the reviewed studies. Laboratory tests are performed to test bridge con-crete barriers in static condition.
Keywords
Concrete barriers; LS-DYNA software; simulation; collision angle; collision speed.
Concrete road barriers subjected to impact loads: An overview
1 INTRODUCTION
In highway roads, opposite lanes must be separated by concrete road divider barriers. Concrete bar-riers are necessary for preventing vehicles from entering the opposite lane, Ren and Vesenjak (2005). Vehicles that cross into the opposite lane may cause serious traffic accidents; therefore, concrete barriers must be able to prevent such vehicles from entering the opposite lane to prevent occupant injury and vehicle destruction, Se-Jin et al. (2008). Experimental impact tests have been established in several studies that have used full-scale vehicle tests to test the ability of concrete barriers to withstand impact loads exerted on them by collisions with vehicle, Consolazio et al. (2003) and Bam-bach et al. (2010). Laboratory models have been used in other studies to test impact loads, Gabauer et al. (2010).
Muhammad Fauzi Bin Mohd. Zaina Hasan Jasim Mohammedb
aFaculty of Engineering and Built
Envi-ronment, Universiti Kebangsaan Malay-sia.
bDepartment of Civil and Structural
En-gineering, Faculty of Engineering and Built Environment, Universiti Kebang-saan Malaysia.
Corresponding author:
http://dx.doi.org/10.1590/1679-78251783
Theoretical finite element method (FEM) is used by several software, in particular LS-DYNA and ANSYS programs, to simulate concrete barriers and vehicles, Itoh et al. (2007a); Se-Jin et al. (2008); Consolazio et al. (2003); Borovinšek et al. (2007); Zhong et al. (2009); Wang et al. (2013). One of the most critical road transportation problems is the protection of road users. Concrete barriers currently in use are insufficient because they cause death in road accidents. Safety can be increased by reducing the impact of vehicle collisions with the use of concrete road divider barriers. Newly designed concrete barriers can absorb a large amount of the energy released during collisions without being destroyed. We need to reduce the crash continuity of the vehicle during its collision with the concrete barrier. Current concrete barriers are solid. By contrast, barriers that can absorb vehicle impact well use concrete composite materials that are more flexible and elastic than normal reinforced concrete. This study reviews the literature on road concrete barriers under applied impact loads. This review includes studies conducted in the last 15 years, as well as tests and simulations conducted on concrete barriers. Experimental and theoretical tests would elucidate the process of vehicle collision with con-crete barriers and would determine the effects of the impact load. The results would help us modify the design, and shape. The survey is divided into concrete barrier dimensions, analytical and numer-ical models, experimental tests, effects of parameters in tests, bridge crash barriers, anchoring methods of barriers, and patents of barriers. In addition, the experimental tests are divided into field tests (full-scale tests) and laboratory tests (which use small-scale machines). The test parameters involve three main effective factors: the collision angle of the vehicle to the concrete barrier, the speed of the vehicle when it hits the barrier, and vehicle weight.
2 CONCRETE BARRIER SHAPE AND DIMENSIONS
The concrete barrier dimensions depend of the type of test. Full-scale tests use barriers with the same or approximately the same dimensions as those used during installation. Ronald et al. (1996) devel-oped and assessed a temporary concrete barrier with an F-shape barrier piece, a width of 570 mm at the base and 200 mm width at the top, a height of 810 mm, and a length of 3800 mm.
McDevitt (2000) designed the safety shapes of F-shape concrete barriers. The formation of these concrete barriers reduced the damage to vehicles during impact. The shape was achieved by deter-mining the optimum slope angle which minimized the chance of the vehicle tires riding up the concrete barrier upon impact. MacDonald and Kirk (2001) designed the Oregon Standard 813 mm F-shape precast concrete barrier and Oregon Tall 1067 mm precast concrete barrier. A 2041 kg vehicle was used to test the standard concrete barrier. The tall concrete barrier was also tested by crashing a single-unit truck against it. Richard et al. (2002) used a concrete barrier with a New Jersey shape. The barrier was 610 mm wide at the base, 150 mm wide at the crown, and 810 mm high. Two sets of two loops were connected between the adjacent barriers.
Consolazio et al. (2003) modified concrete barriers that were 508 mm in height, 6.1 m in length, and 49 kN in weight. Zhao et al. (2004) tested a concrete barrier 810 mm high above the surface of the road. This barrier was connected with a bridge deck to concrete barrier rails. The experimental results showed that this setup exceeded in strength the American Association of State Highway and Transportation Officials (AASHTO) specifications for bridge design where a horizontal was load ap-plied to the top of the concrete barrier. Dean et al. (2004b) examined Jersey safety concrete barriers. The barrier dimensions were 813 mm in height, 382 mm in width at the base, and 152 mm in width
at the top. The concrete barrier was cast with a reinforced concrete bridge deck with a thickness of 178 mm. This configuration was used in crash and static load tests.
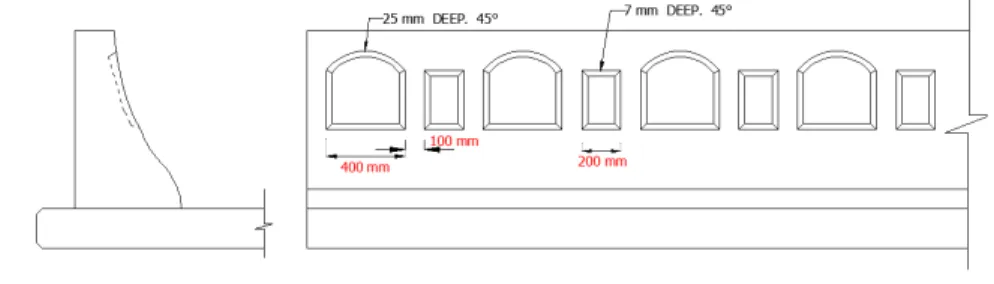
Dean et al. (2004a) used a bridge rail as a concrete barrier to protect vehicles crossing the bridge from a lower area. The dimensions of the barrier used in the test were 254 mm wide by 1100 mm high, with the concrete rail being 152 mm in width. A cross-bolt was used by by Roger et al. (2005a) to connect 3 m long concrete barriers 813 mm in height and 600 mm wide. An experimental model was tested to check the ability of bolts to resist impact loads from vehicles. The test conducted by MRSF (2006) used temporary concrete barriers 813 mm high and 570 mm wide at base. Bullard et al. (2006) established new concrete barrier models with aesthetic shapes. They started with barriers 300 mm wide with a 100 mm gap between adjacent roughs. The model was then modified to obtain the one uses in the tests shown in Figure 1.
(a) Section of concrete barrier (b) Front view of concrete barrier
Figure 1:Suggested modifications following the aesthetic design guidelines, Bullard et al. (2006).
Polivka et al. (2006) investigated concrete barriers with the New Jersey shape. The barrier was 813 mm high, 381 mm wide at the base, and 152 mm wide at the top. The shape of the barrier was found unsafe during vehicle collision. Itoh et al. (2007a) focused on F-shape concrete barriers that were 680 mm wide at the bottom, 250 mm wide at the top, and 1100 mm high. The barrier was 50 m long, and the crash point was located 20 m from the approaching point of the truck. Menges et al. (2007) proposed a modified design for concrete barriers that would affect vehicle collision. This proposal was implemented with the dimensions shown in Figure 2.
(a) F-shape concrete safety barrier (b) Single-slope concrete barrier
Figure 2: Typical cross-section of an F-shape concrete safety barrier and a single-slope concrete barrier,Menges et al. (2007).
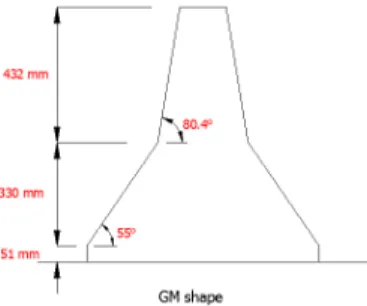
Rosenbaugh et al. (2007) modified the General Motors (GM) shape for concrete barriers. Vehicle tires were found to raise the bottom of concrete barriers, thus prompting the researchers to develop a new barrier shape by increasing the upper slope to 84°. They also reduced the barrier height by 76 mm. However, the total barrier height remained at 813 mm. These changes are shown in Figure 3.
Figure 3:Geometry of the GM Shape barrier, Rosenbaugh et al. (2007).
Dhafer et al. (2007) introduced and developed a portable concrete barrier by combining five different safety shapes: F-Shape, New Jersey shape, single slope, vertical shape, and inverted shape. They presented an arbitrary discrete design combination, as shown in Figure 4. This model led to modifi-cations in the portable concrete barrier design; however, further tests are needed to assess the design at all levels of safety. Typical shapes of concrete barriers, as shown in Figure 5.
Figure 4:Overall discrete design matrix, Dhafer et al. (2007).
Note: - all units in (mm)
Figure 5:Typical shapes of concrete barriers, Dhafer et al. (2007).
Se-Jin et al. (2008) used a concrete barrier with the following dimensions: 6 m long, 1320 mm high, 420 mm wide at the bottom, and 230 mm wide at the top. They used two equivalent crash lengths. The longitudinal length of the impact force distribution, as presented in the AASHTO LRFD bridge design specification, was 1070 mm and 2440 mm according to test level. The two values exhibited a failure pattern during the static test to simulate a vehicle colliding with the concrete barrier. Atahan and Sevim (2008) conducted an experimental test for a New Jersey concrete barrier, which was1000 mm high, 450 mm wide at the base, 250 mm wide at the top, and 1 m long. The barrier was tested through a collision with a bogie vehicle
.
Kuebler (2008) tested many types of barriers, six of whichwere concrete and five were steel. The concrete barriers were 580 mm wide, 1.07 m high over the road surface, and weighed 783 kg/m. They were secured onto a concrete floor using M 16 shear connectors with a spacing of 6 m between them. Esfahani et al. (2008) used different New Jersey and F-shape concrete barriers 813 mm, 940 mm, and 1067 mm in height. The concrete barriers were simulated through FEM. The results showed that decreasing the height of the concrete barriers increased the roll angle. Zhong et al. (2009) used concrete blocks that were 810 mm high, 566 mm wide at the bottom, and 1.5 m long. The concrete blocks were connected with steel reinforcement ends and steel plate hooks. They were then welded together to form a concrete barrier.
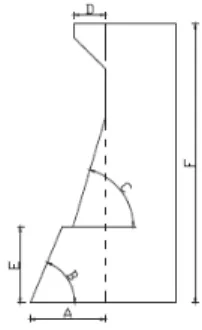
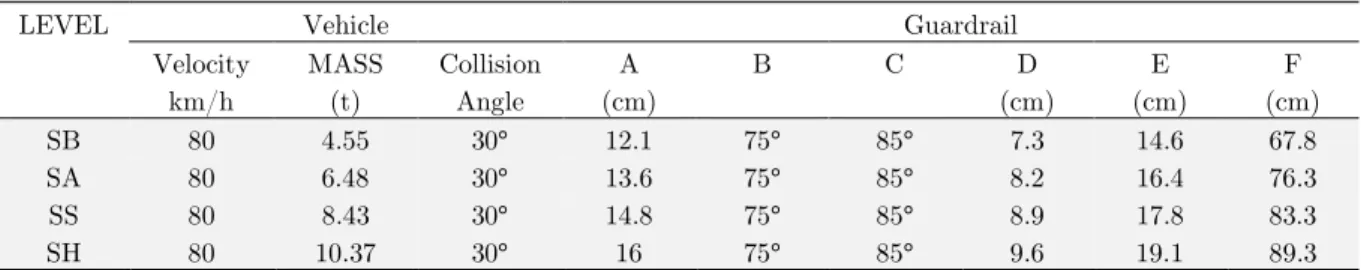
Nauman et al. (2009) conducted tests on a single-slope concrete barrier 1067 mm high, 610 mm wide at base, and 203 mm wide at the top. The concrete barrier was placed in the front of a slope or on a mechanically stabilized earth (MSE) wall. This model was tested using a pick up and a bogie car, and then simulated through FEM. The deflection of the barrier is the main subject of this re-search. The effects of concrete barrier height was presented by Atahan (2009). Analytical models of New Jersey type barriers 810, 950, 1000, and 1050 mm tall were tested using a 30-ton vehicle. In another model, the concrete barrier was 810 mm high and the vehicle weighed 10 tons. The 1050 mm high concrete barrier was the most stable against the impact of a 30-ton vehicle. The 810 mm high concrete barrier was the most stable against the impact of a 10-ton vehicle. Coughlin et al. (2010) created a simple rectangular model with dimensions of 3050 mm x 1070 mm x 610 mm and then tested this model using C4 explosive. Uttipec (2010) created a precast concrete divider barrier 610 mm wide, 810 mm high, and 3.6 m long. Bin-Shafique et al. (2011) used two types of concrete barrier to show the effects of flood water. Both types of barriers were 1060 mm high and 600 mm wide at the base. The base width of a third barrier was 600 mm, but its height was 840 mm. Sujuan et al. (2011) introduced a concrete barrier with different dimensions and a new shape. These models were analyzed using the FEM with an impact test involving heavy vehicles. Figure 6 and Table 1 show the details of these models.
Figure 6:Super elevation concrete barrier section, Sujuan et al. (2011)
LEVEL Vehicle Guardrail Velocity
km/h
MASS (t)
Collision Angle
A (cm)
B
C D
(cm)
E (cm)
F (cm)
SB 80 4.55 30° 12.1 75° 85° 7.3 14.6 67.8
SA 80 6.48 30° 13.6 75° 85° 8.2 16.4 76.3
SS 80 8.43 30° 14.8 75° 85° 8.9 17.8 83.3
SH 80 10.37 30° 16 75° 85° 9.6 19.1 89.3
SB, SA, SS, SH: - Degrees (levels) of crashworthy capacity.
Table 1: Results of the similarity design for different degree barrier, Sujuan et al. (2011).
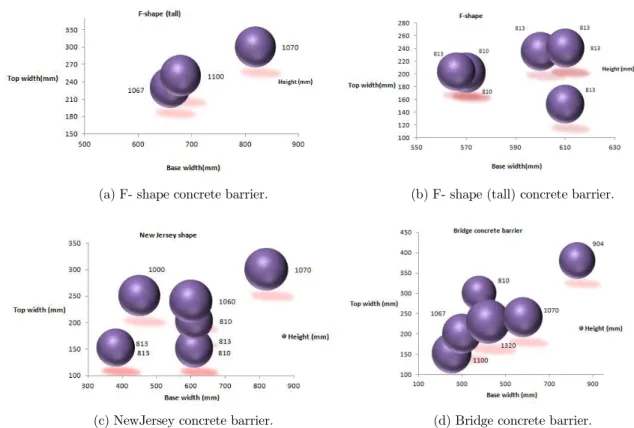
Jian et al. (2011) computed and then optimized overpass concrete barrier with different dimensions. Crashing heavy vehicles onto the concrete barriers yielded satisfactory results. Claude et al. (2011) used a median barrier to determine short- and long-term cracking. The concrete barrier used in this research was 904 mm high, 830 mm wide at the base, and 380 mm wide at the top. The researchers found that the initial crack was approximately 0.15 mm to 0.18 mm wide, and it grew after it was taken away from the formwork for 4 weeks. Amato et al. (2011) proposed a new prototype concrete barrier using low-cost normal materials. The model was 750 mm high, 750 mm wide and 2.0 m long. Many factors are considered when choosing the height of concrete barriers. . The first is the place where the concrete barrier will be used. A concrete barrier is used in work zones and intersections, wherein driver sight distance is clear. Low concrete barriers (510 mm high) can be successfully used in urban streets or in residential and commercial areas where the speed of vehicles is limited. By contrast, high concrete barriers (813 mm high) are commonly used in main roads and highway roads. Along expressways, freeways, bridges, bridges across rivers, curved highway roads (particularly on bridges), and areas with limited sight distance, concrete barriers should be over 1067 mm high. The second factor is vehicle weight more affected in the used the height of concrete barriers. Passenger cars are allowed to pass on city centers, and thus, low concrete barriers should be used. On highways where both smaller vehicles and 2000 kg pickup trucks pass, concrete barriers with medium height (813 mm) should be used. To contain and redirect the crash of an 8000 kg truck or a 36000 kg tractor trailer, a concrete barrier must have a minimum height of 1067 mm. Tall concrete barriers are commonly effective for all types of vehicles and speed. Lastly, containment levels also help determine the height of concrete barriers. Low and medium concrete barriers are used in levels 1 and 2, whereas medium concrete barriers are commonly utilized in level 3. Meanwhile, levels 4, 5, and 6 require concrete barriers that are over 1067 mm high. Table 2 summarizes concrete barrier dimensions and types. Figure 7, the bubble charts, base width and top width were taken on X- and Y-axes respectively, whereas the bubble size was represented barrier height. Figure 7-a, shows that the base width (ap-proximately 600 mm) of F-shaped concrete barriers is frequently used with a top width of 220 mm and a height of 813 mm because such values are suitable for this type of concrete barrier. By contrast, a 700 mm base width and a 240 mm top width are best used with a 1067 mm-high F-shaped concrete barrier, as shown in Figure 7-b. The New Jersey type has a base width of 600 mm and a top width of 200 mm; these values are appropriate for standard and tall New Jersey barriers, as shown in Figure 7-c. The dimensions are unaffected in the stability of bridge concrete barriers because of the anchor between the concrete barrier and the bridge deck, and thus, the dimensions are not concentrated near one another. The base width is approximately 400 mm, and the top width is approximately 200 mm are more used, as shown in Figure 7-d.
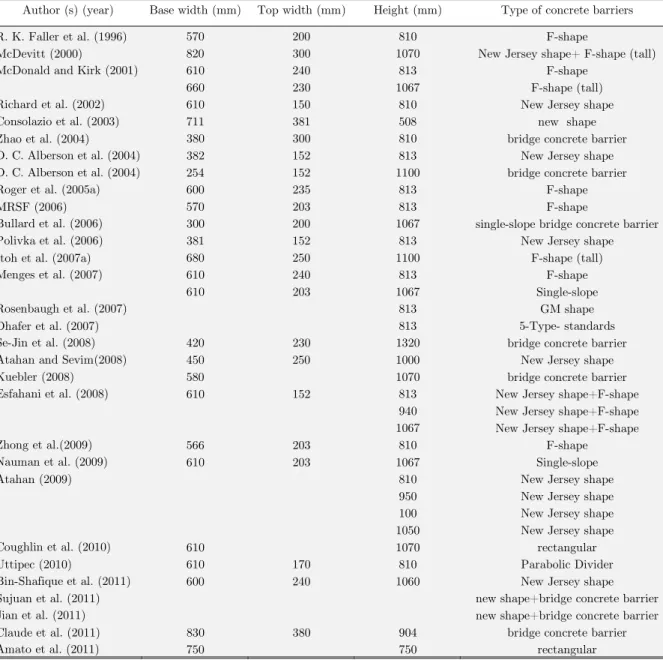
Author (s) (year) Base width (mm) Top width (mm) Height (mm) Type of concrete barriers
R. K. Faller et al. (1996) 570 200 810 F-shape
McDevitt (2000) 820 300 1070 New Jersey shape+ F-shape (tall)
McDonald and Kirk (2001) 610 240 813 F-shape
660 230 1067 F-shape (tall)
Richard et al. (2002) 610 150 810 New Jersey shape
Consolazio et al. (2003) 711 381 508 new shape
Zhao et al. (2004) 380 300 810 bridge concrete barrier
D. C. Alberson et al. (2004) 382 152 813 New Jersey shape
D. C. Alberson et al. (2004) 254 152 1100 bridge concrete barrier
Roger et al. (2005a) 600 235 813 F-shape
MRSF (2006) 570 203 813 F-shape
Bullard et al. (2006) 300 200 1067 single-slope bridge concrete barrier
Polivka et al. (2006) 381 152 813 New Jersey shape
Itoh et al. (2007a) 680 250 1100 F-shape (tall)
Menges et al. (2007) 610 240 813 F-shape
610 203 1067 Single-slope
Rosenbaugh et al. (2007) 813 GM shape
Dhafer et al. (2007) 813 5-Type- standards
Se-Jin et al. (2008) 420 230 1320 bridge concrete barrier
Atahan and Sevim(2008) 450 250 1000 New Jersey shape
Kuebler (2008) 580 1070 bridge concrete barrier
Esfahani et al. (2008) 610 152 813 New Jersey shape+F-shape
940 New Jersey shape+F-shape
1067 New Jersey shape+F-shape
Zhong et al.(2009) 566 203 810 F-shape
Nauman et al. (2009) 610 203 1067 Single-slope
Atahan (2009) 810 New Jersey shape
950 New Jersey shape
100 New Jersey shape
1050 New Jersey shape
Coughlin et al. (2010) 610 1070 rectangular
Uttipec (2010) 610 170 810 Parabolic Divider
Bin-Shafique et al. (2011) 600 240 1060 New Jersey shape
Sujuan et al. (2011) new shape+bridge concrete barrier
Jian et al. (2011) new shape+bridge concrete barrier
Claude et al. (2011) 830 380 904 bridge concrete barrier
Amato et al. (2011) 750 750 rectangular
Table 2: Concrete barrier dimensions summarize.
3 ANALYTICAL AND NUMERICAL MODELS
Typical analysis was conducted by Ivey et al. (1980) to find better bonding between the concrete median barriers using 12 end connections. They performed nine crash tests for barrier lengths ranging from 3.81 m to 9.14 m. The results demonstrate the advantages of using portable concrete median barriers. Differential equations were used by Guo et al. (1997). Their study aimed to demonstrate the movement of a vehicle and its collision with concrete barriers by using Euler–Lagrange equation. The results illustrated the maximum accelerations, as well as the tire camber, throw, and rotate angles. Numerical simulation was conducted by Dancygier (2000) to demonstrate the effect of projectiles on reinforced concrete barriers. He derived expressions to investigate the velocity, angle of impact,
(a) F- shape concrete barrier. (b) F- shape (tall) concrete barrier.
(c) NewJersey concrete barrier. (d) Bridge concrete barrier.
Figure 7: Relationships of concrete barrier dimensions.
and failure pattern of projectiles in concrete barriers. Jiang et al. (2004) derived a numerical analysis method using differential equation to estimate the impact load on a specific concrete barrier. The formulation used F-shape and New Jersey barriers. The first impact phase of a vehicle on a concrete barrier was considered. The design of a concrete barrier could benefit from these equations by using a number of parameters of the design. Bonin et al. (2005) performed a theoretical analysis to deter-mine the test conditions for crash tests. This study found the relationship between dynamic and permanent deflections because of vehicle impact against concrete barriers. The effect of single unit trucks on concrete barriers at a high speed of 80 km/h to 90 km/h was investigated. Models for the interaction between vehicle and concrete barriers were used by Reid and Faller (2007). The results might assist in the design and testing of concrete barriers.
Se-Jin et al. (2008) used yield line theory to represent the failure mode of rigid concrete barriers. The mode of failure resulted from the experimental test, which approximated the yield line pattern. Sheikh et al. (2008) determined the appropriate conditions for roadside and median barriers near slopes. They used F-shape concrete barriers and precast bonds with X-bolts. The results showed that concrete barriers performed well on slopes of 6 H: 1 V or less. Additional tests using other types of concrete barriers widely used near slopes are recommended. A numerical model was proposed by Tabacu and Pandrea (2008) to modify the action of a vehicle during collision with a barrier. The performance of the barrier was also checked using equations. The relationship between displacement and impact time involving different collision angles was illustrated.
Nauman et al. (2009) conducted a bogie test using a finite element model of the concrete barrier. They determined the overall lateral deflection of the barrier. In addition, they simulated the effect of
a 2270 kg pickup vehicle on a single-slope concrete barrier. The tests demonstrated the lateral deflec-tion exerted by vehicle collision. Moreover, they determined the reladeflec-tionship between collision time and lateral force. The deflection exceeded 760 mm and was thus unacceptable. Siddiqui et al. (2009) derived theoretical functions to assess the penetration of missiles into concrete barriers used in tunnels. The results showed that concrete barriers performed reasonably well under this load condition. Nau-man et al. (2010) tested the concrete barriers used near the side slope of roads. Slab connected to barriers usually resist moment to maintain structure stability. Single slope experimental models with-out moment slabs were constructed and tested using a bogie vehicle. Changing the design by adding soil beside the barriers reduced this deflection. Prochowski (2010) computed the lateral deflection of concrete barriers using theoretical models. The expression used second-order polynomial to represent the function of the deflection. The model showed the movement of a vehicle before and after its impact with a concrete barrier. The results of the simulations using the proposed model were com-patible with other experimental results.
Dhafer et al. (2011) conducted three crash analysis tests on three types of concrete barriers used on roads with curves. The tests were performed using 820 S and 2000 P vehicles to impact the concrete barrier. In addition, four tests were executed using a 5400 pickup. They concluded in the curves where lift nodes existed. The effect of the impact angle was more significant than that of the curve. Mar-zougui et al. (2012) reproduced the finite element model of the New Jersey barrier and analyzed it using various types of roads. Then, a Silverado vehicle was used as a model to investigate its impact on the concrete barrier. The crash test simulation results were then compared. With the application of this suggestion, the results improved in comparison with those of previous studies. Mi et al. (2013) conducted numerical analysis to test the safety barriers on rural roads under different impact condi-tions. They tested the impact of a 6-ton vehicle at an angle of 25°.
Numerous software programs are used to analyze concrete barriers. LS-DYNA software is a com-monly used program in such analysis. We summarized a number of these studies that used this software to analyze the impact of concrete barriers. Richard et al. (2002) examined concrete barriers using LS-DYNA finite element software in explicit mode. The models included concrete segments, concrete barriers, floor friction, loops, pins, and vehicle contact with concrete barriers. These main elements were included in the simulations using FEM. Sicking et al. (2003) simulated the behavior of a concrete barrier during a full-scale crash test. LS-DYNA software was used to simulate the concrete barrier and determine the deflection caused by vehicle impact. The program approximated the barrier deflections. A full-scale crash test was conducted and analyzed by the using FEM to simulate impact. The bolts used in the crash test connected the joint between two segments. This connection was also included in the theoretical model, and the simulated results using LS-DYNA software were compatible with the crash test results, as demonstrated by Consolazio et al. (2003).
Marzougui et al. (2003) modified the connections between the portable concrete barriers. This modification was simulated using the finite element LS-DYNA software. These connections were modified using plastic cover, steel cover, w-beam section, tapered shim, and steel rod. Using tapered shims resulted in a 13% decrease in the deflection, whereas using steel cover and plastic covers resulted in a 38% decrease. Nonlinear dynamic analysis was conducted to investigate the same model using LS-DYNA software. Comparison between the two models resulted in different levels of resistance to the impact of the vehicle against the barriers. This finding was shown by Ren and Vesenjak in (2005).
Yonten et al. (2005) analyzed four concrete models of the barriers using LS-DYNA software. The simulation results were evaluated using experimental tests. A number of agreements emerged between the theoretical models and the crash tests. Bullard et al. (2006) simulated a concrete barrier and a vehicle using LS-DYNA. The nonlinear finite element represented the model and the impact of the vehicle. This simulation is shown in Figure 8.
Figure 8:Comparison of tests and simulation of angle fluted barrier, Bullard et al. (2006).
The New York portable concrete barrier was investigated by Atahan (2006) using the LS-DYNA program. The study focused on the welding connector that was tied between the two adjacent sides of the concrete barriers. After the modification, the results showed improved immovability of portable concrete barrier during vehicle collision. Bielenberg et al. (2006) designed a tie-down system for road surfaces using temporary concrete barriers, which was also used in this study. They simulated the design and the full-scale crash test using the LS-DYNA software. Based on the simulation results of the design, the vehicle continued moving after impact with the concrete barrier. Borovinšek et al. (2007) conducted large-scale crash tests using a heavy truck to calculate side deflections for road safety barriers. The simulation of the crash test using the LS-DYNA program was conducted under the same conditions following the European Standard. Itoh et al. (2007a) conducted a full-scale test on a truck using LS-DYNA software to demonstrate its effect on F-shape concrete barriers. The results from this theoretical test agreed with those of previous studies.
Esfahani et al. (2008) used the LS-DYNA software to simulate the F-shape and New Jersey con-crete barriers. In addition, vehicles weighing 8, 10, and 12 tons were simulated using the same pro-gram. The nonlinear finite element model used various types of elements, shells, beams, and solid elements. The simulated concrete barrier had only shell elements. The size of the mesh provided better contact between the car and the barrier. The effect of this contact was limited. The results showed displacements of concrete barriers with a steel bar diameter ranging from 0.190 m (for 12 mm two-bar) to 1.806 m (for 14 mm one bar). Their tests showed the maximum stress at steel connections. This median barrier simulation was conducted by Zhong et al. (2009).
Sturt and Fell (2009) completed fifty computer simulations of vehicle impact on barriers using the finite element method. The LS-DYNA program was used in these simulations. They conducted the tests using a small car imitation. Three crash tests were conducted to compare the models and the crash tests, and to confirm the results of the models. The study focused on accident severity; barrier performance was therefore important in this study. The finite element LS-DYNA program was used for the study on concrete barrier crash conducted by Atahan (2009). The tests evaluated the effect of
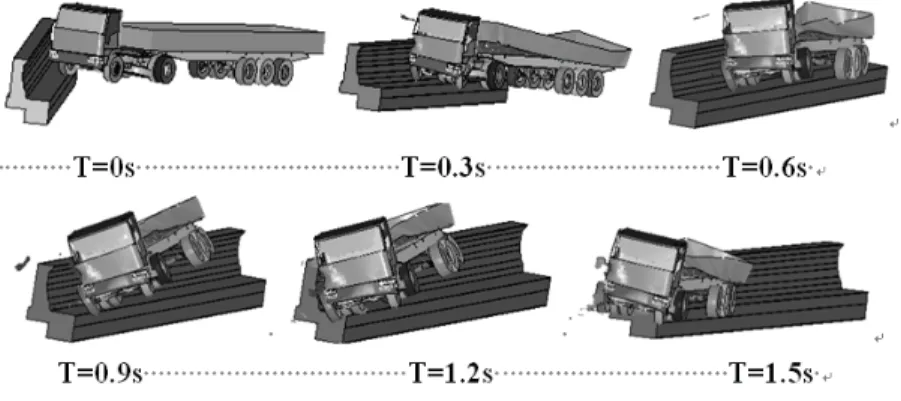
the height of the concrete barrier on the stability of heavy vehicles. Different heights could affect the stability of heavy vehicles after impact. Blast load has a dynamic effect on concrete barriers. An experimental model was built using fiber-reinforced concrete. Nylon and steel fibers were used at different percentages. This experimental test was conducted by Coughlin et al. (2010). They also used the LS-DYNA software to simulate a pattern of failure near the blast test. The results of the actual test were in agreement with the results of the simulation. Sujuan et al. (2011) used LS-DYNA software to analyze various models. They used this program to simulate vehicle collision with different concrete barriers. They created models for concrete barriers and heavy vehicles, as shown in Figure 9.
Figure 9:Barrier model and collision vehicle model, Sujuan et al. (2011).
Jian et al. (2011) used the VPG and LS-DYNA software programs to create their models. They used these programs to simulate truck collisions with concrete barriers. Figure 10 shows the results of the models for the concrete barriers impacted by means of a truck. The results showed that the truck was prevented from running through the barriers.
Figure 10:Simulation of collision using the optimal combination, Jian et al. (2011).
Abu-Odeh et al. (2011) created a typical crash concrete wall barrier and tested it. The models were then simulated using three finite element models. The models were created using the LS-DYNA software. The impact test level was modified, the results were evaluated, the impact of the wall was simulated, and finally, the performance of the wall was evaluated. The results showed that only the wall could not stack the impact, but the front panel impact reached the wall. A numerical simulation of a safety barrier was conducted by Mongiardini and Reid (2011). The simulation of the barrier behind the slope and of a pick-up truck was conducted using the LS-DYNA software. The simulation
showed the performance of the vehicle against the barrier. Nauman et al. (2012) applied the finite element method to compute the minimum rail height for MASH TL-4 tests for vehicle impact with concrete barriers. The simulation was conducted using the LS-DYNA software. They obtained the minimum height of the concrete barrier based on numerous tests. The vehicle immovability increased when the height of the concrete barrier decreased. Sun et al. (2012) applied the LS-DYNA software to analyze concrete barriers used on rural highways. Concrete barriers may control vehicle impact and allow the vehicle to proceed in the right way. Schmidt et al. (2013) investigated the designs of urban roadsides and median barriers. They used the finite element method to simulate the shapes and materials used to reduce the impact and absorb the energy exerted during vehicle collisions. The model reduced the vehicle speed at impact by approximately 33%. The LS-DYNA software was use in the simulation of the materials and designs. They tested the materials used in concrete barriers for dynamics and durability to check their properties during impact. Reid et al. (2013) demonstrated a design of temporary concrete barriers used in race tracks. The models were simulated and analyzed using the LS-DYNA program. The shape of the concrete barriers slanted to the right from the front face and its back was inclined. A foam block was placed at the rear of the concrete barrier to reduce the impact of the vehicle with the concrete barrier and absorb the energy exerted during collision. The system allowed the vehicle to directly collide with the barrier at high speed.
Programs such as MADYMO and ANSYS can be used for the analysis. A number of studies have used these programs. Concrete crash barriers were tested experimentally using a heavy truck. A theoretical model was analyzed using the ANSYS program to obtain a better design of the structure connections between concrete barriers. In addition, a dynamic simulation was conducted using the LS-DYNA software to determine impact loads. The connection was a failure in loading approximately 1.28 MN, allowing small deflections in concrete barriers. The two models were created by Kala et al. (2012). Moradi et al. (2010) simulated the impact between a motorcyclist and the concrete barriers. They used the MADYMO finite element software to create the model. The results were compared with the experimental results obtained from other tests, and were found satisfactory. The icy situa-tions on the road were also compared with the normal condisitua-tions of the roads. Head injuries occurred more often on the icy road than on the normal road. Amato et al. (2011) used the MADYMO software to simulate a concrete barrier and a vehicle. They sketched and analyzed the movement of the vehicle during impact with a concrete barrier. The MADYMO used both multi-body analysis and finite element method. The results showed that the deflection performance of the barrier was satis-factory. Further studies are necessary to evaluate the new models. The simulation is shown in Figure 11.
Figure 11:Car-barrier primary impact scheme and car motion, Amato et al. (2011).
Amato et al. (2013b) conducted a numerical simulation of a vehicle-barrier crash test. The model explored the primary and secondary impacts of a vehicle-barrier crash. The spring-mass system used and merged with the energy preservation law to imitate the impact. They suggested that the contact between the vehicle and the concrete barrier was unnatural and showed constant stiffness. The MAD-YMO software was used to simulate of the model given an impact angle of 20°. The results had a small percentage of errors compared with the simulation results. The strains and internal forces of concrete barriers were not investigated in this study, which can improve the model. Figures 12 and 13 show the model.
Figure 12:Sketch of the car–barrier primary and secondary impacts, Amato et al. (2013b).
Figure 13: Sketch of the angled crash test and the equivalent spring-mass system, Amato et al. (2013b).
Amato et al. (2013a) simulated vertical portable concrete barriers using the MADYMO finite element software. The model results contrasted with the experimental results. The differences in the acceler-ation results between two ways did not exceed 6%, and those for impact speed were approximately 21%. The error in results on the impact speed was excessive; other mesh of the finite element program might decrease this error percentage.
4 EXPERIMENTAL TESTS
4.1 Full-scale tests
Various standard crash testing procedures for concrete barriers and criteria for evaluating the results of such tests are accessible through the National Cooperative Highway Research Program (NCHRP) Report 350, Ross et al. (1993). The longitudinal barriers assessment two tests for containment Test Level 3 (TL-3): first NCHRP Report 350 Test Designation 3-10. The test involves an 820 kg passenger
car impacting at the critical impact point (CIP) within the length of need (LON) of the longitudinal barrier at a nominal speed and angle of 100 km/h and 20°, respectively. The test evaluates the overall performance of the LON section, in general, and occupant risk, in particular. The second NCHRP Report 350 Test Designation 3-11 involves a 2000 kg pickup truck impacting at the CIP within the LON of the longitudinal barrier at a nominal speed and angle of 100 km/h and 25°, respectively. The test aims to estimate the strength of the section for containing and redirecting the pickup truck upon impact. In the AASHTO Manual for Assessing Safety Hardware (MASH), AASHTO (2009), the 820 kg test vehicle is replaced with a 1100 kg vehicle with a strike angle of 25°, while the 2000 kg test vehicle is replaced with a 2270 kg vehicle.
Ronald et al. (1996) conducted two full-scale vehicle crash tests. These tests were conducted to evaluate the development of temporary concrete barriers, and recommended modifying the F-shape barriers to improve the connections between barriers during the impact of the vehicle with concrete barriers. The results showed small deflections on the concrete barrier at the joints between them. Daniel and Kirk (2001) accomplished three full-scale tests for two types of precast concrete barriers. A 2041 kg vehicle was used in the first test and a 2024 kg vehicle was used in the second test. The final one was conducted using a single-unit truck weighing 8,000 kg. The F-shape precast concrete barrier was tested in the full-scale Ford truck with a speed of 76 km/h and an impact angle of 15°. The precast concrete barriers were evaluated with specifications. Small deflections occurred during vehicle impact against the concrete barrier. Richard et al. (2002) used an 820 kg small car in a full-scale crash test. In addition, another crash test was conducted using a 2000 kg pickup vehicle. The impact speeds of both cars were 100 km/h. However, the collision angle of the first car was 20° and that of the second car was 25°.
Consolazio et al. (2003) conducted a full-scale crash test using two types of vehicles (a 2000 P and an 820 C), simulated both cars, and then compared the experimental and simulation results. Bullard in (2003a) tested two aesthetic bridge rails, one concrete barrier, and one steel barrier using a pickup car. The full-scale tests showed that the rail performed well in terms of safety. The angle of the test was 25 ° with the speed of car at 100 km/h to provide the test with a real image of highway roads. Bullard et al. (2003b) used two types of vehicles. The first was an 820 C and the second was a 2000 P, and impact speeds for both were 100 km/h. The angle of collision with barrier of the first vehicle was 20° and that of the second one was 25°. Portions of the results were satisfactory, and the other aspects of the model required modifications. A full-scale crash test was conducted by Karla et al. (2003). They modified and developed the connection way for the concrete barrier with the floor using bolts. The concrete barriers were attached to one another using steel bars. The crash test was con-ducted using two types of vehicles weighing 820 kg and 2000 kg and both with 100 km/h impact speed. The result showed that the tie-down bars could still be used on a concrete deck but not use on a pavement.
Bielenberg et al. (2003) developed two tie-down connections for temporary concrete barriers. These connections secured the barrier to the floor to reduce the deflection of the barrier during vehicle impact. Two full-scale tests were conducted where a 2000 kg pickup vehicle was collided with the concrete barrier. The vehicle passed safely and the results showed that the concrete barriers were up to the specifications. Dean et al. (2004a) investigated the concrete barriers on bridge decks using an 8000 kg vehicle with a speed of 80 km/hour and an impact angle of 15°. The vehicle scratched but
did not destroy the concrete. This result demonstrated that the strength of the concrete barrier was acceptable and its form was appropriate during the test. Dean et al. (2004b) conducted a full-scale test using an 8000 kg vehicle. This car overturned after the impact with a concrete barrier. The concrete barrier was slightly scratched. The car remained in its correct way after the impact with the concrete barrier. No deflection occurred on the concrete rail because of its good quality design and stiffness.
El-Salakawy et al. (2004) used eight full-scale, concrete barriers in a pendulum crash test. The pendulum had a 3.0 ton iron ball. Two concrete barriers were reinforced using glass fiber-reinforced polymer and two concrete barriers were reinforced using steel bars. Different types of concrete barriers were compared and discussed. The results showed cracking patterns, widths of the cracks, and strains in bars. The displacements and forces exerted in concrete barriers should have been included to improve the results. Vehicles travelling at high speed can destroy portable concrete barriers. Cross-bolt can be used to connect concrete barriers of up to 3.0 m long, 813 mm high, and 600 mm wide. An experimental model was tested to evaluate the resistance of bolts to impact loads from vehicles. Computer models were created using the finite element method, and then compared with experimental model. The results showed that the deflection in the dynamic effect did not exceed 686 mm. These results were presented by Roger et al. (2005a, 2005b). Bullard et al. (2006) modified the shape of the concrete barrier and then tested it in a crash test using 820 kg and 2000 kg vehicles both with impact speeds of 100 km/h. The collision angle used in the test was 25°. A full-scale crash test was conducted by Polivka et al. (2006) using a 10000 kg, single unit vehicle. They assessed New Jersey permanent concrete barrier arrangements. The test results showed that these arrangements were ineffective and unsafe during vehicle impact.
Bligh et al. (2006) developed a new connection for portable concrete barriers using cross-bolts that connect the two adjacent pieces of the concrete barriers. This bonding decreased the lateral dynamic deflection exerted from the vehicle impact with the concrete barrier joints. This connection reduced the lateral deflections. Other types of connections could reduce deflections as well as decrease the cost of installation. Itoh et al. (2007a) used a truck weighing 20000 kg to collide with a concrete barrier in a full-scale crash test. The study showed the relationships between time and displacement, and then compared these results with the simulation results. Rosenbaugh et al. (2007) conducted a full-scale test using a fully loaded tractor-trailer. The test was concluded after optimizing the dimensions of the median barrier. The shape showed better performance than the shapes used in previous studies during impact. Dhafer et al. (2007) conducted a full-scale crash test using a 2000 kg pickup truck with an angle of 25° and 100 km/h vehicle speed.
Itoh et al. (2007b) conducted a full-scale test using a heavy vehicle to collide with concrete barriers. The floor condition was created using a spring subgrade representation. The computer models per-formed well in the full-scale test. Kuebler (2008) conducted a full-scale impact test using a 13-ton lorry. This test simulated lorries falling down from the bridges. Australian Road Barriers PTY LTD (2008) conducted a full-scale collision test on concrete barriers using a 2050 kg vehicle. The lateral deflection on the concrete barrier was approximately 1.3 m from its initial position when unconnected barriers were placed on the pavement or fixed to the road surface. They graphed curves to estimate the deflection for 800 kg and 2000 kg vehicles, at collision angles of 10°, 15°, 20°, and 25°. Nauman et al. (2009) conducted a full-scale test using a bogie car to determine the strength and lateral deflection
of concrete barriers with a single side slope. The concrete barriers were connected by means of steel bars. The impact test was performed at 100 km/h speed and 25° collision angle.
Nauman et al. (2010) developed a full-scale test for two single-slope concrete barriers. These bar-riers were bonded with steel bars embedded in 254 mm of soil behind the concrete barbar-riers. A bogie test on impact load was conducted. During floods, the design of the concrete barriers must resist the effects of water pressure. Various types of concrete barriers have openings at the bottom that allow water to pass through without moving the barriers. Analytical and experimental tests were conducted by Bin-Shafique et al. (2011) to determine the stability of concrete barriers. Abu-Odeh et al. (2011) conducted a full-scale crash test and six bogie tests. The tests developed a model of the impact wall. The density, elastic modulus, and Poisson’s ratio were the parameters used in the models. A heavy truck with a 92.4 km/h speed and 14.4° angle was used.
Three full-scale tests were performed by El-Salakawy and Islam (2012) on concrete bridge barriers. They attempted to determine the cracking patterns in and maximum strength of the barriers. A lateral load was applied horizontally at the midpoint and the edge of the concrete barriers. The tests simulated a vehicle crash test in the laboratory. The effect of the load was observed at the height of 700 mm from the ground, which was the same height as that of the car steel impact. The test results illustrated that the load to failure of the concrete barriers was 382 KN at the center of the barrier and was 241 KN near the barrier edge. The failure pattern showed the punching shear failure. A trapezoidal crack appeared in front of the barrier and a vertical crack appeared at the back of the barrier. The test could use other types of concrete barriers with different materials. Reid et al. (2013) conducted a full-scale test using a 1701 kg NASCAR stock car. To measure the ability of foam blocks placed behind the concrete barrier, to absorb crash loads.
4.2 Laboratory tests
El-Salakawy et al. (2003) performed experimental tests to study the corrosion of the reinforcements in bridge concrete barriers. These tests consisted of two parts: a static test using full-scale concrete barriers and a pendulum impact test with a test load of 3.0 tons. Both tests used glass fiber-reinforced polymer in place of the steel reinforcement. The results illustrated likeness in some parameters of the proposed barrier with the conventional reinforced concrete barriers. Zhao et al. (2004) conducted laboratory experiments on a concrete barrier used in a bridge deck. Horizontal forces were disregarded in the test. The force was applied by pulling and not pushing. The connection strength was found to exceed specifications. The researchers related the displacement relationship with force, but did not clarify whether the strains were located in the concrete barrier nor apply the finite element method to the model used for comparison; an analytical method was used instead. El-Salakawy et al. (2005) built and tested eight concrete bridge barrier models. Two models were reinforced with glass fiber-reinforced polymer bars; two other models were fiber-reinforced with steel bars. A 3.0 ton pendulum impact test was applied to all models.
Khaled et al. (2008) developed bolted linking between precast concrete barrier walls and a bridge deck. They tested five full-scale samples of the proposed models. The models were installed and tested, but failed to validate the concrete barrier system. The bolt connections of road safety barriers are very important, and help prevent barrier destruction and the separation of composite parts during vehicle collisions. Therefore, these connections were tested by Bayton et al. (2009) to evaluate the
performance of the barriers during collisions. The results showed the ability of bolted connections to resist the impact loads. The development pendulum test is useful in crash tests. The damage done to longitudinal barriers can be measured using the pendulum test to calculate many types of failure, such as vertical and horizontal split. The pendulum test requires equipment and tools, including the tested barriers. This test method was used by Gabauer et al. (2010).
A static laboratory test was conducted by Jeon et al. (2011) to simulate the failure of the precast concrete barrier models. The tested barrier withstood the maximum tested loads. The crash position was also shown. A static experimental test conducted by Seung-Kyung et al. (2012) involving concrete barriers used in modular bridges. Vertical and horizontal bolts were used in the experimental models and tested statically. The failure pattern showed cracks in the area around the bolts and nuts. These cracks may weaken the concrete barriers. Concrete barriers were improved by Mongiardini et al. (2013), to reduce this failure. The results can help improve the connection between the concrete barrier and the bridge deck.
Table 3 summarizes the test methods, validation, and the corresponding comments.
5 EFFECT OF PARAMETERS IN TESTS
The parameters used in impact tests can be arranged in order according to the NCHRP Report 350, Ross et al. (1993) and a collision angle of 90°, which is used in laboratory tests. Table 4 shows this arrangement, also table lists the tests type and concrete barrier shapes.
Table 4 shows that majority of literature, or 90% of studies, focused on field research tests. There-fore, the biggest challenge in future research is to develop laboratory equipment that can simulate field tests. More tests should be conducted for other types of concrete barriers, such as the New Jersey. Furthermore, additional investigations should be performed on the functions of concrete bar-riers for bridges, the relation between impacting vehicles, and the steel connection between the slab of a bridge and a barrier.
Figure 14 presents the percentages of the three parameters and their effects on impact tests. For the bubble chart, speed and strike angle were taken on X- and Y-axes respectively, whereas the bubble size was represented vehicle weight. Commonly, vehicle speed used in the concrete barrier tests 100 km/h because that speed is often reached on highway roads. The cars weighing less than one ton represented small vehicles or passenger cars, whereas those weighing two tons or more represented heavy vehicles, such as lorries and trucks. Most tests used in the reviewed studies were full-scale crash test involving a 2000 kg pickup truck with an angle of 25° (49%) and a vehicle speed of 100 km/h (54%). However, small cars (700 kg and 800 kg) were tested with an angle of 20° (24%) and a vehicle
speed of 50 km/h (8%). And heavy vehicles (8000 kg and 36000 kg) were used in the testing of an angle 15° (27%) and vehicle speed (70 km/h and 80 km/h) (38%).
6 CODES REVIEW OF BRIDGE CRASH BARRIERS
The following section reviews the primary international standards and codes that are most commonly used in crash barriers for bridges worldwide. As illustrated in the NCHRP Report 350, Ross et al. (1993) or the MASH, AASHTO (2009); AASHTO (2011b); AASHTO (2011a), crash barriers for bridges must agree with site requirements, which leads to several-test level ideas. Crash barriers for
Test Methods Validation Comments
Structural Analysis Preliminary bridge barrier design Complex vehicle-barrier behavior occurs du-ring impacts. Thus, this test method is ne-cessary as a means to back up both sufficient barrier strength and vehicle impact reaction. Static Tests Structural analysis and force-displacement
behavior
Static test is applied mostly in designing new precast barriers. Studies must prove the structural capacity of the barrier, anchors, and deck to evaluate design development. In addition, the barrier system is set to sa-tisfy the test level.
Dynamic Tests (Pen-dulum)
Bridge barrier dynamic strength and anchor system strength
The benefit of dynamic tests (pendulum) is that they can make realistic crash loads and demonstrate the dynamic capacity of barrier systems.
Computer Simulations Parametric studies and design optimization Simulation is one of the most important steps to model and optimize a new barrier design at a low cost compared with crash tests.
Crash Test Levels (Full-scale)
TL-1 In general, this level is suitable for work zo-nes with low-posted speeds, very low volume of vehicles, and low-speed local streets.
This test level is used in small streets where speed is limited.
TL-2 In general, this level is suitable for work zo-nes as well as local and collector roads with a small number of heavy vehicles expected and decreased speed.
This test level is employed in local streets and with heavy vehicles.
TL-3 In general, this level is suitable for a wide range of high-speed arterial highways with very low mixtures of heavy vehicles and with favorable site conditions.
This test level is basic in all types of barrier design, as well as in bridge crash barrier.
TL-4 In general, this level is suitable for the majo-rity of applications on high-speed highways, freeways, expressways, and interstate highways with a mixture of trucks and heavy vehicles.
TL4 barriers concur with bridge barrier de-sign requirements.
TL-5 In general, this level is suitable for the same applications as TL-4 as well as on roads where large trucks comprise a significant portion of the average daily traffic or when unfavorable site conditions justify a high le-vel of rail resistance.
TL-5 provides vehicles, in cases where TL-4 gives an insufficient case because of the high number of vehicles; rollover or penetration beyond the barrier can occur.
TL-6 In general, this level is suitable for applica-tions where tanker-type trucks or similar high center-of-gravity vehicles are anticipa-ted, particularly along unfavorable site con-ditions.
A tanker-type truck exhibits a high center of gravity. TL-6 is for such vehicle type.
Table 3: Barrier Test Methods (MASH, AASHTO 2009 and NCHRP Report 350 summarize).
bridges must use the aforementioned criteria for testing and assessment. Crash testing of bridge barriers is performed with a series of full-scale impact tests that follow the recommended guidelines of the NCHRP Report 350 or MASH to appraise barrier strength and safety performance. To evaluate one or more major performance factors such as structural adequacy, occupant risk, and the
Author (s) (year) Collision angle Speed of vehicle (km/h) Weight of vehicle (kg) Type of tests
Shape of barrier
15 ° 20 ° 25 ° 90
° 50 70
& 80
100 700
& 820
2000 8000 & 36000
Bullard (2003a) √ √ √ √ √ Field Bridge concrete barrier
Consolazio et al. (2003) √ √ √ √ √ Field Low profile barrier
Roger et al. (2005b) √ √ √ Field F-shape
Roger et al. (2005a) √ √ √ Field F-shape
Ren and Vesenjak (2005) √ √ √ Field F-shape
Borovinšek et al.(2007) √ √ √ √ √ √ Field F-shape
Itoh et al. (2007a) √ √ √ Field F-shape
Se-Jin et al. (2008) √ Lab Bridge concrete barrier
Atahan and Sevim (2008) √ √ √ Field New Jersey Shape
Kuebler (2008) √ √ √ Field Bridge concrete barrier
Zhong et al.(2009) √ √ √ Field F-shape
Bayton et al. (2009) √ Lab Bridge concrete barrier
Coughlin et al. (2010) Field Rectangular
Nauman et al. (2010) √ √ √ √ √ √ Field Single-slope
Gabauer et al. (2010) √ √ Field F-shape
Bin-Shafique et al. (2011) √ Field F-shape
Kala et al. (2012) √ √ √ √ √ √ Field F-shape
Seung et al. (2012) √ Lab Bridge concrete barrier
Sujuan et al. (2011) √ √ √ Field Bridge concrete barrier
Jian et al. (2011) √ √ √ Field Bridge concrete barrier
Nauman et al. (2009) √ √ √ √ √ √ Field Single-slope
Uttipec (2010) √ √ √ √ √ Field F-shape
Australian Barriers (2008) √ √ √ Field F-shape
Bullard et al. (2003b) √ √ √ √ √ Field F-shape
D. C. Alberson et al. (2004a) √ √ √ Field Bridge concrete barrier
D.C. Alberson et al. (2004b) √ √ √ √ √ √ Field Bridge concrete barrier
Karla et al. (2003) √ √ √ Field F-shape
Esfahani et al. (2008) √ √ √ Field F-shape+ N J Shape
Bullard et al. (2006) √ √ √ Field Bridge concrete barrier
McDonald and Kirk (2001) √ √ √ √ √ √ Field F-shape
R. K. Faller et al. (1996) √ √ √ Field F-shape
Rosenbaugh et al. (2007) √ √ √ Field Bridge concrete barrier
B. Bielenberg et al. (2003) √ √ √ Field F-shape
Abu-Odeh et al. (2011) √ √ √ Field Bridge concrete barrier
Dhafer et al. (2007) √ √ √ Field 5-type
Dhafer et al. (2011) √ √ √ Field F-shape
Richard et al. (2002) √ √ √ Field New Jersey Shape
Sicking et al. (2003) √ √ √ Field F-shape
Nauman et al. (2012 ) √ √ √ Field Bridge concrete barrier
Bambach et al. (2010) √ √ √ Field Many type
Amato et al. (2011) √ √ √ Field Rectangular
Ivey et al. (1980) √ √ √ Field F-shape
Amato et al. (2013b) √ √ √ Field Single-slope
Reid et al. (2013) √ √ √ Field Rectangular
Tabacu and Pandrea(2008) √ √
Sturt and Fell (2009) √ √ √
Reid and Faller (2007) √ √ √ Field Single-slope
Mi et al. (2013) √ √ √ Field Single-slope
Polivka et al. (2006) √ √ √ Field New Jersey Shape
Prochowski (2010) √ √ √ √ √
Table 4: Parameters used in impact tests.
Figure 14: Parameters used in impact tests.
post-impact behavior of vehicle, solitary tests must be designed. Bridge barriers must be crashwor-thy, both structurally and geometrically, to protect the passengers inside the colliding vehicle from the barriers, other vehicles near the collision, and people on the road near the structure. Six levels are used in bridge crash barrier testing. Vehicle weight and speed, along with impact angle, are the main testing criteria for the chosen test level, as shown in Table 5.
Vehicle Characteristics Small Automobiles Pickup Truck Single- Unit Van Truck Van-Type Tractor-Trailer Tractor- Tanker Trailer N C H RP Re po rt 3 50
W(kg) 700C 820C 2000P 8000S 22500 36000 36000
Crash angle 20° 20° 25° 15° 15° 15° 15°
Test Level Test Speed (km/h)
TL-1 50 50 50 N/A N/A N/A N/A
TL-2 70 70 70 N/A N/A N/A N/A
TL-3 100 100 100 N/A N/A N/A N/A
TL-4 100 100 100 80 N/A N/A N/A
TL-5 100 100 100 N/A N/A 80 N/A
TL-6 100 100 100 N/A N/A N/A 80
AAS HT O M AS H
W(kg) 1100C 1500C 2270P 10000S N/A 36000 36000
Crash angle 25° N/A 25° 15° N/A 15° 15°
Test Level Test Speed (km/h)
TL-1 50 N/A 50 N/A N/A N/A N/A
TL-2 70 N/A 70 N/A N/A N/A N/A
TL-3 100 N/A 100 N/A N/A N/A N/A
TL-4 100 N/A 100 90 N/A N/A N/A
TL-5 100 N/A 100 N/A N/A 80 N/A
TL-6 100 N/A 100 N/A N/A N/A 80
N/A:- not applicable.
Table 5: Bridge barriers test levels and crash test criteria, AASHTO (2012).
The AASHTO LRFD Bridge Design Specifications AASHTO (2012) explains Test Level 4 as “taken to be generally acceptable for the majority of applications on high-speed highways, freeways, express-ways, and interstate highways with a mixture of trucks and heavy vehicles” . Following this explana-tion, crash barriers for bridges that are rated as TL-4, as indicated in the NCHRP Report 350 or MASH, are recommended for all types of highway bridges. The bridge crash barrier system must exhibit satisfactory performance, as verified in all full-scale crash tests.
The height of a bridge barrier should be at least 686 mm for TL-3, 813 mm for TL-4, 1067 mm for TL-5, and 2286 mm for TL-6. Based on the NCHRP Report 350 and on an expertise, the minimum height (686 mm) is used for all types of bridge crash barriers, such as concrete parapets as well as combined concrete and metal rails. The design must consider the minimum bridge deck overhangs (200 mm) in the crash tests because of the damage in the slab areas caused by the striking of the bridge barrier.
Test specimens may use yield line analysis and strength design in bridge crash barriers. In this analysis, the yield line failure pattern is assumed to happen only inside the barrier and not on the bridge deck, as shown in Figure 15, where H refers to the height of a wall, LC refers to the critical
length of the yield line failure pattern, Lt refers to the longitudinal length of the impact force
distri-bution, Ft refers to the applied impact force, and refers to lateral deflection. The deck must
demonstrate sufficient resistance against the applied force to remain connected with the barrier.
(a) For Impact within Wall Segment. (b) For Impact near End of Wall Segment.
Figure 15: Yield Line Analysis of Concrete Walls, AASHTO (2012).
The bridge crash barriers in the Canadian Code, CSA (2013) refers to AASHTO (2012) and the NCHRP Report 350. Many specifications and requirements in this code are the same as those in United States codes. In the Canadian Code, barriers must be cast from materials should resist a highly corrosive environment. Bridge barriers have three performance levels (PL). PL-1 requires crash test-ing with a small vehicle and a pickup truck in accordance with AASHTO. PL-2 involves crash testtest-ing with a small vehicle, a pickup truck, and a single-unit truck in accordance with AASHTO. PL-3 requires crash testing with a small vehicle, a pickup truck, and a tractor trailer truck in accordance with AASHTO. The crash test necessary for PL-1, PL-2, and PL-3 must at the crash test levels 2, 4, and 5, respectively, of the NCHRP Report 350. The minimum height used in Canadian bridge barriers is 700 mm, whereas a single front slope barrier is 800 mm high.
Bridge barriers in the Australian Code, Queensland (2014) must conform to the AS 5100 Bridge Code. The minimum design load of barriers must be at “regular” level. This specification has three performance levels for testing barriers according to their height: low (minimum of 500 mm), regular (minimum of 800 mm), and medium (1100 mm high). Meanwhile, the two barrier design criteria are normal and special road safety barriers. A concrete barrier is required when vehicle speed is 80 km/h or greater, such as in normal road barriers. When the design is considered to be outside the normal scope, a special road safety barrier design is required. Special barriers are used when vehicle speed is 110 km/h in the straight horizontal and curved horizontal alignments. This type of barrier must be a reinforced concrete barrier and should be able to resist load impact. Its minimum height is 1600 mm.
Bridge crash barriers are designed to resist the impact of vehicles, Indian (2014). Table 6 shows the categories of applications. The minimum height of bridge crash barriers is 900 mm for both PL-1 and PL-2, and 1550 mm for PL-3. Sometimes, bridge barriers are cast in situ or precast as a reinforced concrete barrier.
Category Application Containment for
P-1: Normal Containment Bridges carrying expressway or equivalent. 15 kN vehicle at 110 km/h, and 20° angle of impact
P-2: Low Containment All other bridges except bridge over railways. 15 kN vehicle at 80 km/h and 20° angle of impact
P-3: High Containment At hazardous and high risk locations, over busy railway lines, complex interchanges, etc.
30 kN vehicle at 60 km/h and 20° angle of impact
Table 6: Barrier Test Categories, Indian (2014).
In Europe, the crash containment levels used are different from those of United States codes. Table 7 presents the test levels DIN EN 1317, EN (2003). Moreover, crash containment levels are divided into four resistance levels: temporary barriers, normal resistance, high resistance, and very high re-sistance.
Test Impact Velocity (km/h) Impact Angle Vehicle Weight (kg)
TB11 100 20° 900
TB21 80 8° 1300
TB22 80 15 1300
TB31 80 20 1500
TB32 110 20 1500
TB41 70 8 10000
TB42 70 15 10000
TB51 70 20° 13000
TB61 80 20 16000
TB71 65 20 30000
TB81 65 20 38000
Table 7: Containment Levels, EN (2003).
7 ANCHORING METHODS OF BARRIERS
7.1 Anchoring concrete barriers onto road
Anchoring methods have a significant function in crash protection, particularly on highways with a speed limit of over 100 km/h. Many researchers have concentrated on studying the relationship be-tween concrete barriers and surface roads.
Bielenberg et al. (2003) developed two tie-down connections for temporary concrete barriers to reduce the lateral deflection of the barrier and to keep deflecting barriers on the bridge deck edge by ensuring the connection between the barrier and the floor. A steel tie-down double strap and a trap-ezoidal strap that retained the vertical pin were used in the first arrangement, as shown in Figure
16.The second system used steel H-section with four steel angles welded to each base of the barrier to make rigid connections with the floor. The results showed that concrete barriers with anchoring comply with TL-3 impact safety standards (NCHRP Report No. 350), and thus, a vehicle can pass safely.
(a)Cross section of barrier (b) Steel strap dimensions
Figure 16:Double steel strap design details, Bielenberg et al. (2003).
Karla et al. (2003) used an anchor bolt block loop in a space (889 mm long), and then bent the loop to make it U-shaped. The anchor bolt area was reinforced. The end connection is shown in Figure 17. The model was tested via a full-scale crash test with an impact speed of 100 km/h. The tie-down bars could not be used on a pavement, but could be used on a concrete deck.
Note: - all units in (mm)
Figure 17:Double steel strap design details, Karla et al. (2003).
Occasionally, temporary concrete barriers are required to connect with the surface of asphalt roadways. Bielenberg et al. (2006) used three steel pins on the front face of a barrier. The results of the computer simulation demonstrated that a vehicle could safely redirect when the model was tested according to the NCHRP Report No. 350 Test Designation 3-11. Polivka et al. (2006) investigated New Jersey concrete barriers. The barrier-to-asphalt surface connection used straight bars and angled bars, as shown in Figure 18. The longitudinal spacing of these bars was 203 mm. Epoxy was used in the name Fast Set Formula Power-Fast High Strength Epoxy anchorage system to connect the bars with the asphalt. During vehicle collision, the barrier was found unsafe.
MRSF (2006) tested temporary concrete barriers with a tie-down near the edge of a drop-off to confirm their performance capability, as shown in Figure 19. The system was crashed, according to the NCHRP Report 350 test designation 3-11, and passed effectively.
Nauman et al. (2009) conducted tests on a single-slope concrete barrier using soil with a depth of 254 mm from the face and back of the concrete barriers to anchor them beside the road. Model deflection was computed using a pickup and a bogie car, and then determined from the simulation. Model deflection complied with the specification limits.
Figure 18:Permanent New Jersey safety shape barrier connection with asphalt, Polivka et al. (2006).
Figure 19:Double steel strap design details, MRSF (2006).
7.2 Anchoring of concrete barriers onto the bridge deck
The method of anchoring concrete barriers onto the bridge deck is critical because serious accidents may occur when connection fails. Thus, an excellent design must provide secure connection between the bridge deck and the concrete barrier. For anchoring bridge concrete barriers, a reinforcing steel with adequate length must be embedded to increase yield strength, AASHTO (2012).
Zhao et al. (2004) tested two types of connection between a concrete barrier and a bridge deck in a laboratory. The connection strength exceeded the specified value limit, which is an advantage of the proposed connections. Thus, the joint arrangement was implemented on the Kings Stormwater Bridge. Figure 20 shows these two types of connections.
(a) Schematic of the Caltrans Type 25 Barrier. (b) Detail of the barrier–deck–girder connection. Figure 20: Connection of the barrier to the deck slab,Zhao et al. (2004).
Alberson et al. (2004a) tested concrete barriers on bridge decks using the standard connection between a bridge deck and a concrete crash barrier. The test result confirmed that the connection strength of the concrete barrier and the bridge deck satisfies the specifications. They also conducted a full-scale test using an 8000 kg vehicle to check the strength of the connection between the bridge deck and the barrier, Alberson et al. (2004b). Rosenbaugh et al. (2007) proposed numerous designs for anchoring concrete barriers to bridge decks. However, these connections used two methods to support inner reinforcements, as shown in Figure 21.
(a) Anchorages of Freestanding Cage vs. Stirrups Cast into
Base Slab (b) Design A, One of Three Top Designs
(c) Barrier End Section Configuration (d) Footer and Barrier End Section Design
Figure 21: Connection of the barrier to the deck slab,Rosenbaugh et al. (2007).
Precast concrete bridge parapets are used in some bridges for easy construction. The system shown in Figure 22 was presented by Colombia and Transportation (2007); CSA (2013). The bridge deck and the precast concrete barrier were connected with bolts.
Kuebler (2008) tested many types of barriers, one of which is a concrete barrier. Shear connector size M 16 was used to secure the concrete barriers to the floor. Connector spacing was 6 m. Khaled et al. (2008) proposed and tested five bolted connections between precast concrete barrier walls and a bridge deck. Figure 23 shows the proposed connection. The models were installed and tested. The theoretical and experimental results are in good agreement.
Figure 22: Precast concrete bridge parapet, Colombia and Transportation (2007); CSA (2013).
Figure 23: Proposed barrier wall to deck slab connec-tion details, Khaled et al. (2008).
Claude et al. (2011) studied two types of reinforcement using the median barrier to check short- and long-term cracking behavior. The first barrier was reinforced using glass fiber-reinforced polymer (GFRP) bars, whereas the second barrier used galvanized steel bars, with 8 bars and 12 bars for longitudinal reinforcement, as shown in Figure 24. The equivalent structural behavior in the short term is nearly the same for both types.
(a) Steel-reinforced (b) GFRP-reinforced
Figure 24: Designs of barriers, Claude et al. (2011).
El-Salakawy and Islam (2012) performed three experimental tests on concrete bridge barriers. The reinforcement used in both the bridge deck and the concrete barriers was GFRP bars to avoid steel reinforcement corrosion. Figure 25 shows the cross section and reinforcement details of the prototype. The failure pattern exhibited punching shear failure. The connection and model comply with the Canadian Code (CSA-S6-06).
At the ends of the bridge substructure, the concrete barrier was placed and connected, as shown in Figure 26. For Australian bridge specifications, Queensland (2014), barrier connection to the deck is reinforced with bars spaced at 150 mm, and connection by joints or concrete pours is unacceptable.
Figure 25: Details of barriers reinforcement, El-Sa-lakawy and Islam (2012).
Figure 26: Details of barrier connection at the bridge substructure, Queensland (2014).
Khederzadeh and Sennah (2014) improved the PL-3 bridge barrier using high-modulus GFRP bars with headed ends. The ultimate load capacity of the barrier exceeded the specifications of the Canadian Highway Bridge Design Code. This proposed connection is shown in Figure 27.
8 PATENTS REVIEW OF BARRIERS
Many patents have been awarded, which have further improved the performance of concrete barriers. Ivey and Ross (1994) introduced the safety end barrier, which is placed in the direction of traffic flow. The height of this barrier increases from the normal floor level at the end. The two-threaded ends of the bolts with nuts are used to connect the end barrier to the concrete roadside. An align-ment system of erect concrete barriers was developed by Nagle (1997a) to move barriers using a pre