Abstract
Based on steel strains recorded during shake table tests of six wall specimens, the effect and contribution of steel reinforcement to peak shear strength and displacement capacity of low-rise concrete walls is assessed and discussed. The experimental program included four variables such as wall geometry, concrete type, web steel ratio and type of web reinforcement. Wall response was assessed through effective steel strains in vertical reinforcement, efficiency factors of wall reinforcement, contribution of web horizontal reinforcement to wall shear strength, and the effect of type of web reinforcement to wall displacement.
Keywords
Concrete wall, efficiency factor, housing, reinforcement contribution, shake table, steel strain.
Reinforcement contribution to the behavior of low-rise
concrete walls
1 INTRODUCTION
Low concrete strength, thin reinforced concrete (RC) walls, low axial stress, low steel ratios, web shear reinforcement made of deformed bars or welded-wire mesh, and 100-mm thick solid slabs or slabs made of precast elements are frequently used in typical low-rise housing units in several Latin American countries such as Mexico, Peru, Chile and Colombia. However, most experimental studies on the seismic behavior of walls reported in the literature comprise wall specimens having characteristics different from those of typical low-rise housing units in Latin America.
For estimating the web steel contribution to peak shear strength and displacement capacity of RC walls, results of several experimental studies have been reported in the literature (Benjamin and Williams, 1957; Barda et al., 1977; Cárdenas et al., 1980; Lefas et al., 1990; Hidalgo et al., 2002; Flores et al., 2007; Gulec and Whittaker, 2011). However, consistent trends of the contributions are
Julian Carrillo a Andrés Guzm án b Sandra Jerez c
a Department of Civil Engineering,
Universidad Militar Nueva Granada, UMNG, Colombia.
b Department of Civil and
Environmental Engineering, Universidad del Norte. [email protected]
c Department of Civil Engineering,
Escuela Colombiana de Ingeniería Julio Garavito.
Latin American Journal of Solids and Structures 11 (2014) 1791-1805
lacking. In addition, due to the particularities of the RC walls in low-rise housing, most of the design recommendations are not directly applicable.
To assess the effect of steel reinforcement in the behavior of walls having the reported characteristics, an experimental program comprising walls tested under shake table excitations was implemented. Wall response was assessed through effective strains in vertical reinforcement, efficiency factors of wall reinforcement, contribution of web horizontal reinforcement to wall shear strength, and the effect of type of web reinforcement to wall displacement.
2 EXPERIMENTAL PROGRAM
The prototype was a two-story house built with RC walls and having floor plan area that varies between 35 and 65 m2. Wall thickness and story clear height is 100 mm and 2400 mm, respectively. Nominal concrete compressive strength is 15 MPa. The experimental program comprised testing of six isolated cantilever walls and included variables such as wall geometry, concrete type, web steel ratio and type of web reinforcement.
2.1 Wall geometry
Walls having height-to-length ratio (hw/lw) equal to 1.0, and walls having door and window
openings were tested. Full-scale wall thickness, tw, and clear height, hw, were 100 mm and 2.4 m,
respectively. Due to limitations in the payload capacity of the shake table used in this study, lightly-reduced scale models were designed and built for testing (i.e. geometry scale factor equal to 1.25). Geometry and main characteristics of wall specimens are shown in Fig. 1 and Table 1, respectively.
2400
100
2400
600
200
3000 800
500
(a)
All dimensions in mm
24
0
0
12
0
0
21
0
0
800 900 1120 860 120
3800
4400 (b)
Latin American Journal of Solids and Structures 11 (2014) 1791-1805
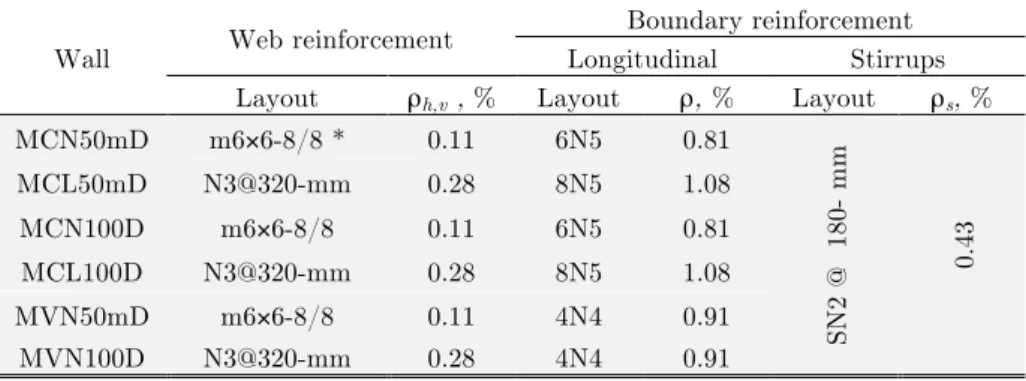
Wall Web reinforcement
Boundary reinforcement
Longitudinal Stirrups
Layout ρh,v , % Layout ρ, % Layout ρs, %
MCN50mD m6×6-8/8 * 0.11 6N5 0.81
SN
2
@
18
mm
0.
43
MCL50mD N3@320-mm 0.28 8N5 1.08
MCN100D m6×6-8/8 0.11 6N5 0.81
MCL100D N3@320-mm 0.28 8N5 1.08
MVN50mD m6×6-8/8 0.11 4N4 0.91
MVN100D N3@320-mm 0.28 4N4 0.91
Table 1: Main characteristics of specimens.
The walls were named using the following labeling system. Take, as an example, “MCN50mD”. The letter “M” indicates a wall test. The second letter indicates the geometry: C = solid wall having height-to-length ratio (hw/lw) equal to 1.0, and V = walls having openings (door and window). The
third letter indicates the concrete type: N = normalweight, and L = lightweight. The fourth indicator relates to the web steel reinforcement ratio: 100 = 100% of ρmin (0.25%), and 50 = 50% of
ρmin (0.125%). The fifth indicator relates to the type of web reinforcement. When deformed bars
were used, the letter is omitted. Otherwise, a lower-case letter “m” indicates that welded-wire mesh was used. Finally, the last letter “D” indicates that the wall underwent dynamic testing through shake table excitations.
2.2 Concrete type
Ready-mixed concrete was used for wall casting. Nominal concrete compressive strength, fc’, was 15
MPa for two types of concrete. Measured compressive strength of normal and lightweight concrete from cylinder tests at the time of testing of walls was 24.8 MPa and 21.0 MPa, respectively.
2.3 Web steel ratio
Two web steel ratios were studied: 100% of ρmin (0.25%), and 50% of ρmin (0.125%). The minimum
web steel ratio (ρmin) was that prescribed by ACI 318-11 Building Code, which is the same to that
prescribed in the Colombian Code of Earthquake Resistant Construction, NSR-10. Web reinforcement was placed in a single layer in the middle of the thickness of the walls and same ratios of horizontal and vertical reinforcement (ρh = ρv) were used. Web reinforcement ratios in
Table 1 were calculated from design dimensions.
To better understand the strength mechanism that take place during shear failures observed in RC walls for low-rise housing, longitudinal boundary reinforcement was purposely designed to prevent flexural and anchorages failures prior to achieving a shear failure.
Latin American Journal of Solids and Structures 11 (2014) 1791-1805 2.4 Type of web reinforcement
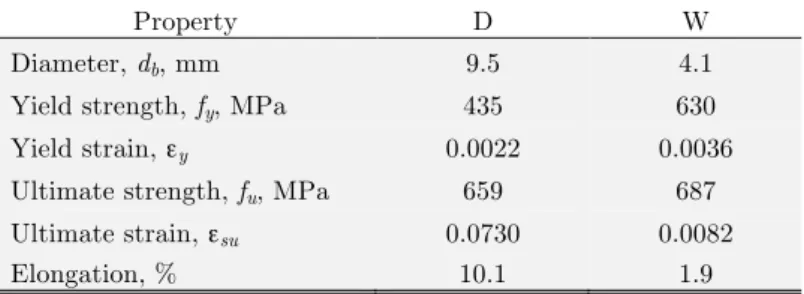
Deformed bars (D) and welded-wire (W) mesh made of small-gage wires were used. Nominal yield strength of bars and wire reinforcement, fy, was 412 MPa (for mild steel) and 491 MPa (for
cold-drawn wires). Mean value of the main measured mechanical properties of steel reinforcement are presented in Table 2.
The behavior of wire reinforcement used in this study was characterized by fracture of material with a slight increment of strain (Elongation percentage in Table 2). In this study, the elongation capacity of wires was a key parameter for displacement capacity of walls reinforced in the web using this type of reinforcement.
Property D W
Diameter, db, mm 9.5 4.1
Yield strength, fy, MPa 435 630
Yield strain, εy 0.0022 0.0036
Ultimate strength, fu, MPa 659 687
Ultimate strain, εsu 0.0730 0.0082
Elongation, % 10.1 1.9
Table 2: Measured mechanical properties of steel reinforcement.
2.5 Testing and instrumentation
Models were subjected to a series of base excitations represented by earthquake records associated to three limit states. Shake table tests of walls were carried out at UNAM. An axial compressive stress of 0.25 MPa was applied on top of the walls and was kept constant during testing. Internal instrumentation was designed to acquire data on the local response of steel reinforcement through strain-gages at selected locations, specifically aimed at evaluating layout of yielding of steel reinforcement.
3 TEST RESULTS AND DISCUSSION
Wall response was assessed through effective strains in vertical reinforcement, efficiency factors of wall reinforcement, contribution of web horizontal reinforcement to wall shear strength, and the effect of type of web reinforcement to wall displacement.
3.1 Effective strains in vertical reinforcement
To analyze the effect of web reinforcement in the behavior of walls, strain measured at vertical bars or wires were firstly modified because border conditions of walls in the prototype were slightly different to those of walls in the tests.
Longitudinal reinforcement at boundary elements
Latin American Journal of Solids and Structures 11 (2014) 1791-1805
in section 2.3, longitudinal boundary reinforcement of tested walls was designed and detailed to prevent flexural and anchorage failures prior to achieving typical shear failures observed in RC walls for low-rise housing.
In the prototype, all walls are connected to a RC solid slab, so that, rotation at wall top end is restrained. Due to their geometry, walls are characterized with hw/lw =1 or lower. The behavior of
these squat walls is governed by shear deformations and hence the area of longitudinal boundary reinforcement is usually controlled by minimum requirements. Therefore, longitudinal boundary reinforcement of prototype walls is significantly lower than that of the tested walls. If the amount of longitudinal boundary reinforcement of the tested walls had been similar to that used in prototype walls, a flexural failure would have been observed.
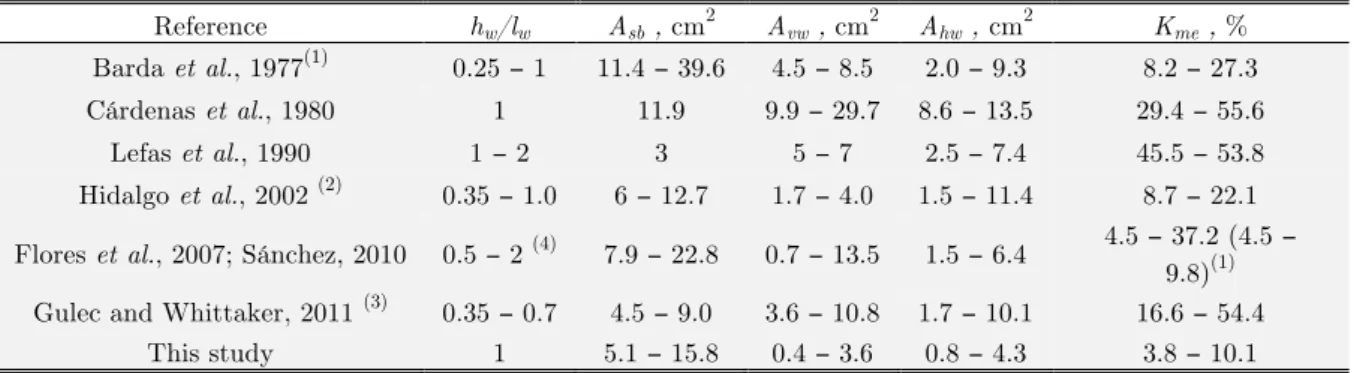
Table 3 shows the reinforcement area of walls used in this study. Data of walls found in a literature review are included in the table. In the table, factor Kme is the ratio between the axial
stiffness of web vertical reinforcement and the axial stiffness of the total vertical reinforcement at the wall cross section (two boundary elements and web) (Kvw/Kvt). Therefore, Kme is computed as:
vw vw vw s sb sb sb s vw vw vw s vt vw me
h
A
E
h
A
E
h
A
E
K
K
K
/
)
(
/
)
2
(
/
− − −+
=
=
(1)where Avw, hvw and Es-vw are the area, height and modulus of elasticity of vertical reinforcement in
the web, respectively, and Asb, hsb and Es-sb are the area, height and modulus of elasticity of vertical
reinforcement in the boundary elements, respectively. Since the modulus of elasticity and height (h) of the vertical reinforcement is the same for each wall, factor Kme can be computed as:
vw sb vw vt vw me
A
A
A
A
A
K
+
=
=
2
(2)In Table 3, the lowest value of the upper limit of Kme is roughly equal to 10% and is associated
both to the walls of this study and to the similar walls tested under quasi-static cyclic load (Flores
et al., 2007; Sánchez, 2010). A Kme value of 10% indicates that Kvw is equivalent to 10% of Kvt. In
the study reported by Hidalgo et al. (2002), the upper limit of Kme was equal to 22.1%, that is, Kvw
was roughly twice the value of Kvw of this study. Table 3 also shows that values of Kme were
Latin American Journal of Solids and Structures 11 (2014) 1791-1805
Reference hw/lw Asb , cm2 Avw , cm2 Ahw , cm2 Kme , %
Barda et al., 1977(1) 0.25 − 1 11.4 − 39.6 4.5 − 8.5 2.0 − 9.3 8.2 − 27.3
Cárdenas et al., 1980 1 11.9 9.9 − 29.7 8.6 − 13.5 29.4 − 55.6
Lefas et al., 1990 1 − 2 3 5 − 7 2.5 − 7.4 45.5 − 53.8
Hidalgo et al., 2002 (2) 0.35 − 1.0 6 − 12.7 1.7 − 4.0 1.5 − 11.4 8.7 − 22.1
Flores et al., 2007; Sánchez, 2010 0.5 − 2 (4) 7.9 − 22.8 0.7 − 13.5 1.5 − 6.4 4.5 − 37.2 (4.5 −
9.8)(1) Gulec and Whittaker, 2011 (3) 0.35 − 0.7 4.5 − 9.0 3.6 − 10.8 1.7 − 10.1 16.6 − 54.4
This study 1 5.1 − 15.8 0.4 − 3.6 0.8 − 4.3 3.8 − 10.1
(1) Non-prismatic boundary elements, (2) Tested in double curvature (rotation at wall top end was restrained),
(3) Having and no having non-prismatic boundary elements, (4) Walls having characteristics similar
to those used in this study.
Table 3: Comparison of reinforcement characteristics in similar studies.
Rotation at wall top end
When walls are tested using a cantilever load setup, free rotation at wall top end is allowed, and therefore, web vertical reinforcement can contribute freely to wall strength. Conversely, rotation at wall top end is significantly reduced due to the effect of coupling between wall and slab (diaphragm effect) in the housing prototype. Cantilever load test can be easily carried out and thus it is the most used test setup. However, the test setup that provides the suitable representation of the actual wall behavior should be established based on the study of rotational restrains caused by the structural system that surrounds the wall (Hidalgo et al., 2002). Although this testing procedure is ideal, its implementation in the lab is complex.
A practical and hybrid approach was implemented in this study. It involves both testing of wall using a cantilever load setup and modifying of measured results based on wall ends rotation at the prototype. Modification of strains measured in vertical steel reinforcement is based on two effects such as gathering of longitudinal reinforcement at boundary elements and rotation at top wall end. This procedure is described in the following section.
Strain modification
It is considered that gathering of longitudinal reinforcement at boundary elements and rotation at top wall end does not modify the strains of the web horizontal reinforcement. Strains measured at vertical reinforcement located in the web and in the boundary elements, ε’, were modified as:
Tm
F
×
=
ε
'
ε
where:
Rm Km
Tm
F
F
F
=
×
where FKm and FRm are modification factors due to the gathering of longitudinal reinforcement at
boundary elements and due to the rotation at top wall end, respectively. Factor FKm was estimated
Latin American Journal of Solids and Structures 11 (2014) 1791-1805
web vertical reinforcement increases. Factor FRm considers that strain of web vertical reinforcement
increases gradually with the rotation at wall top end. Therefore, to modify or extrapolate data of strain of vertical reinforcement to actual behavior of the prototype, FKm and FRm were calculated as:
me mp Km
K
K
F
=
;me mp Rm
R
R
F
=
(5)where Kmp is related to the prototype and is computed similarly to Kme (Eqn. 2) but using the
layout of wall reinforcement in the prototype house. For instance, for walls having web shear reinforcement made of welded wire mesh (ρh = ρv = 50%ρmin), Asb ≈ 4 deformed bars of 9.5-mm
diameter (3/8 in.), and for walls having deformed bars (ρh = ρv = ρmin), Asb≈ 4 deformed bars of
12.7-mm diameter (1/2 in.).
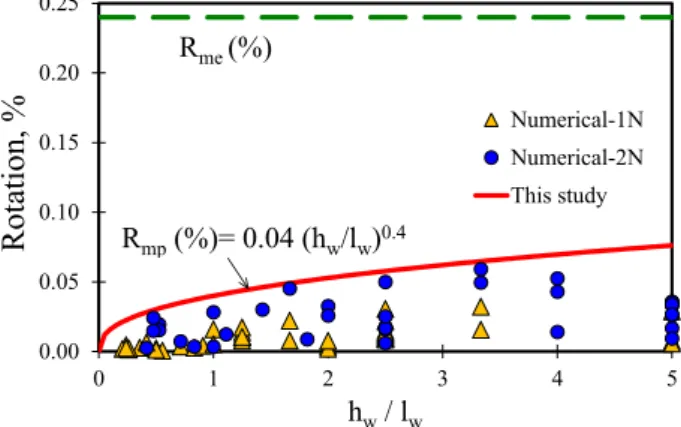
Parameters Rme and Rmp in Eqn. 5 characterize the rotation measured at top end of wall tested
in cantilever and that of wall in the prototype house, respectively, at peak shear strength. Results of numerical models of eight single-story (1N) and two-story (2N) house prototypes located in different seismic hazard zones where used to estimate Rmp. In order to include the critical scenario, data of
houses located in high seismic zones were used only. Fig. 2 shows not only the numerical results, but also the curve and the equation that characterize both the trend and the envelope of data. The equation to estimate Rmp was derived from observed trend and nonlinear regression analysis, and it
is limited to walls having hw/lw < 4.
Figure 2: Rotation of tested walls and walls in the prototype.
For walls of this study, FKm > 1 because Kmp > Kme and, therefore, FKm will increase the strains of
vertical reinforcement. Conversely, in the prototype FRm < 1 because Rmp < Rme and, therefore, FRm will reduce the strains of vertical reinforcement.
According to Eqn. 5, the modification factors FKm and FRm are based on a linear elastic approach.
Since longitudinal boundary reinforcement exhibited elastic behavior during all testing stages (Carrillo et al., 2014), it is considered that factor FKm is suitable. To estimate thoroughly factor FRm, it would be necessary to include redistribution of stresses and strains due to inelasticity of wall
materials (steel and concrete), mainly for vertical web reinforcement at yielding. To diminish uncertainties related to this effect, FRm included procedures that allow estimating in a practical and
conservative way, strains of reinforcement in the prototype. For instance, Rmp was calculated using 0.00
0.05 0.10 0.15 0.20 0.25
0 1 2 3 4 5
R
otat
ion,
%
hw/ lw
Numerical-1N Numerical-2N
This study
Rmp(%)= 0.04 (hw/lw)0.4
Latin American Journal of Solids and Structures 11 (2014) 1791-1805
the equation that characterizes the envelope of the numerical data (Fig. 2), and therefore, strains of vertical reinforcement are safely computed with factor FRm. In addition, in all the cases shown in
Fig. 3, the linear elastic approach of FRm is associated to strains in prototype, ε, that are higher or
equal than strains computed when including inelasticity of materials, εi.
f
ε
f '
ε'
εi εsh Modification
method
f
f '
ε' Strain
εi = ε
Modification method
ε
=
ε
iε >
ε
iStress
Strain f
ε ε'
εi
f '
εsh Modification
method
ε >
ε
iStress Stress
Strain
Figure 3: Method to estimate steel strains.
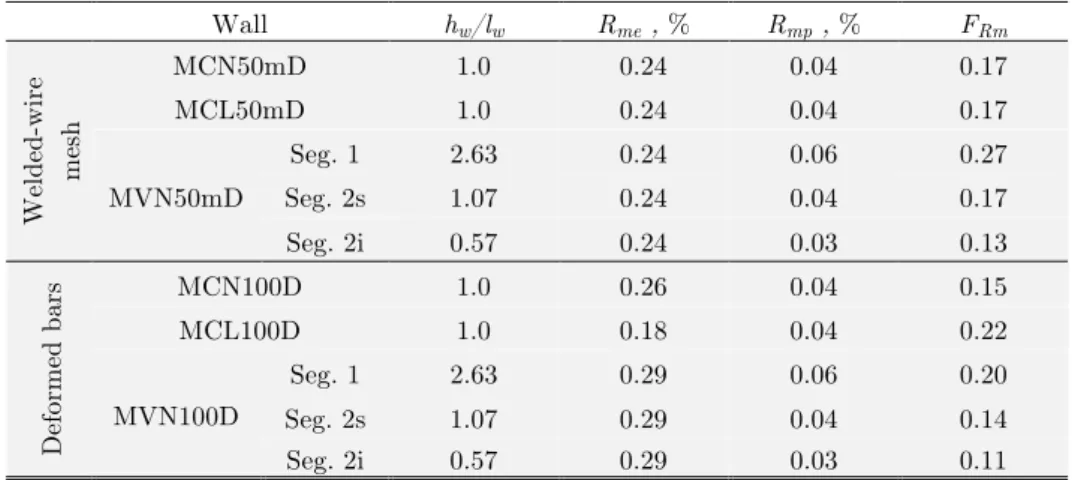
Factors to modify strains of vertical reinforcement for each wall are indicated in Tables 4 and 5. Factors for the three segments of walls having openings are shown in tables: (i) wall segment located at the East side of the door (Seg. 1), (ii) wall segment located between door and window (Seg. 2s), and (iii) wall segment located below the window (Seg. 2i) (Fig. 1).
Wall hw/lw Kme , % Kmp , % FKm
We ld ed -wi re me sh
MCN50mD 1.0 5.3 25.0 4.7
MCL50mD 1.0 5.3 25.0 4.7
MVN50mD
Seg. 1 2.63 3.8 7.9 2.1
Seg. 2s 1.07 3.8 11.9 3.2
Seg. 2i 0.57 3.8 22.3 5.9
De
fo
rm
ed
ba
rs MCN100D 1.0 10.1 30.9 3.1
MCL100D 1.0 10.1 30.9 3.1
MVN100D
Seg. 1 2.63 6.5 8.6 1.3
Seg. 2s 1.07 6.5 14.1 2.2
Seg. 2i 0.57 6.5 27.6 4.2
Table 4: Modification factor due to gathering of longitudinal reinforcement at boundary elements.
Wall hw/lw Rme , % Rmp , % FRm
We ld ed -wi re me sh
MCN50mD 1.0 0.24 0.04 0.17
MCL50mD 1.0 0.24 0.04 0.17
MVN50mD
Seg. 1 2.63 0.24 0.06 0.27
Seg. 2s 1.07 0.24 0.04 0.17
Seg. 2i 0.57 0.24 0.03 0.13
De fo rm ed b ar
s MCN100D 1.0 0.26 0.04 0.15
MCL100D 1.0 0.18 0.04 0.22
MVN100D
Seg. 1 2.63 0.29 0.06 0.20
Seg. 2s 1.07 0.29 0.04 0.14
Seg. 2i 0.57 0.29 0.03 0.11
Latin American Journal of Solids and Structures 11 (2014) 1791-1805
Table 6 shows strains measured in wall reinforcement and strains extrapolated to the prototype house. Strains in the table are associated to wall peak shear strength. For design purposes, ratio between mean steel strain measured at wall peak shear strength and yield strain measured from coupon tests (ε/εy ≤ 1.0) are included in the table. This factor is introduced as an efficiency factor to reflect the amount of wall reinforcement at yielding. Figs. 4 and 5 show strains measured (“Original” and “Modified”) in web vertical reinforcement and in boundary longitudinal reinforcement, respectively. A linear regression analysis of data extrapolated to the prototype is also shown in Figs. 4 and 5.
Wall FTm
ε / εy
ε’b (1) ε’v (1) εb (2) εv (2) εh (1)
We
ld
ed
-wi
re
m
es
h MCN50mD 0.80 0.48 0.48 0.38 0.39 0.71
MCL50mD 0.80 0.48 0.60 0.36 0.48 0.88
MVN50mD
Seg. 1 0.51 0.45 0.31 0.23 0.15 0.75
Seg. 2s 0.53 0.39 0.31 0.21 0.17 0.71
Seg. 2i 0.78 0.42 0.40 0.32 0.31 0.82
Mean 0.30 0.30 0.78
Coefficient of variation, % 23.4 41.6 8.5
De
fo
rm
ed
b
ar
s
MCN100D 0.47 0.37 0.74 0.17 0.35 0.88
MCL100D 0.68 0.30 0.70 0.20 0.47 0.79
MVN100D
Seg. 1 0.27 0.45 0.64 0.12 0.17 0.79
Seg. 2s 0.31 0.39 0.74 0.12 0.23 1.00
Seg. 2i 0.46 0.51 0.67 0.24 0.31 0.86
Mean 0.17 0.30 0.86
Coefficient of variation, % 26.8 34.2 8.9
(1) Using the strain measured in wall tested in cantilever, (2) Including the two modification factors.
Table 6: Strains of steel reinforcement.
Figure 4: Strains measured in the web vertical reinforcement: (a) walls having welded wire mesh, (b) walls having deformed bars.
0.0 0.2 0.4 0.6 0.8 1.0
0.0 0.5 1.0 1.5 2.0 2.5 3.0
ε
/
ε
yh
w/ l
wOriginal Modified Trend
(a)
0.0 0.2 0.4 0.6 0.8 1.0
0.0 0.5 1.0 1.5 2.0 2.5 3.0
ε
/
ε
yLatin American Journal of Solids and Structures 11 (2014) 1791-1805
Figure 5: Strains measured in the longitudinal boundary reinforcement: (a) walls having welded wire mesh, (b) walls having deformed bars.
3.2 Efficiency factors of wall reinforcement
Figures 6a and 6b show the efficiency factors for wall reinforcement (web and boundary reinforcement), that is, figures show data indicated in Table 6. Ratio between vertical and horizontal reinforcement in the web is shown in Fig. 6c. Linear regression analysis of data is also shown in the figures.
It is readily apparent from Figs. 6a and 6b that web steel contribution to wall shear strength was fundamentally associated with the horizontal reinforcement. It is noted that contribution of web horizontal reinforcement to wall shear strength mainly depends on the type and amount of web reinforcement, and is independent of hw/lw. For instance, the efficiency factor of horizontal web
reinforcement, measured in walls reinforced with deformed bars and the minimum code-prescribed steel ratio, was 86%. The efficiency factor measured in walls using welded-wire mesh and half of the minimum specified by ACI 318-11 was 78% (Carrillo et al., 2014). Although results of walls having four values of hw/lw are included in estimate of contribution of web horizontal reinforcement,
coefficients of variation are low; i.e., 8.5% and 8.9% for walls having welded-wire mesh and deformed bars, respectively.
Regarding the mean value of the efficiency factor, it is noted that yielding of all web horizontal reinforcement was never measured; therefore, the efficiency factor was always smaller than 1.0. In ACI 318, it is implicitly assumed that the efficiency factor of horizontal wall reinforcement is constant and equal to 1.0 at all amounts of reinforcement, and all ranges of wall aspect ratios. In summary, it is assumed in ACI 318 that all web reinforcement will attain yield at wall shear strength. Results confirm the assumption of ACI 318-11 with regard to the lack of dependency of the contribution of horizontal web reinforcement on hw/lw. However, measured results contrast with
the postulation of ACI 318-11 about the contribution being independent of the type of web reinforcement % (Carrillo et al., 2014).
0.0 0.2 0.4 0.6 0.8 1.0
0.0 0.5 1.0 1.5 2.0 2.5 3.0
ε
/
ε
yh
w/ l
wOriginal Modified Trend
(a)
0.0 0.2 0.4 0.6 0.8 1.0
0.0 0.5 1.0 1.5 2.0 2.5 3.0
ε
/
ε
yLatin American Journal of Solids and Structures 11 (2014) 1791-1805
Figure 6: Strains of wall steel reinforcement: (a) welded wire mesh (ρh =ρv = 0.5ρmin),
(b) deformed bars (ρh = ρv = 0.5ρmin, (c) ratio εv/εh of web reinforcement.
Strains measured in the web vertical reinforcement were mainly associated with the uniform distribution of inclined cracks. As reported by Benjamin and Williams (1957) and Barda et al.
(1977), the contribution to wall strength (that is, its efficiency) depends on hw/lw. For example, as
the hw/lw ratio diminishes, strain of the web vertical reinforcement increases because the angle of
inclination of cracks becomes flatter (that is, cracks exhibit a smaller inclination). Thus, as the angle between vertical bars/wires and inclined cracks is closer to 90°, vertical web reinforcement is more effective for producing a distributed crack pattern and for reducing crack widths. In this way, as specified by ACI 318-11, a minimum vertical web reinforcement ratio should be placed and should depend on the horizontal web steel ratio and hw/lw. As shown in Fig. 6c, the contribution of
web vertical reinforcement to strength does not appear to depend on the type of web reinforcement used in the testing program.
Strains in the longitudinal boundary reinforcement were within the elastic range of behavior. Strains were mostly associated with flexural demands. The small magnitude of strains is consistent with the design criterion by which specimens tested were purposely dimensioned and detailed to attain a shear failure, as that observed in RC walls for low-rise housing.
0.0 0.2 0.4 0.6 0.8 1.0
0.0 0.5 1.0 1.5 2.0 2.5 3.0
ε
/
ε
yh
w/ l
wHorizontal Vertical Longitudinal
(a)
0.0 0.2 0.4 0.6 0.8 1.0
0.00 0.50 1.00 1.50 2.00 2.50 3.00
ε
/
ε
yh
w/ l
wHorizontal Vertical Longitudinal
(b)
0.0 0.2 0.4 0.6 0.8 1.0
0.0 0.5 1.0 1.5 2.0 2.5 3.0
ε
v/
ε
hh
w/ l
wWelded-wire mesh
Deformed bars
Latin American Journal of Solids and Structures 11 (2014) 1791-1805
3.3 Contribution of web horizontal reinforcement to wall shear strength
Although welded-wire mesh was used for walls reinforced with 50% of the minimum code-prescribed web steel reinforcement ratio, and deformed bars were used for walls reinforced with minimum web steel ratio, the contribution of web horizontal reinforcement to wall peak shear strength can be roughly computed. Table 7 shows the values of the ratio between maximum shear stress (τmax) of
wall having minimum web steel ratio and that of wall having 50% of the minimum code-prescribed web steel ratio (τ1.0 / τ0.5). Since each pair of walls was built using the same concrete (type and age),
it was not necessary to normalize the stress before comparison.
Wall geometry
τmax, MPa
τ1.0 / τ0.5 ρh = ∼100% ρmin
(0.28 %)
ρh = ∼50% ρmin
(0.11 %)
τ1.0 ∼ 50, τ0.5
Squat, N 1.70 1.47 1.16
Squat, L 1.60 1.53 1.04
Openings, N 1.75 1.44 1.22
Mean 1.14
Coefficient of variation, % 6.3
N = normalweight concrete; L = lightweight concrete.
Table 7: Strain of steel reinforcement.
It is readily apparent in Table 7 that peak shear strength of walls τ1.0 was comparable to that of
walls τ0.5. When web horizontal reinforcement was increased by a factor of 2.5 (from 0.11% to
0.28%), the increment of peak shear strength was 14% on average. When similar specimens have been tested under quasi-static cyclic loading (Flores et al., 2007; Sánchez, 2010), comparable results have been observed. Therefore, for low-rise concrete housing built on low and medium hazard seismic zones, it seems viable to reduce the minimum web steel reinforcement ratio. It is noteworthy to mention that values of τ1.0 and τ0.5 are not directly comparable, because number of cycles
(low-cycle fatigue) and cumulative parameters of story drift and energy dissipated at peak shear strength are different between tested walls (Carrillo and Alcocer, 2013).
3.4 Effect f type of web reinforcement to wall displacement
Results measured during quasi-static tests of similar walls (Flores et al., 2007; Sánchez, 2010) have demonstrated that web steel reinforcement ratio does not affect noticeably wall displacement. Therefore, it is possible to compute and compare the effect of type of web reinforcement to displacement measured in walls of this study. Table 8 shows the values of the ratio between drift at ultimate limit state (Ru) of wall having web shear reinforcement made of deformed bars and that of
wall having welded-wire mesh (Ru-bar/Ru-wire). In this study, ultimate limit state is associated to one
Latin American Journal of Solids and Structures 11 (2014) 1791-1805
reinforced with deformed bars; the second scenario was observed in walls having web shear reinforcement made of welded-wire meshes.
It is noted in Table 8 that drift at ultimate limit state of walls having web reinforcement made of deformed bars was 34%, on average, higher than that of walls having welded-wire mesh. Hysteresis curves of walls having web shear reinforcement made of deformed bars evidenced a response more ductile and drift demands considerably higher than those of walls having welded-wire mesh (Carrillo and Alcocer, 2012). However, strength degradation of walls having deformed bars began as soon as the peak shear strength was reached; indeed, peak shear strength significantly dropped at drift demands slightly larger than 0.5%.
Wall geometry Drift at ultimate limit state, Ru, % Ru-bar/Ru-wire Ru-bar Ru-wire
Squat, N 0.58 0.54 1.06
Squat, L 0.73 0.65 1.12
Openings, N 0.82 0.44 1.85
Mean 1.34
Coefficient of variation, % 26.9
N = normalweight concrete; L = lightweight concrete.
Table 8: Effect of type of web reinforcement to wall displacement.
Under quasi-static cyclic loading, peak shear strength of walls having welded-wire mesh was similar to that of walls having deformed bars and the same web steel ratios (Flores et al., 2007). However, drift demands of walls having welded-wire mesh were lower than those of walls having deformed bars.
4 CONCLUSIONS
When comparing reinforcement area of walls used in this study with that of walls found in a literature review, significant differences were observed in terms of the ratio between the axial stiffness of web vertical reinforcement and the axial stiffness of the total vertical reinforcement at the wall cross section. Therefore, experimental results found in the literature cannot be directly generalized to all types of structures; they need be adapted to the characteristics of the particular prototype.
Latin American Journal of Solids and Structures 11 (2014) 1791-1805
reinforcement was based on two effects such as gathering of longitudinal reinforcement at boundary elements and rotation at top wall end.
Results of this study demonstrate that web steel contribution to wall shear strength was fundamentally associated with the horizontal reinforcement. Strains measured in the web vertical reinforcement were mainly associated with the uniform distribution of inclined cracks.
It was observed that when web horizontal reinforcement was increased by a factor of 2.5 (from 0.11% to 0.28%), the increment of peak shear strength was 14% on average. When similar specimens have been tested under quasi-static cyclic loading, comparable results have been observed. When assessing the effect of type of web reinforcement to wall displacement, it was evident that drift at ultimate limit state of walls having web reinforcement made of deformed bars was 34% higher, on average, than that of walls having welded-wire mesh. Hysteresis curves of walls having web shear reinforcement made of deformed bars evidenced a response more ductile and drift demands higher than those of walls having welded-wire mesh. It can be concluded that welded-wire mesh should be limited to be used in concrete housing where the displacement demands are not a main concern during the design process.
Acknowledgments
The first author expresses his gratitude to the Research Office (Vicerrectoría de Investigaciones) at Universidad Militar Nueva Granada (UMNG, Colombia) for granting academic and research scholarships at UNAM, and for financing the research project IMP-ING-1574.
References
ACI Committee 318 (2011). Building code requirements for structural concrete and commentary (ACI 318-11). American Concrete Institute, Farmington Hills, MI.
Barda, F., Hanson, J. and Corley, W. (1977). Shear strength of low-rise walls with boundary elements. Reinforced Concrete Structures in Seismic Zones, Publication SP-53-8, American Concrete Institute, 149-202.
Benjamin, J. and Williams, H. (1957). The behavior of one-story reinforced concrete shear walls. Journal of Structural Division − ASCE 83(ST3):1-49.
Cárdenas, A., Russell, H. and Corley, W. (1980). Strength of low-rise structural walls. Reinforced Concrete Structures Subjected to Wind and Earthquake Forces, Publication SP-63-10, American Concrete Institute, 221-241. Carrillo, J. and Alcocer, S. (2013). Experimental investigation on dynamic and quasi-static behavior of low-rise reinforced concrete walls. Journal of Earthquake Engineering and Structural Dynamics 42:635-652.
Carrillo, J. and Alcocer, S. (2012) Seismic performance of concrete walls for housing subjected to shaking table excitations. Journal of Engineering Structures, 41:98-107.
Carrillo, J., Sánchez, M. and Viviescas, A. (2014). Strains of steel reinforcement during shake table tests of low-rise concrete walls. Journal of Ingeniería e Investigación, 34(1):36-41.
Flores, L., Alcocer, S., Carrillo, J., Sánchez, A., Uribe, R. and Ponce, A. (2007). Testing of concrete walls with different aspect ratios and small reinforcement ratios for housing. Proceedings of 17th National Conference on Earthquake Engineering, Guerrero, Mexico, topic XI, paper 2.
Gulec, C. and Whittaker, A. (2011). Empirical equations for peak shear strength of low aspect ratio reinforced concrete walls. ACI Structural Journal, 108(1):80-879.
Latin American Journal of Solids and Structures 11 (2014) 1791-1805 Lefas, L., Kotsovos, M. and Ambraseys, N. (1990). Behavior of reinforced concrete structural walls: strength, deformation characteristics and failure mechanism. ACI Structural Journal, 87(1):23-31.
NSR-10 (2010). Colombian Code for earthquake-resistant construction. Colombian Association of Earthquake Engineering, AIS, Colombia.
![Figure 1: Geometry of wall specimens: (a) h w ⁄ l w = 1, (b) having openings [dimension in mm]](https://thumb-eu.123doks.com/thumbv2/123dok_br/18885154.423651/2.807.139.712.639.876/figure-geometry-wall-specimens-having-openings-dimension-mm.webp)