Genetic parameters and selection strategies for soybean genotypes
resistant to the stink bug-complex
Cláudio Roberto Cardoso de Godoi
1and José Baldin Pinheiro
21
Nidera Sementes Ltda., Soybean Program Research, Rio Verde, Goiás, Brazil.
2
Departamento de Genética, Escola Superior de Agricultura “Luiz de Queiroz”,
Universidade de São Paulo, Piracicaba, SP, Brazil.
Abstract
Soybean genotypes resistant to stink bugs are derived from complex breeding processes obtained through indirect selection. The aim of the present work was to estimate genetic parameters for guiding selection strategies towards resistant genotypes, based on those traits associated with responses to pod-attacking stink bugs, such as the grain filling period (GFP), leaf retention (LR), percentage index of pod damage (PIPD) and percentage of spotted seeds (PSS). We assessed the parental lines IAC-100 (resistant) and FT-Estrela (susceptible), the progenies F2and F4, 30
progenies F2:3, 30 progenies BC1F2:3and 30 progenies BC2F2:3, besides the cultivars BRS Celeste and MGBR-46
(Conquista). Three field experiments, using randomized complete block design with three replications, were installed in Goiânia-GO, in the 2002/03 season. Each experiment consisted of 36 treatments (6 common and 30 regular). Heritability estimates were: 74.6 and 36.1 (GFP); 51.9 and 19.9 (LR); 49.6 and 49.6 (PIPD) and 55.8 and 20.3 (PSS), in both the broad and narrow senses, respectively. Based on these results, we concluded that the best strategy for obtaining stink bug-resistant genotypes consists of selecting the PIPD trait in early generations (F3or F4), followed by
selection for the GFP, LR and PSS traits in generations with higher endogamy levels.
Key words: Glycine max, insect resistance, stink bugs, heritability.
Received: June 13, 2008; Accepted: November 24, 2008.
Introduction
Stink bugs are considered to be the most important pests attacking soybean. The group of species that most fre-quently causes economic losses is called the “stink bug complex”, composed of three species: Nezara viridula, Piezodorus guildinii and Euchistus heros. Through their piercing-sucking feeding habits, these insects cause dam-age mainly during pod formation, filling and maturation (Gazzoni, 1998; Lourençãoet al.2002).
The selection of genotypes resistant to chewing and sucking-insects has been basically carried out among lines in populations consisting of F3to F5generations. Genotype
evaluation is done by scoring the plants at the reproductive stage, according to defoliation scales for chewing insects, and/or leaf retention scores associated to the presence of empty pods on the upper third of the plants at the matura-tion stage for sucking insects, such as the stink bugs (Lou-rençãoet al., 2002). Resistant genotypes have also been obtained through indirect selection of those with shorter grain-filling periods, lower percentage of spotted seeds, lower hundred - seeds weight and lower indexes of pod
damage (Godoi et al., 2002; Moura and Pinheiro, 2002; Pinheiroet al., 2005).
Indirect selection has also been widely used to obtain insect-resistant soybean genotypes, with satisfying results as to selection gains, pre-breeding lines and cultivars, nota-bly the cultivar IAC-100, an example of resistance to sev-eral insect species preying on soybean crops (Souza and Toledo, 1995; Rossettoet al., 1995; Pinheiroet al., 2005). In general, the phenotypic traits employed in indirect selec-tion of those genotypes resistant to defoliaselec-tion and sucking insects in soybeans have been reduced defoliation levels, a shorter pod-filling period, lower indices of pod damage, lower weight of a hundred seeds and lower levels of seed damage (Mirandaet al., 1979; Rossettoet al., 1986; Souza and Toledo, 1995; Godoiet al., 2002; Moura and Pinheiro, 2002; Mouraet al., 2003; Pinheiroet al., 2005). According to Rossettoet al.(1995), these traits represent resistance mechanisms against stink bugs in soybeans. The authors list certain mechanisms resorted to in soybeans against stink bug attacks, as for example, a shorter pod-filling pe-riod, a higher seed-yield per plant, the capacity to reject damaged immature pods and their substitution by new pods, besides normal senescence with leaf dropping at the maturation stage and resistance to the yeastNematospora corylitransmitted by stink bugs.
Copyright © 2009, Sociedade Brasileira de Genética. Printed in Brazil www.sbg.org.br
Send correspondence to José Baldin Pinheiro. Departamento de Genética, Escola Superior de Agricultura “Luiz de Queiroz”, Univer-sidade de São Paulo, Caixa Postal 83, 13400-970 Piracicaba, SP, Brazil. E-mail: [email protected].
The study of those genetic mechanisms associated to stink bug resistance in soybeans reveals that, although the traits involved are subject to complex genetic control, it is possible to obtain superior descendants from crosses be-tween susceptible and resistant genotypes. Thus, soybean breeding aiming at reducing stink bug vulnerability is a promising field for research, since selection in segregated populations has permitted obtaining gains in this area (Sou-za and Toledo, 1995). However, it is noteworthy that traits related to insect resistance are quantitative and should be allied to yield, another quantitative trait, though of low heritability, thereby making it difficult to obtain resistant and, at the same time, high-yield genotypes.
Although resistant lines and cultivars can be success-fully obtained, only few studies have been carried out with the purpose of revealing the genetic mechanisms underly-ing these traits and the genetic parameters associated thereto. According to Vencovsky and Barriga (1992), ge-netic studies in breeding programs are important, through disclosing the genetic basis and inheritance of a given trait under selection, thereby giving rise to the choice of the most adequate methods for managing segregating popula-tions in order to obtain better results and for determining the most adequate stage for undertaking selection, with a view to higher gains. The availability of this information can significantly contribute to improving breeding pro-grams. Thus, the purpose manifest in the present work was to estimate genetic parameters associated to resistance against sucking stink bugs in soybean pods, in order to in-vestigate genetic control and indicate selection strategies for obtaining resistant genotypes based on these traits.
Material and Methods
The parent lines FT-Estrela and IAC-100 constituted the plant material used in this study. The cultivar FT-Estrela, used as the stink bug susceptible parent, is derived from a cross between the M2 and FT-1 lines. The cultivar IAC-100 is derived from the cross between IAC 78-2318 and IAC-12 (Rossettoet al., 1995), the IAC 78-2318 line being a source of multiple-resistance genes against soy-bean-attacking insects (Lourençãoet al., 1987). The IAC-100 cultivar has been previously employed in several re-search studies as the standard genotype for insect resis-tance, both in Brazil (Pinheiro et al., 2005) and abroad (McPhersonet al., 2007 and McPherson and Buss, 2007). The bi-parental cross and respective backcrosses were ob-tained from these cultivars. Subsequently, the following segregating generations were obtained: a) generation F2
and F4from bi-parental combination; b) 30 F2:3generation
progenies from the bi-parental cross; c) 30 progenies from the second generation of respective inbred backcrosses, de-nominated BC1F2:3and BC2F2:3. The cultivars BRS Celeste
and MGBR-46 (Conquista) were used alongside the afore mentioned crosses. The experimental plot was installed on December 19th, 2002, in an experimental field at the Escola
de Agronomia e Engenharia de Alimentos da Universidade Federal de Goiás (16° 36’S latitude, 49° 17’W longitude and 730 m above sea-level), in Goiânia, Goiás. The experi-mental field was open to natural stink bug infestation through the absence of insect chemical control. In order to increase natural crop infestation by insect migration at the final maturation or initial harvesting stages, crops were sown lately. Evaluation of stink bug infestation was carried out between the R3 and R8 stages (Fehr and Caviness,
1977), by the beating-tissue method with random sampling of the experimental area at ten day intervals (Gazzoni, 1998).
In order to evaluate the highest possible number of progenies, three experiments were installed using the ran-dom complete-block design, this consisting of 36 treat-ments (thirty regular and six common) with three replica-tions. Thirty F2:3and thirty progenies from each backcross
(BC1F2:3 and BC2F2:3) were evaluated, these constituting
the regular treatments. Common treatments were repre-sented by sampling from F2and F4generations, the parent
lines and the BRS Celeste and MGBR-46 (Conquista) cul-tivars. The plot consisted of one-meter lines, 0.5 m apart, with twelve plants apiece. Evaluation of the traits was un-dertaken in five plants per plot. The evaluated traits were: a) Grain filling period (GFP) - obtained by the difference in days between reproductive stages R7 and R5 (Fehr and
Caviness, 1977) in the crop (Pinheiroet al., 2005); b) Leaf retention (LR) - evaluated in the field by means of a scale ranging from 1 to 5, where 1 is equal to normal senescence and 5, stems and green leaves (unfeasible harvest) (Godoi
et al., 2002); c) Percentage index of pod damage (PIPD) -obtained from quantification of plant pods, as to quality, in good, intermediate or flat conditions, followed by transfor-mation using the formula PIPD = (% intermediate pods) + % flat pods (Rossettoet al., 1986); d) Percentage of spotted seeds (PSS) - visual evaluation where values ranging from 0 to 100% are attributed to the seeds according to damage caused by insects or colonization by yeast (Nematospora coryli Peglion). Statistical analysis of the data for the groups of experiments consisted basically of the individual analysis of variance for each experiment in random blocks, followed by grouped analysis of all experiments (Pimentel Gomes, 1990; Cruz and Carneiro, 2003).
Genetic analysis of the means components
precision among the different populations or families in-vestigated (Mather and Jinks, 1984).
Genetic models were adjusted to means of the parent lines IAC-100 and FT-Estrela and their segregating genera-tions F2and F4(as bulk), and F3and the respective
back-crosses in the second generation of inbreeding (BC1F2:3and
BC2F2:3), for those traits under investigation. Initially, it
was predicted to use a simple genetic model of the domi-nant-additive type, involving the components m, [a] and [d], where, m is the average value between parents, [a] rep-resents the algebraic sum of the additive effects of all dis-tinct loci between the parents, and [d] represents the alge-braic sum of dominance effects of all distinct loci between the parents. If the proposed model proves to be unsatisfac-tory for explaining genetic mechanisms controlling the traits being investigated, an alternative model may be used, this including non-allelic interaction parameters between pairs of loci, with the addition of components [aa], [ad] and [dd]. The additional components represent the epistatic interaction between homozygous loci from the additive x additive type, the epistatic interaction of the additive x dominant type and the epistatic interaction between hetero-zygous loci or of the dominant x dominant type, respec-tively. The proportion among the components m, [a], [d], [aa], [ad] and [dd], present in the evaluated generations, is shown in detail in Table S1.
Application of the joint-scale method is as described by Mather and Jinks (1984). Biometric analyses were per-formed using PROC IML proceeding from SAS (Sas Insti-tute, 1998) software.
Genetic analysis of the variance components
The study of the variances was performed admitting the absence of non-allelic and gene-linkage interactions. Therefore, it was considered that the total genetic variance
(sGT2
) consists of additive (sA2
) and dominant (sD2
) genetic components, where the ratio between them in successive inbred generations from a bi-parental cross follows a pre-cise model dependent on the degree of endogamy (F). Thus, those components associated tosGT2
were obtained by the expressionsGT2 FsA2 FsD2
1 1
=( + ) +( - ) . Total genetic vari-ance consists of genetic varivari-ance among (sGe2
) and within
(sGd2
) progenies. Genetic variance among progenies (sGe2
) is obtained bysGe2 Fn sA2 Fn Fn sD2
2 1
=( ) + ( - ) , whereas this variance between progenies (sGd2
) is calculated by
sGd2 Fn sA2 Fn sD2
1 1
=( - ) +( - ) , where Fnis the endogamy
coefficient for generation n (Vencovsky and Barriga, 1992). For backcrosses, expected variances between proge-nies from the second successive inbreeding used in this work correspond to:
sGe(RC F ) sA sD
1 2:3
2 2 3 2
16 1 8
= + +
å
for BC1and
sGe(RC F ) sA sD
2 2:3
2 2 3 2
16 1 8
= + -
å
for BC2.The expected variances within progenies are equiva-lent between BC1and BC2, calculated by the expression:
sGe(RC F ) sGd(RC F ) sA sD
1 2:3 2 2:3
2 2 1 2 2
4 1 4
= + +
Those components associated to investigated genera-tions are summarized in Table S2.
Thus, an approximation of genetic variance to studied traits is represented by the sum of the components of the ad-ditive variance (sA2
) and variance due to dominant effects
(sD2
), albeit, with the absence of epistatic interaction ef-fects. Therefore, in the reference population F2, genetic
variance contains 1/2å(d2) + 1/4å(h2) which is equivalent to 1/2 D + 1/4 H. As an alternative and according to the no-tation proposed by Vencovsky and Barriga (1992) it is shown that:
sGF sA sD
2 a d
2 1 2 2 2 2
2
1 4
@
å
+å
@ +The use of the joint scale method has allowed us to obtain estimates of the parameters for the genetic model as-sociated to observed variances, also allowing the verifica-tion of the adjustment of the additive-dominant genetic model to observed variances. The routine used to calculate model estimates by the iterative process is detailed in Mather and Jinks (1984) and Toledo (1991). The vector of phenotypic variances for the generations was represented by the mean squares of joint analysis of variance, where the diagonal matrix N is represented by the respective degrees of freedom associated to the mean squares. This procedure was carried out with MAPGEN (Ferreira, 2004) statistics software. Subsequent to calculation of the estimates ofs$A2
,
$
sD2
,s$w2
ands$e2
, the heritability coefficients concerning ref-erence F2populations were calculated, in both broad and
narrow senses, by using the following expressions: Broad sense heritability (%):
$ $ $
$ $ $
hb
A D A D E 2
2 2
2 2 2 100
@ +
+ + ´
s s
s s s
Narrow sense heritability (%):
$ $
$ $ $
hn A
A D E 2
2
2 2 2 100
@
+ + ´
s
s s s
Results and Discussion
Genetic variability in the generations
within each group. This approach has allowed us to observe statistical differences among treatments for all investigated traits, thereby indicating the occurrence of genetic variabil-ity among genotypes. This result was expected, due to the presence of homozygous and segregating material in the treatments, and which showed a distinct response to the high level of stink bug infestation that occurred in the ex-perimental area, crucially contributing to the differentiation and expression of genetic variability of the genotypes in their resistance- response.
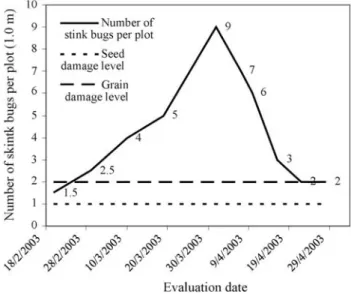
Stink bug infestation in the experimental plot during the most susceptible period, between reproductive stages R3and R8(Fehr and Caviness, 1977), was always superior
to the level normally accountable for economical losses in crops (Gazzoni, 1998), this reaching a maximum popula-tion equivalent to nine stink bugs per meter during stage R6
(Figure 1).
The results of joint-analysis of variance, with the re-spective values for mean squares associated to the source of variation, among and within treatment plots for resistance-associated traits GFP, LR, PIPD and PSS, are shown in Ta-ble 1. Furthermore, the partitioning of variation source
treatments into genetic groups of interest was also carried out, along with the calculation of their related contrasts.
Table 1- Summary of the joint analysis of variance, with the mean squares associated to variation among the means and within the plots, from their re-spective sources of variation, for traits associated to resistance against the stink bug complex (GFP, LR, PIPD and PSS)1in soybean.
SV GFP (days) LR (grade)2 PIPD (%)3 PSS (%)3
DF MSQ DF MSQ DF MSQ DF MSQ
Blocks/experiment 6 20.8561** 6 0.2711** 6 0.0197** 6 0.0875ns
Experiments (E) 2 3.7267ns 2 0.0028ns 2 0.0186** 2 0.0079ns E x Common treat. 10 6.8378ns 10 0.0911ns 10 0.0094ns 10 0.0579ns
Treatments/E 95 21.5287** 95 0.1698** 95 0.0128** 95 0.1657**
F2:3 29 15.4427** 29 0.1136* 29 0.0116** 29 0.0906*
BC1F2:3(BC1) 29 10.8686** 29 0.1744** 29 0.0130** 29 0.0581ns
BC2F2:3(BC2) 29 16.0359** 29 0.0846ns 29 0.0071ns 29 0.1292**
Common treat. 5 81.9804** 5 0.6643** 5 0.0392** 5 0.5799**
Groups 3 127.7741** 3 0.5291** 3 0.0316** 3 1.4923**
G1vs.G2 4
(1) 76.0556** (1) 0.8823** (1) 0.1352** (1) 1.4857** BC1vs.BC2 (1) 285.3848** (1) 0.6341** (1) 0.0658** (1) 2.1842**
Error among 209 5.0292 209 0.0686 207 0.0054 207 0.0510
Error within 1284 10.463 1286 0.1129 1249 0.0109 1246 0.0852
Within F2:3 (360) 12.534 (360) 0.1154 348 0.0104 348 0.0967
Within BC1 (357) 9.297 (357) 0.1232 351 0.0106 346 0.0831
Within BC2 (354) 10.326 (356) 0.1137 340 0.0105 340 0.0812
Within F2 (36) 13.944 (36) 0.1402 34 0.0164 36 0.1105
Within F4 (36) 20.622 (36) 0.1162 35 0.0161 36 0.0996
Within IL 141 4.99 141 0.0704 141 0.0110 140 0.0609
Means 29.23 1.73 0.53 0.89
CV(%) 7.67 15.15 13.96 25.29
* and **: significant at 5% and 1% of probability by the F Test, respectively;1GFP (grain filling period), RF (leaf retention), PIPD (percentage index of pod damage) and PSS (percentage of spotted seeds);2Raw data were transformed by x+0 5. ;3Raw data were transformed by arcsin x/100;4G1:
FT-Estrela and G2: IAC-100.
Figure 1- Fluctuation of the average stink bug population in the experi-ment during the period comprised between reproductive stages R3and R8
Thus, the magnitude of observed phenotypic variability, among and within each group studied, was demonstrated.
The parents FT-Estrela (G1) and IAC-100 (G2) dif-fered for all investigated traits (Table 1, contrast G1vsG2), demonstrating genetic variability between parent lines in those traits pertaining to stink bug complex resistance. This contributes to generating genetic variability in segregating populations, due to gene recombination in inbred popula-tions originating from crosses and backcrosses between ge-notypes. Concerning group decomposition, it was observed that there were statistically significant differences (p < 0.01) between F2:3progenies for GFP and PIPD. For
LR and PSS, these were statistically significant at 5%. There were no significant differences found in progenies regarding LR and PIPD traits in the BC1F2:3group. The
ab-sence of statistical significance in the F test between treat-ments in this group is an indication of little genetic variability among the genotypes for these traits. However, as to the remaining traits, statistically significant differ-ences were observed between progenies (Table 1). This be-havior was expected, since greater genetic variability is foreseen between progenies F2:3 that are derived from a
bi-parental cross where, in the F2 generation, all distinct
loci between parental lines segregate. In contrast, the high-est representation (75%) of a parental line in backcrosses induces lower levels of gene recombination in inbred gen-erations. Consequently, the sampled progenies from back-crosses show a tendency towards presenting smaller differences one from the other.
It can be observed that the smaller mean values for the traits GFP, LR, PSS and PIPD, among the common treat-ments, occurred for the genotype IAC-100 (Table 2). The different behavior between IAC-100 and the susceptible material may be attributed to genetic resistance of its geno-type (Rossettoet al., 1995), which, when exposed to high stink bug infestation (Figure 1), presented less damage than that to susceptible genotypes. Similar results in IAC-100 behavior were reported by Souza and Toledo (1995), Godoi
et al.(2002), Mouraet al.(2003), Pinheiroet al.(2005) and McPhersonet al.(2007).
Genetic analysis of the mean components
The means and the degrees of freedom observed for the generations FT-Estrela (G1), IAC-100 (G2), F2, F2:3,
BC1F2:3, BC2F2:3and F4are discriminated in Table 2. This
information was used to obtain the joint scale test, verifica-tion of adjustment between genetic models and estimaverifica-tion of those genetic components associated to the means of the generations for the investigated traits.
In the group of experiments, statistically significant differences (p < 0,01) were observed in the mean contrasts between the parental lines FT-Estrela (G1) and IAC-100 (G2) for all those traits associated to stink bug resistance (Table 1), thereby indicating that the parental lines used for the crosses studied contrast for the investigated traits. This divergence between parent-lines is important in the context of the study, since, on applying the methodology of genetic analysis of mean components through the joint-scale test, the presupposition is that the parent-lines are completely homozygous lines displaying contrasting behavior for the trait (Mather and Jinks, 1984).
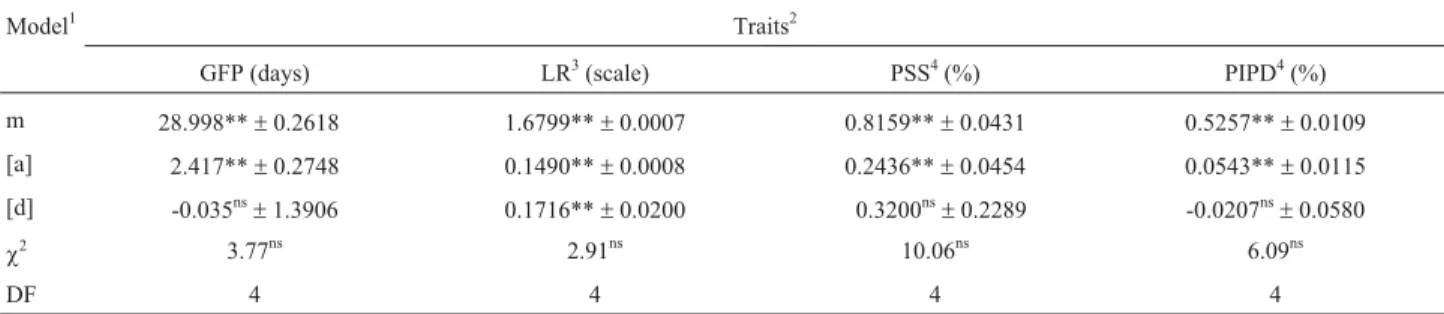
Genetic models adjusted to the generation means and their respective significance in the chi-square (c2) test, the estimates of parameters, their significance and the errors associated to the estimates, are detailed in Table 3.
The additive-dominant genetic model (for testing pa-rameters in relation to the mean value between parent lines (m), the sum of the additive effect of the genes [a] and the sum of the dominance effect among the alleles [d]) was ad-equate to explain the behavior of the means of those genera-tions used in the grouped scale test, assuming the probabil-ity of 5% for thec2
test for the traits GFP, LR, PIPD and PSS. Accumulatedc2
values were 3.8, 2.9, 6.1 and 10.1, re-spectively, on testing the additive-dominant model for these traits (Table 3).
Table 2- Joint-scale test information (Mather and Jinks, 1984) involving the parent lines FT-Estrela (G1) and IAC-100 (G2) and their segregating gener-ations F2, progenies F2:3, BC1F2:3, BC2F2:3and F4, for traits associated to resistance against the stink bug complex (GFP, LR, PIPD and PSS)1in soybean.
Generations GFP (days) LR (grade)2 PIPD (%)3 PSS (%)3
N4 Mean N Mean N Mean N Mean
FT-Estrela 9 30.689 9 1.930 9 0.605 9 1.203
IAC-100 9 26.578 9 1.488 9 0.431 9 0.629
F2 9 29.622 9 1.795 9 0.522 9 0.997
F2:3 90 28.724 90 1.716 90 0.517 90 0.909
BC1F2:3 90 30.407 90 1.758 89 0.545 89 0.9437
BC2F2:3 89 27.846 89 1.638 88 0.504 88 0.719
F4 9 29.089 9 1.632 9 0.541 9 0.991
1
Estimates of parameter [a], refering to the sum of gene additive effects, were positive and significant for the traits GFP, LR, PIPD and PSS, thus indicating that additive genetic effects condition the increase in traits. With the ex-ception of the trait LR, results indicate the absence of domi-nant effects among resistance traits against the investigated stink bugs (Table 3).
It has been observed that the estimates of parameter [d], which represents the sum of deviations caused by dom-inance among alleles, were significant exclusively for LR. Similar results were found by Souza and Toledo (1995), who observed significant heterosis, although towards the resistant parent line, in contrast to our observations. How-ever, the occurrence of null values in mean parameters, such as those found for the value of [d] in GFP, PIPD and PSS parameters (Table 3), does not mean the absence of the effect value, since this situation may be associated to gene dispersion in the parent lines, thereby leading to null effects in individual genes (Mather and Jinks, 1984).
In general, the heterosis effect occurs as a disturbing factor in selection processes, due to the difficulties it gives rise to in selecting really superior individuals at initial en-dogamy generation. Later, the effects of dominance are spread by the advance of inbred generations, as normally seen in soybean breeding programs. According to Pessoni
et al.(1997), when dominant gene effects are present ([d], [ad] or [dd]), selection in early generations may not be ade-quate, especially if this occurs towards the susceptible ge-notype, since it may lead to the elimination of resistant genotypes, or vice-versa. In this situation, the author rec-ommends the selection of traits with dominance effects in generations with higher levels of endogamy (from genera-tions F4or F5on).
Therefore, based on the genetic studies of the means from the afore-cited generations for GFP, PIPD and PSS traits, it is expected that genetic gains may be obtained by plant selection in early endogamy generations (F3or F4),
due exclusively to the importance of additive gene effects on the expression of these traits. In contrast, for the LR trait which shows significant dominance effects, selection must
be carried out in later generations with higher endogamy levels.
Genetic analysis of variance components and heritability
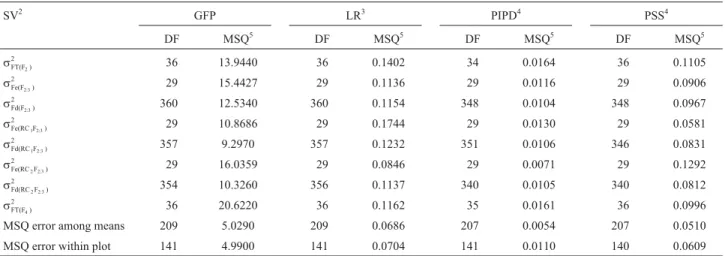
Detailed information used in the joint-scale test is de-scribed in Table 4. This information applied to calculate the estimates of genetic and environmental variances for the in-vestigated traits.
Phenotypic generation variances, represented by the mean squares of the sources of variation from joint-analysis of variation, are represented in Table 2. The mean squares of error among treatments and the mean squares within the pure lines were used to estimate the environmental varia-tion within treatments.
The joint scale test used in this study favors estimat-ing those genetic model parameters associated to observed variances. Moreover, it permits checking the adjustment of the additive-dominant genetic model to these (Toledo, 1991). The number of iterations that occur, on the conver-gence of parameter estimates to the adopted genetic model, corresponded to 11, 15, 11, 9, 14 and 10 to GFP, LR, PIPD and PSS, respectively (Table 5). The observed values rein-force information given by Mather and Jinks (1984), who suggest the use of a minimal number of 10 iterations, or al-ternatively, to execute them until values converge.
From the data on Table 5, it can be verified that the additive-dominant genetic model is sufficient to explain all genetic variability found in GFP, PIPD, PSS and LR traits, significant at 5% probability (p < 0.05). As with the results obtained in genetic analysis of the means, it was found that additive genetic variances (sA2
) which represent the sum of the squares of the additive effects (a’s) of those genes in-volved in trait expression, were more important for GFP and PIPD traits.
For the traits LR and PSS, dominance genetic varia-tions (sD2
) exhibited greater magnitudes than additive vari-ance (sD2
) (Table 5). However, it has been observed that the estimates of the dominance genetic variance (sD2
) are asso-ciated to the errors of high estimates for all traits. Spe-Table 3- Genetic models adjusted to the means of the FT-Estrela (G1) and IAC-100 (G2) parent lines and their segregating populations F2, F3:2, BC1F3:2,
BC2F3:2and F4.
Model1 Traits2
GFP (days) LR3(scale) PSS4(%) PIPD4(%)
m 28.998**±0.2618 1.6799**±0.0007 0.8159**±0.0431 0.5257**±0.0109
[a] 2.417**±0.2748 0.1490**±0.0008 0.2436**±0.0454 0.0543**±0.0115
[d] -0.035ns±1.3906 0.1716**±0.0200 0.3200ns±0.2289 -0.0207ns±0.0580
c2 3.77ns 2.91ns 10.06ns 6.09ns
DF 4 4 4 4
* and **: significant at 5% and 1% of probability by thetTest, respectively.1m = mean of homozygous lines derived from F2; [a] = estimate of the additive
cifically, in the case of PIPD and on estimating the parameter, the result was negative. Based on the observed results, it may be suggested that the negative value for the
sD2
effect is null, mainly since, through analysis of the mean, the result indicates the absence of dominance effects for this trait. According to Pessoniet al.(1997), negative estimates may occur if the variance component shows low magnitude. Additionally, estimates may arise due to inade-quate adjustment to the model, through being simulta-neously associated to the sampling and evaluation processes used for this trait.
Estimated values for the heritability coefficient in the broad sense (h$b
2
) were 74.7%, 51.9%, 49.6% and 55.8%,
and in the narrow sense (h$n 2
) they were 36.1%, 19.9%,
49.6% and 20.3% for GFP, LR, PIPD and PSS traits, re-spectively (Table, 5). The suggestion is that the negative values were obtained for genetic variation when dominance equals zero, thus making it possible to obtain the herita-bility coefficient in both the broad and narrow sense for PIPD. Nevertheless, it should be noted that theh$b2
coeffi-cient comprises all the genetic influences in its expression, instead of only the additive effects of additive genes. Thus, except for conditions where dominance effects are null, this cannot be used as a precise indicator for obtaining a precise estimation of selection gains. In other words, estimates of Table 4- Information employed in the joint-scale test for obtaining estimates of genetic additive (s$A
2
), dominance (s$D 2
) and environmental (s$E 2
) variances, using weighted least-squares (Mather and Jinks, 1984) for traits associated to resistance against the stink bug complex (GFP, LR, PIPD and PSS)1in
soy-bean.
SV2 GFP LR3 PIPD4 PSS4
DF MSQ5 DF MSQ5 DF MSQ5 DF MSQ5
sFT(F )2
2
36 13.9440 36 0.1402 34 0.0164 36 0.1105
sFe(F ) 2:3
2
29 15.4427 29 0.1136 29 0.0116 29 0.0906
sFd(F2:3)
2 360 12.5340 360 0.1154 348 0.0104 348 0.0967
sFe(RC F1 2:3) 2
29 10.8686 29 0.1744 29 0.0130 29 0.0581
sFd(RC F1 2:3) 2
357 9.2970 357 0.1232 351 0.0106 346 0.0831
sFe(RC F2 2:3) 2
29 16.0359 29 0.0846 29 0.0071 29 0.1292
sFd(RC F2 2:3) 2
354 10.3260 356 0.1137 340 0.0105 340 0.0812
sFT(F )4
2
36 20.6220 36 0.1162 35 0.0161 36 0.0996
MSQ error among means 209 5.0290 209 0.0686 207 0.0054 207 0.0510 MSQ error within plot 141 4.9900 141 0.0704 141 0.0110 140 0.0609
1GFP (grain filling period) - LR (leaf retention) - PIPD (percentage index of pod damage) - PSS (percentage of spotted seeds).2Sources of variation from
joint-analysis of variance and its respective degrees of freedom and mean squares.3Raw data transformed to x+0 5. .4Raw data transformed to arcsin x/100.5Mean squares of sources of variation from variance joint-analysis of variance (Table 1).
Table 5- Estimates of additive (s$A 2
), dominance (s$D 2
) and environmental(s$E)
2
genetic variances, obtained by weighted least squares. Estimates of heritability coefficients in the broad (h$b
2
) and narrow (h$n 2
) senses, and adherence test of the additive-dominant model applied to phenotypic variances of the evaluated groups.
Parameters Traits1
GFP (days) LR (grade)2 PIPD (%)3 PSS (%)3
$ sA
2
7.1780±2.507 0.0295±0.033 0.0054±0.002 0.0240±0.017
$ sD
2
7.6822±3.816 0.0474±0.063 -0.0033±0.003 0.0420±0.032
$ sE
2
5.0448 0.0711 0.0055 0.0523
$
hb
2 74.66 51.94 49.61 55.80
$
hn
2 36.06 19.94 49.61 20.27
Iterations 11 15 11 9
c2 6.43 17.07 6.75 7.57
DF 5 5 5 5
Probability 0.26 0.04 0.24 0.18
1GFP (grain filling period) - LR (leaf retention) - PIPD (percentage index of pod damage) - PSS (percentage of spotted seeds).2Raw data transformed by
selection gains may be over-estimated by the use of this co-efficient.
For the GFP, LR and PSS traits, the estimates ofh$b2
were superior toh$n 2
. These estimates occurred due to the in-fluence of the dominance component of the variance (s$D2
) in the expression of the total phenotypic variance, which exhibited superior magnitudes in comparison to the effects of additive genetic variance in these traits. It is generally verified that an increase in magnitude in s$D2
implies a decrease inh$n
2
in the reference generation F2. Thus, it is
ob-served that the selection of genotypes from initial genera-tions for GFP, LR and PSS traits may be difficult due to the higher influence of dominance effects. According to Ven-covsky and Barriga (1992), selection for low heritability traits, or for those with dominance, is ineffective when car-ried out in early generations. For this reason, selection based on these traits is more effective when undertaken in subsequent generations. In this way, the occurrence of het-erozygotes is reduced and, consequently, dominance varia-tion is maximized, while the available additive variance for selection is increased, thereby providing higher possibili-ties of selection gains for the trait.
According to Broginet al.(2003), heritability values are considered small when inferior to 30%, intermediate when between 30% and 60% and high when superior to 60%. Theh$n
2
values obtained for GFP and PIPD were over 30%, and therefore can be considered to be intermediate to high. According to Reiset al.(2002), heritability values in this magnitude range may be associated to lower complex-ity in genetic control of the trait, and probably the additive effects represent a higher proportion in total phenotypic variation, with few genes involved in its expression. These results may be associated to high heritability values, possi-bly due to high genetic variability among the evaluated ge-notypes and efficient environmental control achieved in the experimental field, this being reflected in CV (Table 1), and on considering that heritability is a genetic factor that is specific for a given population, trait and field conditions from which it is obtained.
According to Broginet al.(2003), traits with herita-bility estimates higher than 30% allow for genetic gains through selection in initial generations of endogamy, such as generations F3or F4. In the present study, the estimate of $
hn 2
was 36% for the GFP trait, although dominance gene ef-fects are of a higher magnitude than additive ones. Thus, under these conditions, the selection of resistant genotypes based on the GFP trait should be carried out in advanced en-dogamy generations.
Therefore, for GFP, LR and PSS traits, which exhibit
$
hn 2
values of 36.06%, 19.94% and 20.27%, respectively, in the reference F2generation, besides significant dominance
gene effects, it is recommended to select genotypes in pop-ulations with higher endogamy levels. In this way, it is pos-sible to increase the magnitude of available additive
variance and decrease gene dominance effects on the trait itself. According to Silvaet al.(2004), in theory, it is con-sidered that an F5 generation individual presents enough
homozygosis levels to allow for selection, mainly due to the absence of significant additions to the level of homozygous individuals in future generations which would imply longer periods for selection.
The obtained h$r 2
value for PIPD was 49.61%. This means that it is possible to obtain genetic gains from selec-tion in initial generaselec-tions of endogamy, such as in genera-tions F3or F4. However, there are significant difficulties in
the evaluation of this trait, due to the need for a representa-tive sample of pods per plant. This can be problematic, since in these stages there are generally many genotypes to be evaluated.
Based on the observed results from genetic analyses of means and variances, as well as estimates of heritability coefficients, it can be concluded that the best strategy for obtaining stink bug resistant genotypes is selection of the PIPD trait in early generations (F3or F4), followed by
selec-tion for GFP, LR and PSS in following generaselec-tions with higher endogamy levels.
References
Brogin RL, Arias CAA and Toledo JFF (2003) Genetic control of soybean resistance to brown spot (Septoria glycines): First studies. Crop Breed Appl Biotechnol 3:35-44.
Cavalli LL (1952) An analysis of linkage in quantitative inheri-tance. In: Reeve CR and Waddington CD (eds) Quantitative Inheritance. HMSO, London, pp 135-144.
Cruz CD and Carneiro PCS (2003) Modelos Biométricos Apli-cados ao Melhoramento Genético. 2nd edition. Universi-dade Federal de Viçosa, Viçosa, 585 pp.
Fehr WR and Caviness CE (1977) Stages of Soybeans Develop-ment. Iowa State University, Ames, 11 pp.
Gazzoni DL (1998) Efeito de populações de percevejos na produ-tividade, qualidade da semente e características agronô-micas da soja. Pesq Agrop Bras 33:1229-1237.
Godoi CRC, Pereira FS, Umeno F, Azara NA, Lima LPMS, Silva RP, Oliveira AB, Araújo IM, Zucchi MI and Pinheiro JB (2002) Resistência a insetos em populações de soja com diferentes proporções gênicas de genitores resistentes. Pesq Agrop Trop 32:47-55.
Lourenção AL, Rossetto CJ and Miranda MAC (1987) Resis-tência de soja a insetos. VIII. IAC 78-2318, linhagem com resistência múltipla. Bragantia 46:65-72.
Lourenção AL, Braga NR, Miranda MAC, Valle GE, Pereira JCVNA and Reco PC (2002) Avaliação de danos de perce-vejos e de desfolhadores em genótipos de soja de ciclos precoce, semiprecoce e médio. Neotrop Entomol 31:623-630.
Mather K and Jinks JL (1984) Introdução à Genética Biométrica. Sociedade Brasileira de Genética, Ribeirão Preto, 242 pp. McPherson RM and Buss GR (2007) Evaluating lepidopteran
McPherson RM, Buss GR and Roberts PM (2007) Assessing stink bug resistance in soybean breeding lines containing genes from germoplasma IAC-100. J Econ Entomol 100:1456-1463.
Miranda MAC, Rossetto CJ, Rossetto D, Braga NR, Mascarenhas HAA, Teixeira JPF and Massariol A (1979) Resistência de soja aNezara viridulaePiezodorus guildiniiem condições de campo. Bragantia 38:181-188.
Moura MF and Pinheiro JB (2002) Selection of soybean geno-types resistant to insects adapted to the cerrados. Crop Breed Appl Biotechnol 2:391-400.
Moura MF, Vencovsky R, Morais LK, Aguiar AV, Moura NF and Pinheiro JB (2003) Genetic gains and correlations between yield and insect resistance traits in soybean. Genet Breed J 57:341-348.
Pessoni LA, Zimmermann MJO and Faria JC (1997) Genetic con-trol of characters associated with bean golden mosaic gemi-nivirus resistance in Phaseolus vulgaris L. Braz J Genet 20:51-58.
Pimentel Gomes F (1990) Curso de Estatística Experimental. 13ª edição. São Paulo, Nobel, 465 pp.
Pinheiro JB, Vello NA, Rossetto CJ and Zucchi MI (2005) Poten-tial of soybean genotypes as insect resistance sources. Crop Breed Appl Biotechnol 5:293-300.
Reis EF, Reis MS, Sediyama T and Cruz CD (2002) Estimativa de variâncias e herdabilidades de algumas características pri-márias e secundárias da produção de grãos em soja (Glycine max(L.) Merrill). Ciênc Agrotecnol 26:749-761.
Rossetto CJ, Igue T, Miranda MAC and Lourenção AL (1986) Resistência de soja a insetos. VI. Comportamento de genó-tipos em relação a percevejos. Bragantia 45:323-335. Rossetto CJ, Gallo PB, Razera LF, Bortoletto N, Igue T, Medina
PF, Tisselli Filho O, Aquilera V, Veiga RFA and Pinheiro JB (1995) Mechanisms of resistance to stink bug complex in the soybean cultivar ‘IAC-100’. An Soc Entomol Bras 24:517-522.
Sas Institute (1998) SAS/ STAT User’s Guide., v. 8.00. Sas Insti-tute, Cary.
Silva NO, Ramalho MAP, Abreu AFB and Carneiro JE (2004) Performance of common bean families after different gener-ations under natural selection. Genet Mol Biol 27:574-578. Souza RF and Toledo JFF (1995) Genetic analysis of soybean
re-sistance to stinkbug. Braz J Genet 18:593-598.
Toledo JFF (1991) Programa de computador para estimar parâ-metros genéticos, componentes de médias e variâncias, pelo
método dos quadrados mínimos ponderados. Pesq Agrop Bras 26:1023-1039.
Vencovsky R and Barriga P (1992) Genética Biométrica no Fito-melhoramento. Sociedade Brasileira de Genética, Ribeirão Preto, 486 pp.
Internet Resources
Ferreira DF (2004) Programa MAPGEN, http://www.dex.ufla.br/danielff/prog.htm (April 20, 2004).
Supplementary Material
The following online material is available for this article: Table S1 - Genetic components of the expected means for parent
lines and their segregating generations, involving additive, dominance and di-genic epistatic interactions used in the joint scale test proposed by Cavalli (1952).
Table S2 - Genetic and environmental components associated to phenotypic variances of inbred lines and segregating genera-tions, without considering the influence of epistatic effects on trait expression.
Table S3 - Summary of analysis of variance, with those mean squares associated to variation among the means and within plots from their respective sources of variation, for the trait grain filling period (days).
Table S4 - Summary of analysis of variance, with those mean squares associated to variation among the means and within plots from their respective sources of variation for the trait leaf retention (grade).
Table S5 - Summary of analysis of variance, with those mean squares associated to variation among the means and within the plots from the respective sources of variation for the trait percentage index of pod damage in soybeans (%).
Table S6 - Summary of analysis of variance, with those mean squares associated to variation among the means and within the plots from their respective sources of variation for the trait percentage of spotted soybean seeds (%).
This material is available as part of the online article from http://www.scielo.br/gmb.
Associate Editor: Everaldo Gonçalves de Barros
segregating generations, involving additive, dominance and di-genic epistatic interactions
used in the joint scale test proposed by Cavalli (1952).
Genetic components
1Geration
m
[a]
[d]
[aa]
[ad]
[dd]
FT-Estrela (Parent line 1)
1
1
0
1
0
0
IAC-100 (Parent line 2)
1
-1
0
1
0
0
F
21
0
½
0
0
¼
F
31
0
¼
0
0
116BC
1F
2:31
½
18¼
116 164BC
2F
2:31
- ½
18¼
−116 164F
41
0
180
0
1641
m = mean of F2-derived homozygous lines; [a] = estimate of additive gene effect; [d] = estimate of
inbred lines and segregating generations, without considering the influence of epistatic
effects on trait expression.
Generations
2A
ˆ
σ
2D
ˆ
σ
∑
ad
2w
ˆ
σ
2e
ˆ
σ
2 ) FT(F2
σ
1
1
0
1
0
2 ) F ( Fe 2:3
σ
1
140
1n1
2 ) F ( Fd 2:3
σ
122
1
0
1
0
2 ) F RC ( Fe 12:3
σ
1
3168 1
n
1
1
2 ) F RC ( Fd 12:3
σ
144
1
0
1
0
2 ) F RC ( Fe 22:3
σ
1
3168 1
− 1n
1
2 ) F RC ( Fd 22:3
σ
144
1
0
1
0
2 ) F (
FT 4
σ
7416
7
0
1
0
MSQ Error between the plots
0
0
0
1n1
MSQ Error within the plot
0
0
0
1
0
n
: harmonic mean of the number of plants per plot; 2 e 2w 2
E n ˆ
ˆ
ˆ = σ + σ
variation among the means and within plots from their respective sources of variation, for
the trait grain filling period (days).
Experiment 1
Experiment 2
Experiment 3
SV
DF
MSQ
DF
MSQ
DF
MSQ
Blocks
6
3.9932ns
6 36.3392**
6 22.2359**
Treatments
35
22.9248**
35 19.0386**
35 18.5253**
F
2:39
8.5287ns
9 22.9495**
9 15.3636**
BC
1F
2:3(BC
1)
9
11.0317*
9 11.6043ns
9 12.3147**
BC
2F
2:3(BC
2)
9
15.4168**
9 18.1636**
9
16.595**
Bulks
1
2.6667ns
1
5.2267ns
1
3.8400ns
Inbred lines (IL)
3
66.4033**
3
24.0756*
3 49.4167**
Groups
4
67.8136**
4 28.6101**
4 23.7875**
G
1vs
G
2 1(1)
11,2067ns
(1) 20.1667ns
(1) 52.8067**
BC
1vs
BC
2(1) 159.3100**
(1) 66.1500**
(1) 71.7227**
Error among means
69
4.42
70
6.2718
70
4.3872
Error within plots
423
9.8531
429
12.9249
432
10.0657
Within F
2:3120
13.2400
120
15.7567
120
12.2233
Within BC
1F
2:3117
9.3641
120
9.9167
120
8.6133
Within BC
2F
2:3114
7.6550
120
15.2900
120
9.5000
Within F
212
8.6667
12
12.9667
12
20.2000
Within F
412
15.7667
12
22.1667
12
23.9333
Within IL
48
6.6167
45
4.6133
48
3.7167
Means
28.45
29.21
30.02
CV (%)
7.39
8.57
6.98
* and **
: significant at 5% and 1% of probability by F Test, respectively.
1
variation among the means and within plots from their respective sources of variation for
the trait leaf retention (grade).
Experiment 1
Experiment 2
Experiment 3
SV
DF
MSQ
DF
MSQ
DF
MSQ
Blocks
2
0.0486ns
2
0.539**
2 0.2257ns
Treatments
35
0.2244**
35
0.4397**
35
0.1227*
F
2:39
0.0987ns
9
0.0897ns
9
0.1708*
BC
1F
2:3(BC
1)
9
0.323**
9
0.0635ns
9
0.167*
BC
2F
2:3(BC
2)
9
0.0728ns
9
0.1285*
9
0.047ns
Bulks
1
0.1652ns
1
0.0467ns
1 0.0007ns
Inbred line (IL)
3
0.6171**
3
0.1971*
3
0.2154*
Groups
4
0.3347**
4
0.4288**
4 0.0463ns
G
1vs
G
2 2(1)
0.9292**
(1)
0.1572ns
(1)
0.071ns
BC
1vs
BC
2(1)
0.8301**
(1)
0.3276*
(1) 0.1221ns
Error among the means
69
0.0734
70
0.0558
70
0.07651
Error within the plot
425
0.0973
429
0.1173
432
0.1238
Within F
2:3120
0.0877
120
0.1202
120
0.1383
Within BC
1F
2:3117
0.1086
120
0.1429
120
0.1178
Within BC
2F
2:3116
0.1134
120
0.1041
120
0.1235
Within F
212
0.0650
12
0.1748
12
0.1808
Within F
412
0.1779
12
0.0523
12
0.1183
Within IL
48
0.0424
45
0.0788
48
0.0905
Means
1.71
1.72
1.75
CV
(%)
15.84
13.74
15.77
* and **
: significant at 5% and 1% of probability by F Test, respectively.
1
Raw data transformed by (x+0.5).
2
variation among the means and within the plots from the respective sources of variation for
the trait percentage index of pod damage in soybeans (%).
Experiment 1
Experiment 2
Experiment 3
SV
DF
MSQ
DF
MSQ
DF
MSQ
Blocks
2
0.0161ns
2
0.0272**
2
0.0157*
Treatments
35
0.0111*
35
0.0121**
35
0.0141**
F
2:39
0.0093ns
9
0.0076ns
9
0.0165**
BC
1F
2:3(BC
1)
9
0.0093ns
9
0.0131*
9
0.0168**
BC
2F
2:3(BC
2)
9
0.0072ns
9
0.0072ns
9
0.0090ns
Bulks
1
0.0021ns
0.0006ns
1
0.0084ns
Inbred lines (IL)
3
0.0418**
3
0.0218**
3
0.0116ns
Groups
4
0.0133ns
4
0.0245**
4
0.0179*
G
1vs
G
2 2(1)
0.1180**
(1)
0.0231*
(1)
0.0200*
BC
1vs
BC
2(1)
0.0525**
(1)
0.0524**
(1)
0.0002ns
Error among the means
69
0.0060
69
0.0052
69
0.0050
Error within the plots
413
0.0099
411
0.0115
425
0.0112
Within F
2:3115
0.0113
114
0.0097
119
0.0102
Within BC
1F
2:3117
0.0115
114
0.0131
120
0.0074
Within BC
2F
2:3110
0.0082
114
0.0106
116
0.0127
Within F
212
0.0140
12
0.0116
10
0.0249
Within F
411
0.0066
12
0.0072
12
0.0337
Within IL
48
0.0068
45
0.0155
48
0.0111
Means
0.52
0.53
0.53
CV (%)
14.87
13.79
13.21
* and **
: significant at 5% and 1% of probability by F Test, respectively.
1
Raw data transformed by arcsen (x/100)
2
variation among the means and within the plots from their respective sources of variation
for the trait percentage of spotted soybean seeds (%).
Experiment 1
Experiment 2
Experiment 3
SV
DF
MSQ
DF
MSQ
DF
MSQ
Blocks
2
0.0349ns
2
0.0902ns
2
0.1375ns
Treatments
35
0.2170**
35
0.1466**
35
0.1027*
F
2:39
0.1197ns
9
0.0635ns
9
0.0961ns
BC
1F
2:3(BC
1)
9
0.0596ns
9
0.0425ns
9
0.7589ns
BC
2F
2:3(BC
2)
9
0.1283*
9
0.1936**
9
0.0771ns
Bulks
1
0.0028ns
0.0154ns
1
0.0087ns
Inbred lines (IL)
3
0.6841**
3
0.2818**
3
0.1084ns
Groups
4
0.6558**
4
0.3928**
4
0.2391**
G
1vs
G
2 2(1)
1.3379**
(1)
0.3687**
(1)
0.1206ns
BC
1vs
BC
2(1)
1.5601**
(1)
0.5499**
(1)
0.3240*
Error among means
69
0.0604
69
0.0341
69
0.0585
Error within the plots
412
0.0896
411
0.0865
423
0.0795
Within F
2:3114
0.0951
116
0.1067
118
0.0886
Within BC
1F
2:3115
0.1005
113
0.0857
118
0.0636
Within BC
2F
2:3111
0.0846
114
0.0791
115
0.0800
Within F
212
0.0532
12
0.1350
12
0.1431
Within F
412
0.1646
12
0.0655
12
0.0689
Within IL
48
0.0527
44
0.0469
48
0.0820
Means
0.85
0.95
0.88
CV (%)
28.96
19.49
27.40
* and **
: significant at 5% and 1% of probability by F Test, respectively.
1
Raw data transformed by arcsen (x/100)
2