BGD
12, 10167–10193, 2015
Differences between coastal and open ocean distributions
of N2O
A. Kock et al.
Title Page
Abstract Introduction
Conclusions References
Tables Figures
◭ ◮
◭ ◮
Back Close
Full Screen / Esc
Printer-friendly Version
Interactive Discussion
Discussion
P
a
per
|
Discussion
P
a
per
|
Discussion
P
a
per
|
Discussion
P
a
per
|
Biogeosciences Discuss., 12, 10167–10193, 2015 www.biogeosciences-discuss.net/12/10167/2015/ doi:10.5194/bgd-12-10167-2015
© Author(s) 2015. CC Attribution 3.0 License.
This discussion paper is/has been under review for the journal Biogeosciences (BG). Please refer to the corresponding final paper in BG if available.
Di
ff
erences between coastal and open
ocean distributions of N
2
O in the oxygen
minimum zone o
ff
Peru
A. Kock1, D. L. Arévalo-Martínez1, C. R. Löscher2, and H. W. Bange1
1
GEOMAR Helmholtz Centre for Ocean Research Kiel, Duesternbrooker Weg 20, 24105 Kiel, Germany
2
Institute of General Microbiology, Christian-Albrechts University Kiel, Am Botanischen Garten 1–9, 24118 Kiel, Germany
Received: 31 May 2015 – Accepted: 09 June 2015 – Published: 08 July 2015
Correspondence to: A. Kock ([email protected])
BGD
12, 10167–10193, 2015
Differences between coastal and open ocean distributions
of N2O
A. Kock et al.
Title Page
Abstract Introduction
Conclusions References
Tables Figures
◭ ◮
◭ ◮
Back Close
Full Screen / Esc
Printer-friendly Version
Interactive Discussion
Discussion
P
a
per
|
Discussion
P
a
per
|
Discussion
P
a
per
|
Discussion
P
a
per
Abstract
Depth profiles of nitrous oxide (N2O) were measured during six cruises to the upwelling area and oxygen minimum zone (OMZ) offPeru in 2009 and 2012/13, covering both the coastal shelf region and the adjacent open ocean. N2O profiles displayed a strong sensitivity towards oxygen concentrations. Open ocean profiles showed a transition
5
from a broad maximum to a double-peak structure towards the centre of the OMZ
where the oxygen minimum was more pronounced. Maximum N2O concentrations in
the open ocean were about 80 nM. A linear relationship between∆N2O and apparent oxygen utilization (AOU) could be found for all measurements within the upper oxy-cline, with a slope similar to studies in other oceanic regions. N2O profiles close to the
10
shelf revealed a much higher variability, with N2O concentrations in the upper oxycline reaching up to several hundred nanomoles per liter at selected stations. Due to the extremely sharp oxygen gradients at the shelf, these maxima occurred in very shallow water depths of less than 50 m. In this area, a linear relationship between∆N2O and AOU could not be observed. N2O concentrations above 100 nM were observed at
oxy-15
gen concentrations ranging from close to saturation to suboxic conditions. Our results indicate that the coastal upwelling offPeru at the shelf causes conditions that lead to extreme N2O accumulation.
1 Introduction
Nitrous oxide (N2O) acts as a strong atmospheric greenhouse gas and contributes
sub-20
stantially to the stratospheric ozone depletion (IPCC, 2013; WMO, 2011). The ocean is a major source for N2O as it is naturally produced in the water column (Ciais et al., 2013; Bange, 2008). While in large parts of the surface ocean N2O concentrations are close to saturation, high emissions of N2O have been observed in upwelling areas where subsurface waters enriched in N2O are transported to the surface (e.g. Nevison
25
BGD
12, 10167–10193, 2015
Differences between coastal and open ocean distributions
of N2O
A. Kock et al.
Title Page
Abstract Introduction
Conclusions References
Tables Figures
◭ ◮
◭ ◮
Back Close
Full Screen / Esc
Printer-friendly Version
Interactive Discussion
Discussion
P
a
per
|
Discussion
P
a
per
|
Discussion
P
a
per
|
Discussion
P
a
per
|
oxygen distribution, and particularly high supersaturations are found in upwelling ar-eas which overlay pronounced oxygen minimum zones (OMZ), e.g. in the Arabian Sea (Bange, 2004) or in the eastern South Pacific Ocean (Charpentier et al., 2010).
These OMZs are key regions for the marine nitrogen (N) cycling where active N loss via canonical denitrification and anaerobic ammonium oxidation (anammox) takes
5
place. Recent studies furthermore indicate that they are also zones of intense nitro-gen fixation (Deutsch et al., 2007; Löscher et al., 2014; Fernandez et al., 2011), and in areas where the OMZ is fuelled by high export production, high rates of other N transformation processes, such as nitrification, have been observed (Hu et al., 2015; Kalvelage et al., 2013).
10
Within the nitrogen cycle, N2O evolves during nitrification and denitrification (Bange, 2008). Both processes strongly depend on the oxygen availability in the water column, with different responses to the oxygen concentration. Under oxic conditions the first step of nitrification, ammonium-oxidation to nitrite, is known to be the main produc-tion pathway for N2O, with an increasing N2O yield at decreasing oxygen
concentra-15
tions (Goreau et al., 1980; Löscher et al., 2012; Frame and Casciotti, 2010). During bacterial ammonium-oxidation, N2O can either be produced as a side product during the oxidation of ammonia to nitrite or through the reduction of nitrite to N2O (nitrifier-denitrification) (Stein, 2011). Nitrifier-denitrification has been identified as an important production pathway of N2O at low oxygen concentrations and may thus be responsible
20
for the increased N2O production under these conditions (Ni et al., 2014).
While the N2O production pathways during bacterial nitrification have been studied for several decades, archaeal ammonium oxidation has only recently come into focus as a main production pathway for N2O. The exact mechanism and the extent to which ammonium oxidation or a nitrifier-denitrification pathway are responsible for archaeal
25
BGD
12, 10167–10193, 2015
Differences between coastal and open ocean distributions
of N2O
A. Kock et al.
Title Page
Abstract Introduction
Conclusions References
Tables Figures
◭ ◮
◭ ◮
Back Close
Full Screen / Esc
Printer-friendly Version
Interactive Discussion
Discussion
P
a
per
|
Discussion
P
a
per
|
Discussion
P
a
per
|
Discussion
P
a
per
During denitrification, the canonical reduction of nitrate to molecular nitrogen, N2O evolves as an intermediate product. Denitrifying genes are widespread among diff er-ent groups of microorganisms, but active denitrification is restricted to suboxic to anoxic conditions (e.g. Firestone et al., 1980; Dalsgaard et al. 2014). Depending on the en-vironmental conditions, N2O production or consumption due to denitrification can be
5
observed in environmental samples.
As nitrification is one major process accompanying the remineralization of organic matter, a positive correlation between the excess N2O (∆N2O) and the apparent oxygen utilization (AOU) is often interpreted as an indication for nitrification as the main N2O production pathway (e.g. Walter et al., 2006; Forster et al., 2009). An increase in the
10
∆N2O/AOU ratio at low oxygen concentrations has been observed in several studies in different oceanic areas with reduced oxygen concentrations (Ryabenko et al., 2012; Upstill-Goddard et al., 1999; De Wilde and Helder, 1997), whereas a breakdown of this relationship due to N2O consumption is observed when oxygen concentrations fall below a certain, not well defined, threshold (Zamora et al., 2012).
15
There is a strong indication that at low oxygen concentrations nitrification and denitri-fication may take place in close proximity (Kalvelage et al., 2011), and the N2O produc-tion and consumpproduc-tion under these condiproduc-tions are strongly influenced by the interacproduc-tion of both processes. Stable isotope measurements of N2O in oxygen-deficient waters in-dicated that N2O accumulation within the oxycline as a result of the coupling between
20
nitrification and denitrification whereas N2O consumption in the OMZ core was asso-ciated with denitrification (Farías et al., 2007). The exact oxygen concentration where N2O consumption starts is not yet well determined, however (Cornejo and Farías, 2012; Zamora et al., 2012).
Measurements of denitrification and anammox rates in different oceanic OMZs have
25
Hamer-BGD
12, 10167–10193, 2015
Differences between coastal and open ocean distributions
of N2O
A. Kock et al.
Title Page
Abstract Introduction
Conclusions References
Tables Figures
◭ ◮
◭ ◮
Back Close
Full Screen / Esc
Printer-friendly Version
Interactive Discussion
Discussion
P
a
per
|
Discussion
P
a
per
|
Discussion
P
a
per
|
Discussion
P
a
per
|
sley et al., 2007) (Thamdrup et al., 2006). As N2O is not supposed to be involved in the anammox process (Kartal et al., 2011), anammox does not influence the N2O dis-tribution and only denitrification is thought to be responsible for N2O consumption at suboxic to anoxic conditions (Bange, 2008). The widespread N2O consumption in the OMZ core is thus an indicator for denitrification taking place in the ETSP (Farías et al.,
5
2007). One explanation for these contradicting findings is that denitrification is stim-ulated by the supply of organic carbon or hydrogen sulfide which could lead to only sporadically increased rates of denitrification (Chang et al., 2014; Dalsgaard et al., 2014; Galan et al., 2014).
Here we present N2O measurements in the water column offPeru from six
measure-10
ment campaigns during the upwelling in the ETSP. This region is characterized by one of the largest and most intense OMZs in the oceans, extending from the Peruvian shelf about 1000 km offshore with a maximum thickness of more than 600 m (Fuenzalida et al., 2009). It is located in the shadow zone of large ocean current systems which leads to a sluggish ventilation and long residence times of waters within the OMZ.
15
Along the continental margin, high primary productivity due to coastal upwelling and high remineralization rates in the underlying waters lead to a further drawdown in oxy-gen concentrations (Karstensen et al., 2008). Active N loss can be observed in large parts of the OMZ which is reflected in a pronounced secondary nitrite maximum and a strong nitrogen deficit in the OMZ core (Codispoti et al., 1986). The OMZ extends
20
over large parts of the Peruvian shelf where sulfidic conditions within the water column are frequently observed (Schunck et al., 2013). These conditions are comparable to the West Indian shelf where exceptionally high N2O concentrations have been measured (Naqvi et al., 2000) which indicates favorable conditions for enhanced N2O produc-tion (Codispoti, 2010). Only a few measurements of N2O from the Peruvian OMZ are
25
up-BGD
12, 10167–10193, 2015
Differences between coastal and open ocean distributions
of N2O
A. Kock et al.
Title Page
Abstract Introduction
Conclusions References
Tables Figures
◭ ◮
◭ ◮
Back Close
Full Screen / Esc
Printer-friendly Version
Interactive Discussion
Discussion
P
a
per
|
Discussion
P
a
per
|
Discussion
P
a
per
|
Discussion
P
a
per
welling taking place in this area (Charpentier et al., 2007; Castro-Gonzalez and Farías, 2004).
2 Methods
In total, 146 depth profiles (0–∼4200 m) of N2O were measured on two cruises
tween December 2008 and February 2009 (M77-3 and M77-4) and four cruises
be-5
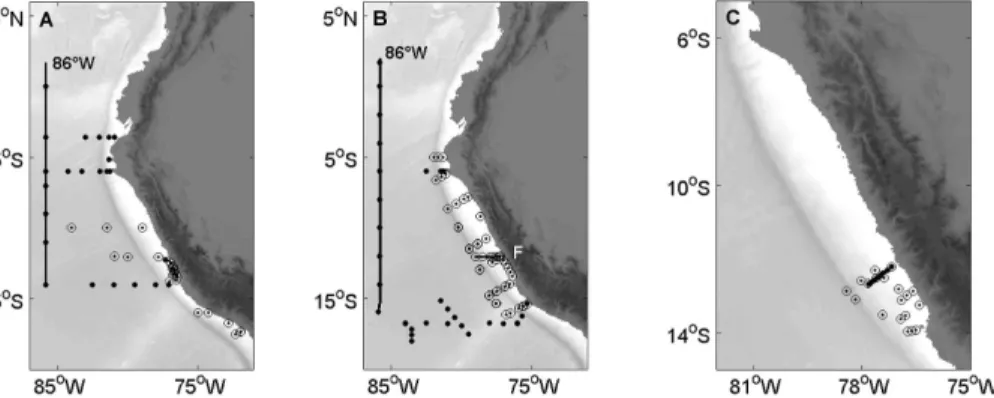
tween October 2012 and March 2013 (M90–M93) to the upwelling area and the ad-jacent open ocean off Peru onboard the German research vessel Meteor. The loca-tions of the sampled staloca-tions are shown in Fig. 1. While the M77-4 and M90 cruises mainly covered the open ocean area, the M77-3 and M91–M93 cruises mainly took place in the Peruvian shelf area. The work was part of the German DFG collaborative
10
research project (SFB) 754 (https://www.sfb754.de/) and the BMBF project SOPRAN (Surface Ocean PRocesses in the Antropocene, sopran.pangaea.de). The N2O data set described here has been archived in MEMENTO, the MarinE MethanE and NiTrous Oxide database (https://memento.geomar.de) (Kock and Bange, 2015).
Triplicate samples were taken from 10 L Niskin bottles mounted on a rosette water
15
sampler or a pump-CTD (M77-3) in 25 mL (M77-3 and M77-4) and 20 mL (M90–M93) opaque glass vials and sealed with butyl rubber stoppers and aluminum caps, thereby avoiding the inclusion of air bubbles.
Samples were treated with 0.2 mL (M77-3 and M77-4) and 0.05 mL (M90–M93) of a saturated mercuric chloride solution directly after the sampling to inhibit microbial
20
N2O production or consumption. The samples were either analyzed onboard (M77-3 and M77-4, M91, partly M90 and M9(M77-3) within a few days or shipped to GEOMAR by air freight for later analysis (M92, partly M90 and M93). Samples that were shipped to Germany were additionally sealed with paraffin wax and stored upside down to avoid the formation of air bubbles in the samples due to temperature and pressure changes
25
BGD
12, 10167–10193, 2015
Differences between coastal and open ocean distributions
of N2O
A. Kock et al.
Title Page
Abstract Introduction
Conclusions References
Tables Figures
◭ ◮
◭ ◮
Back Close
Full Screen / Esc
Printer-friendly Version
Interactive Discussion
Discussion
P
a
per
|
Discussion
P
a
per
|
Discussion
P
a
per
|
Discussion
P
a
per
|
Samples were analyzed using a static equilibration method: 10 mL helium (99.9999 % AirLiquide, Düsseldorf, Germany) was manually injected into each vial which was vigorously shaken for about 20 s and allowed to equilibrate at ambient temperature for a minimum of two hours. A subsample of the equilibrated headspace was manually injected into a GC-ECD system (Hewlett-Packard 5890 Series II,
Agi-5
lent Technologies, Santa Clara, CA, USA), equipped with a 6′ 1/8′′
packed column (molsieve, 5Å, W. R. Grace and Co.-Conn., Columbia, MY). The GC was operated at 190◦
C, using argon/methane (95/5 %, ECD purity, AirLiquide, Düsseldorf, Germany) as carrier gas at a flow rate of 30 mL min−1.
The GC was calibrated on a daily basis with a minimum of 2 (M77-3 and M77-4) or
10
4 (M90–M93) different standard gas mixtures (N2O in synthetic air, Deuste-Steininger GmbH, Mühlhausen, Germany and Westfalen AG, Münster, Germany) which were cal-ibrated against NOAA primary standards at the Max Planck Institute for Biogeochem-istry in Jena, Germany, if the standard gas concentrations were within the calibration range of the NOAA gases. Gases with higher N2O concentrations were internally
cal-15
ibrated using an LGR N2O/CO analyzer (Los Gatos Research, Mountain View, CA, USA), which was proven to have a linear response and minimal drift within the cali-bration range (Arévalo-Martínez et al., 2013). The N2O concentration in the samples was calculated according to Walter et al. (2006) using the solubility function of Weiss and Price (1980). The average precision of the measurements, calculated as median
20
standard deviation from triplicate measurements, was 0.7 nM.
∆N2O was calculated as the difference between the in-situ concentration [N2O]wand the equilibrium concentration [N2O]eq:
∆N2O=[N2O]w−[N2O]eq (1)
We used the contemporary atmospheric mixing ratio measured at Cape Grim,
Tasma-25
at-BGD
12, 10167–10193, 2015
Differences between coastal and open ocean distributions
of N2O
A. Kock et al.
Title Page
Abstract Introduction
Conclusions References
Tables Figures
◭ ◮
◭ ◮
Back Close
Full Screen / Esc
Printer-friendly Version
Interactive Discussion
Discussion
P
a
per
|
Discussion
P
a
per
|
Discussion
P
a
per
|
Discussion
P
a
per
mospheric mixing ratio since the beginning of the industrial revolution (Freing et al., 2009). The use of the contemporary N2O mixing ratio of 2013 would lead to a maxi-mum∼17 % overestimate of [N
2O]eq, thus leading to only a small error compared to
the maximum N2O concentrations measured in our study, and the use of the contem-porary atmospheric mixing ratio still allows a qualitative analysis of the ∆N2O/AOU
5
relationship in order to investigate the formation and consumption processes of N2O. The potential temperature of the water parcel at a certain depth was calculated using the Gibbs Seawater Oceanographic Toolbox (McDougall and Barker, 2011).
Oxygen concentrations were measured either with a Seabird (M77-3 and M77-4: SBE-5; M90-M93: SBE 43) oxygen sensor (Sea-Bird Electronics, Bellevue, WA, USA)
10
mounted on the CTD rosette or from 100 mL discrete samples taken from the Niskin bottles and analyzed using the Winkler titration method (Grasshoff et al., 1999). The oxygen sensor was calibrated against the Winkler measurements.
Recent studies using highly sensitive STOX (Switchable Trace amount Oxygen) sen-sors for oxygen measurements indicate that measurements with conventional oxygen
15
sensors that are calibrated against Winkler measurements may be biased towards higher concentrations at near-zero oxygen conditions. Thamdrup et al. (2012) there-fore argued that anoxic conditions are prevalent in the core of the Peruvian OMZ where oxygen concentrations of several µM have been found using the conventional Winkler-calibrated measurements. As STOX sensor measurements were not available
20
for all measurement campaigns presented here, the minimum oxygen measurements reported here from the core of the OMZ (3–5 µM) should be considered as an overes-timation.
The Apparent Oxygen Utilization (AOU) was calculated from the oxygen concentra-tions [O2]w using the CSIRO SeaWater library, version 3.2 (http://www.cmar.csiro.au/
25
datacentre/ext_docs/seawater.htm) to calculate oxygen saturation [O2]eq:
BGD
12, 10167–10193, 2015
Differences between coastal and open ocean distributions
of N2O
A. Kock et al.
Title Page
Abstract Introduction
Conclusions References
Tables Figures
◭ ◮
◭ ◮
Back Close
Full Screen / Esc
Printer-friendly Version
Interactive Discussion
Discussion
P
a
per
|
Discussion
P
a
per
|
Discussion
P
a
per
|
Discussion
P
a
per
|
Nutrient samples from the CTD rosette were analyzed onboard following the nutrient analysis methods according to Hansen et al. (1999). Samples taken from the pump-CTD during M77-3 were stored at−20◦C and shipped to Germany for later analysis.
N′
was calculated as a measure for the nitrogen deficit from the nitrate ([NO−
3]), nitrite
([NO−
2]) and phosphate ([PO 3−
4 ]) concentrations as follows (Altabet et al., 2012):
5
N′
= NO−
3
+NO−
2
−16
h PO3−
4
i
(3)
3 Results and discussion
The oxygen profiles revealed an intense oxygen minimum zone throughout the studied area, with a vertical thickness of several hundreds of meters. In the open ocean, the oxygen concentrations in the core of the OMZ increased towards the north from
be-10
low 3 µM south of 5◦
S to∼10 µM at the equator. South of 13◦S the mixed layer depth
significantly increased from∼50 to∼100 m, which is reflected in the oxygen and N
2O
distributions (Fig. 2). Due to the coastal upwelling, the depth of the upper OMZ bound-ary significantly decreased towards the coast, with a well oxygenated mixed layer of
∼50 m in the open ocean and a mixed layer depth of less than 5 m on the shelf. Oxygen 15
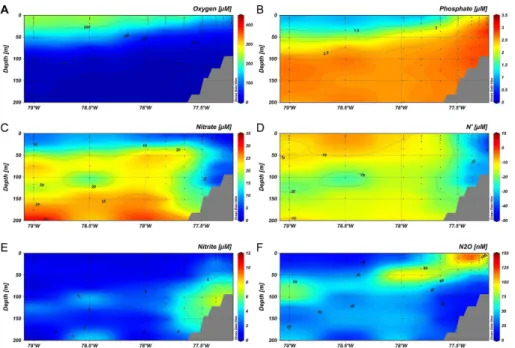
was strongly undersaturated in the surface waters on the shelf as a result of upwelling of waters from the underlying OMZ. Elevated phosphate concentrations in the surface waters at the coast also reflected the upwelling on the shelf (Fig. 3).
The vertical profiles showed characteristic nutrient distributions that marked the zones of nitrogen depletion: accumulation of nitrite was observed in the core of the
20
OMZ where oxygen concentrations fell below ∼5 µM and low N′ values coincided
with the nitrite maxima in the OMZ https://www.sfb754.de/. The maximum nitrite con-centration reached ∼13 µM, with a more pronounced maximum at the shelf than in
open ocean waters. Additionally, many profiles showed an additional, less pronounced primary nitrite maximum within the upper oxycline that is associated with
BGD
12, 10167–10193, 2015
Differences between coastal and open ocean distributions
of N2O
A. Kock et al.
Title Page
Abstract Introduction
Conclusions References
Tables Figures
◭ ◮
◭ ◮
Back Close
Full Screen / Esc
Printer-friendly Version
Interactive Discussion
Discussion
P
a
per
|
Discussion
P
a
per
|
Discussion
P
a
per
|
Discussion
P
a
per
tion (Codispoti and Christensen, 1985) (Fig. 4). At the shelf, strong signals of N loss throughout the water column are reflected in low N′
and nitrate values (Fig. 3).
The N2O depth distribution showed a strong sensitivity to oxygen concentrations throughout the study area. In the offshore waters, surface N2O concentrations were close to saturation, with a strong increase below the mixed layer (Fig. 2). Two types
5
of depth profiles could be identified: a broad N2O maximum at the depth of the oxy-gen minimum was found at the northern and southern periphery of the oxyoxy-gen mini-mum zone where the minimini-mum oxygen concentrations did not fall below 5 µM. In con-trast, N2O depletion was found in the core of the OMZ, where oxygen concentrations below 5 µM were observed over a wide depth range. The N2O depth profiles in the
10
central OMZ thus revealed a double-peak structure with narrow N2O maxima in the upper and lower oxycline (Fig. 4). This depth profile structure has been frequently ob-served in other oceanic areas with highly depleted oxygen concentrations (e.g. Bange et al., 2010). N2O depletion coincided with nitrite accumulation in the OMZ core and high nitrate to phosphate ratios. In all offshore profiles N2O concentrations did not
ex-15
ceed 80 nM.
A large difference between offshore stations and the stations on and in proximity to the shelf could be observed: compared to the offshore waters, the N2O distribution at the shelf break and on the shelf showed a much larger variability. N2O depletion was in fact observed at oxygen concentrations below 5 µM, too, but N2O accumulation
20
with N2O concentrations above 100 nM was frequently observed, and several profiles showed an extreme N2O accumulation with concentrations up to ∼850 nM (Fig. 4).
The location and shape of the N2O maxima in the different profiles was highly variable, which resulted in a very patchy distribution of N2O in the water column over the shelf and in the adjacent waters (Fig. 3). A characteristic shape of the profiles could not
25
BGD
12, 10167–10193, 2015
Differences between coastal and open ocean distributions
of N2O
A. Kock et al.
Title Page
Abstract Introduction
Conclusions References
Tables Figures
◭ ◮
◭ ◮
Back Close
Full Screen / Esc
Printer-friendly Version
Interactive Discussion
Discussion
P
a
per
|
Discussion
P
a
per
|
Discussion
P
a
per
|
Discussion
P
a
per
|
highly supersaturated waters that were brought to the surface by coastal upwelling elsewhere. High resolution measurements of surface N2O during M90, M91 and M93 also revealed a heterogeneous N2O distribution with remarkably high concentrations of N2O in vicinity of the main upwelling cells offPeru (Arévalo-Martínez et al., 2015).
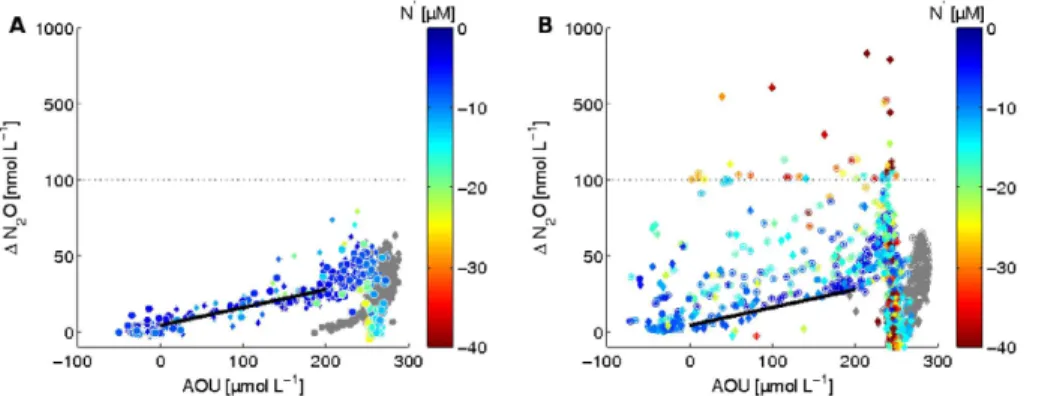
In the open ocean, a bilinear ∆N2O/AOU relationship has been identified in the
5
upper oxycline for waters with oxygen concentrations higher than 5 µM during the M77-4 cruise that took place in the offshore waters of the OMZ (Ryabenko et al., 2012). We found a very similar relationship for all data from the offshore cruises M77-4 and M90 with no systematic difference between the data from the M77-4 (Jan-uary/February 2009) cruise and the M90 (November 2012) cruise (Figs. 2 and 5a). This
10
indicates a comparable setting of the open ocean OMZ waters during both cruises. We furthermore found no difference in the∆N2O/AOU relationship between stations with a broad N2O maximum and a double-peak structure.
In contrast to the open ocean waters, a correlation between ∆N2O and AOU was not observed for the data from cruises that took place at the shelf (M77-3, M91–M93)
15
(Fig. 5b). The∆N2O/AOU ratio from the offshore waters serves as a lower limit for the coastal stations, where numerous values with much higher ∆N2O/AOU ratios were observed. The ∆N2O values that showed the strongest deviation from the offshore
∆N2O/AOU ratio were associated with low N′
values as a signal for a large nitrogen deficit (Fig. 5b). This indicates that these waters with extreme N2O accumulation had
20
been subject to extensive N loss. The high oxygen concentrations within these waters excludes in-situ denitrification or anammox, however (see e.g. Babbin et al., 2014; Dalsgaard et al., 2014), and the extraordinarily high N2O concentrations as well as the low N′
values seem to be old signals that were preserved during re-ventilation.
Extreme accumulation of N2O with concentrations up to 765 nM in the oceanic water
25
column has also been found in the Arabian Sea where oxygen depleted waters extend to the West Indian shelf (Naqvi et al., 2010, 2006) and at a time series station offChile (Farías et al., 2015), where maximum concentrations of∼500 nM were found. Naqvi
BGD
12, 10167–10193, 2015
Differences between coastal and open ocean distributions
of N2O
A. Kock et al.
Title Page
Abstract Introduction
Conclusions References
Tables Figures
◭ ◮
◭ ◮
Back Close
Full Screen / Esc
Printer-friendly Version
Interactive Discussion
Discussion
P
a
per
|
Discussion
P
a
per
|
Discussion
P
a
per
|
Discussion
P
a
per
response of denitrifying enzymes to transient oxygen depletion. N2O thus accumulated when oxygen reached suboxic conditions and consumption of N2O started when these waters became sulfidic (Naqvi et al., 2010). Farías et al. (2015) measured N2O accu-mulation during the transition from oxic to anoxic conditions, too, but at variable oxy-gen concentrations whereas N2O depletion was dominant under suboxic conditions. In
5
contrast to the results from the Indian Ocean, they identified enhanced remineralization due to short-term variability in coastal upwelling as the main driver for N2O accumula-tion.
In our study, N2O accumulation did not coincide with the accumulation of nitrite. We found N2O depletion in samples that showed marked nitrite accumulation (Fig. 4) and
10
similar to the measurements offChile, we found strongly elevated N2O concentrations (>100 nM) over the full range of oxygen concentrations (Fig. 5), whereas N2O accu-mulation on the Indian shelf was restricted to suboxic conditions.
Our results indicate that N2O accumulation took place during increasing oxygen con-centrations: the large N deficits we measured may be the result of earlier N loss and
15
subsequent re-ventilation of these waters. This re-ventilation could have also induced an abrupt increase in N2O production and subsequent N2O accumulation in the wa-ter column. The accumulated N2O could have remained preserved in the water col-umn when these waters were further ventilated as there is no known consumption process for N2O in oxygenated waters (Bange, 2008). This effect would disturb the
20
linear∆N2O/AOU relationship over a wide range of oxygen concentrations, whereas decreasing oxygen concentrations would lead only to a temporal accumulation with subsequent depletion of N2O, similar to the observations over the Indian shelf.
Enhanced production of N2O after re-ventilation is a known process occurring in soils (e.g. Morley et al., 2008). In a recent incubation study, Dalsgaard et al. (2014) found
25
BGD
12, 10167–10193, 2015
Differences between coastal and open ocean distributions
of N2O
A. Kock et al.
Title Page
Abstract Introduction
Conclusions References
Tables Figures
◭ ◮
◭ ◮
Back Close
Full Screen / Esc
Printer-friendly Version
Interactive Discussion
Discussion
P
a
per
|
Discussion
P
a
per
|
Discussion
P
a
per
|
Discussion
P
a
per
|
depleted in all samples that contained H2S and although we found extreme N2O ac-cumulation at the boundary of H2S-containing waters at some stations (Löscher et al., 2015), similarly high concentrations were present at stations without any signals of H2S, too. We cannot exclude that the high N2O production we frequently observed at the shelf is stimulated by a coupling of denitrification with sulfur cycling, though:
Can-5
field et al. (2010) found evidence for active sulfur cycling in the ETSP without H2S accumulation, and a potential coupling between H2S oxidation and denitrification has been demonstrated before (Galan et al., 2014; Jensen et al., 2009). Indeed, active den-itrification was only found in proximity to H2S plumes in the water column during M77-3 (Kalvelage et al., 2013), where the highest N2O concentrations during this cruise were
10
found, too (Löscher et al., 2015).
In the ocean, increased N2O production was also associated with the onset of nitrifi-cation after re-ventilation of the water column in a seasonal study in the Baltic Sea, but at relatively low concentrations (Naqvi et al., 2010). Yu et al. (2010) found increased N2O production by nitrifying bacteria that was stimulated by the availability of
ammo-15
nium during recovery from anoxic conditions in a chemostat culture experiment. Their results point towards an increased N2O production via the ammonium-oxidation path-way, while N2O production by nitrifier-denitrification seemed not to be stimulated by the shift from anoxic to oxic conditions. Studies of the isotopic and isotopomeric N2O composition could reveal more detailed insights whether N2O is produced via the
am-20
monium oxidation or the nitrite reduction pathway during extreme accumulation. Together with the high N2O concentrations we found low N′
values that were as-sociated with oxygenated waters only at the shelf, whereas in the open ocean N de-pletion was restricted to the OMZ core. This could indicate that re-ventilation of the oxygen-deficient waters mainly happens at the shelf, whereas waters in the open ocean
25
BGD
12, 10167–10193, 2015
Differences between coastal and open ocean distributions
of N2O
A. Kock et al.
Title Page
Abstract Introduction
Conclusions References
Tables Figures
◭ ◮
◭ ◮
Back Close
Full Screen / Esc
Printer-friendly Version
Interactive Discussion
Discussion
P
a
per
|
Discussion
P
a
per
|
Discussion
P
a
per
|
Discussion
P
a
per
oxygen consumption in the underlying waters due to the export and remineralization of organic matter, thereby creating strong small-scale variability in oxygen concentra-tions. Kalvelage et al. (2013) showed that these high remineralization rates also induce strong N cycling in the subsurface layer. Turnover rates for different N species are there-fore much faster on the shelf than in the open ocean OMZ (Hu et al., 2015), which is
5
also reflected in the distribution of different functional gene abundances (Löscher et al., 2014). One factor that also contributes to the N2O accumulation on the shelf could thus be generally higher rates of nitrification and/or denitrification on the shelf than in the open ocean.
4 Summary and conclusions
10
We observed extreme N2O accumulations over the Peruvian shelf with maximum
concentrations similar to the observations made by Naqvi et al. (2000) and Farías et al. (2015) over the Indian shelf, whereas N2O concentrations in the open ocean OMZ offPeru were comparably moderate. Similar to results from the Indian Ocean and the ETSP offChile, our results indicate that high N2O accumulation is associated with
15
a large variability in the oxygen concentrations together with elevated nitrification and denitrification rates on the shelf.
We found strong evidence that N2O accumulations are preserved during the ventila-tion of the water column and that waters with high N2O concentrations are directly and frequently transported to the surface ocean. This makes this region one of the most
im-20
portant oceanic regions for N2O emissions to the atmosphere (Arévalo-Martínez et al., 2015). This direct link between unusually high N2O production and emissions over the Peruvian shelf makes it necessary to understand the biogeochemical processes in-volved in N2O production and consumption to produce reliable predictions of oceanic emissions from this area. Current approaches to model the N2O distribution rely on
25
BGD
12, 10167–10193, 2015
Differences between coastal and open ocean distributions
of N2O
A. Kock et al.
Title Page
Abstract Introduction
Conclusions References
Tables Figures
◭ ◮
◭ ◮
Back Close
Full Screen / Esc
Printer-friendly Version
Interactive Discussion
Discussion
P
a
per
|
Discussion
P
a
per
|
Discussion
P
a
per
|
Discussion
P
a
per
|
in fact reproduce the oxygen distribution in the open ocean OMZ offPeru reasonably well, but they fail to account for the extreme N2O accumulation and its high spatial and temporal variability over the shelf area. They thus significantly underestimate the emis-sions from the Peruvian upwelling and potentially other upwelling areas with similar conditions, too.
5
Acknowledgements. We would like to thank the captains and crew of the R/VMeteorfor their professional support and the chief scientists of M77-3 and M90–M93, Martin Frank, Lothar Stramma, Stefan Sommer and Gaute Lavik for the opportunity to collect samples during their cruises. We would also like to thank Annie Bourbonnais and Johanna Maltby for the collection of N2O samples during M92, and Gesa Eirund, Joel Craig, Georgina Flores, Jennifer Zur, Moritz
10
Baumann, Tina Baustian and Dörte Nitschkowski for their help in analyzing the samples. We would like to thank Frank Malien, Mirja Dunker, Violeta Leon, Peter Fritsche, Tina Baus-tian, Kerstin Nachtigall, Martina Lohmann, Gabriele Klockgether and Tim Kalvelage for the sampling and analysis of oxygen and nutrient samples during M77-3 and M77-4 and M90– M93. The work presented here was made possible by the DFG-supported projects SFB754
15
Phase I and II (http://www.sfb754.de) and the BMBF joint projects SOPRAN II and III (FKZ 03F0611A and FKZ 03F662A).
References
Altabet, M. A., Ryabenko, E., Stramma, L., Wallace, D. W. R., Frank, M., Grasse, P., and Lavik, G.: An eddy-stimulated hotspot for fixed nitrogen-loss from the Peru oxygen minimum
20
zone, Biogeosciences, 9, 4897–4908, doi:10.5194/bg-9-4897-2012, 2012.
Arévalo-Martínez, D. L., Beyer, M., Krumbholz, M., Piller, I., Kock, A., Steinhoff, T., Körtzinger, A., and Bange, H. W.: A new method for continuous measurements of oceanic and atmospheric N2O, CO and CO2: performance of off-axis integrated cavity output spec-troscopy (OA-ICOS) coupled to non-dispersive infrared detection (NDIR), Ocean Sci., 9,
25
1071–1087, doi:10.5194/os-9-1071-2013, 2013.
BGD
12, 10167–10193, 2015
Differences between coastal and open ocean distributions
of N2O
A. Kock et al.
Title Page
Abstract Introduction
Conclusions References
Tables Figures
◭ ◮
◭ ◮
Back Close
Full Screen / Esc
Printer-friendly Version
Interactive Discussion
Discussion
P
a
per
|
Discussion
P
a
per
|
Discussion
P
a
per
|
Discussion
P
a
per
Babbin, A. R., Keil, R. G., Devol, A. H., and Ward, B. B.: Organic matter stoichiom-etry, flux, and oxygen control nitrogen loss in the ocean, Science, 344, 406–408, doi:10.1126/science.1248364, 2014.
Bange, H. W.: Air–sea exchange of nitrous oxide and methane in the Arabian Sea: a simple model of the seasonal variability, Indian J. Mar. Sci., 33, 77–83, 2004.
5
Bange, H. W.: Gaseous nitrogen compounds (NO, N2O, N2, NH3) in the ocean, in: Nitrogen in
the Marine Environment, 2nd edn., edited by: Capone, D. G., Bronk, D. A., Mulholland, M. R., and Carpenter, E. J., Academic Press/Elsevier, 51–94, 2008.
Bange, H. W., Freing, A., Kock, A., and Löscher, C. R.: Marine pathways to nitrous oxide, in: Nitrous Oxide and Climate Change, edited by: Smith, K., Earthscan, London, 36–62, 2010.
10
Canfield, D. E., Stewart, F. J., Thamdrup, B., De Brabandere, L., Dalsgaard, T., Delong, E. F., Revsbech, N. P., and Ulloa, O.: A cryptic sulfur cycle in oxygen-minimum-zone waters offthe Chilean coast, Science, 330, 1375–1378, doi:10.1126/science.1196889, 2010.
Castro-Gonzalez, M. and Farías, L.: N2O cycling at the core of the oxygen minimum zone off
northern Chile, Mar. Ecol.-Prog. Ser., 280, 1–11, doi:10.3354/meps280001, 2004.
15
Chang, B. X., Rich, J. R., Jayakumar, A., Naik, H., Pratihary, A. K., Keil, R. G., Ward, B. B., and Devol, A. H.: The effect of organic carbon on fixed nitrogen loss in the eastern tropical South Pacific and Arabian Sea oxygen deficient zones, Limnol. Oceanogr., 59, 1267–1274, doi:10.4319/lo.2014.59.4.1267, 2014.
Charpentier, J., Farias, L., Yoshida, N., Boontanon, N., and Raimbault, P.: Nitrous oxide
distribu-20
tion and its origin in the central and eastern South Pacific Subtropical Gyre, Biogeosciences, 4, 729–741, doi:10.5194/bg-4-729-2007, 2007.
Charpentier, J., Farías, L., and Pizarro, O.: Nitrous oxide fluxes in the central and eastern South Pacific, Global Biogeochem. Cy., 24, Gb3011, doi:10.1029/2008gb003388, 2010.
Ciais, P., Sabine, C. L., Bala, G., Bopp, L., Brovkin, V., Canadell, J., Chhabra, A., DeFries, R.,
25
Galloway, J. N., Heimann, M., Jones, C., Le Quéré, C., Myneni, R., Piao, S., and Thorn-ton, P.: Carbon and other biogeochemical cycles, in: Climate Change 2013: the Physical Science Basis. Contribution of Working Group I to the Fifth Assessment Report of the In-tergovernmental Panel on Climate Change, edited by: Stocker, T. F., Qin, D., Plattner, G.-K., Tignor, M., Allen, S. K., Boschung, J., Nauels, A., Xia, Y., Bex, V., and Midgley, P. M.,
Cam-30
bridge University Press, Cambridge, UK, New York, NY, USA, 465–570, 2013.
Codispoti, L. A.: Interesting times for marine N2O, Science, 327, 1339–1340,
BGD
12, 10167–10193, 2015
Differences between coastal and open ocean distributions
of N2O
A. Kock et al.
Title Page
Abstract Introduction
Conclusions References
Tables Figures
◭ ◮
◭ ◮
Back Close
Full Screen / Esc
Printer-friendly Version
Interactive Discussion
Discussion
P
a
per
|
Discussion
P
a
per
|
Discussion
P
a
per
|
Discussion
P
a
per
|
Codispoti, L. A. and Christensen, J. P.: Nitrification, denitrification and nitrous oxide cycling in the eastern tropical South Pacific Ocean, Mar. Chem., 16, 277–300, 1985.
Codispoti, L. A., Friederich, G. E., Packard, T. T., Glover, H. E., Kelly, P. J., Spinrad, R. W., Barber, R. T., Elkins, J. W., Ward, B. B., Lipschultz, F., and Lostaunau, N.: High nitrite levels offnorthern Peru: a signal of instability in the marine denitrification rate, Science, 233, 1200–
5
1202, 1986.
Cornejo, M. and Farías, L.: Following the N2O consumption in the oxygen minimum zone of the
eastern South Pacific, Biogeosciences, 9, 3205–3212, doi:10.5194/bg-9-3205-2012, 2012. Dalsgaard, T., Stewart, F. J., Thamdrup, B., De Brabandere, L., Revsbech, N. P., Ulloa, O.,
Can-field, D. E., and DeLong, E. F.: Oxygen at nanomolar levels reversibly suppresses process
10
rates and gene expression in anammox and denitrification in the oxygen minimum zone off
Northern Chile, Mbio, 5, e01966-14, doi:10.1128/mBio.01966-14, 2014.
De Wilde, H. P. J. and Helder, W.: Nitrous oxide in the Somali Basin: the role of upwelling, Deep-Sea Res. Pt. II, 44, 1319–1340, doi:10.1016/S0967-0645(97)00011-8, 1997.
Deutsch, C., Sarmiento, J. L., Sigman, D. M., Gruber, N., and Dunne, J. P.: Spatial coupling of
15
nitrogen inputs and losses in the ocean, Nature, 445, 163–167, doi:10.1038/nature05392, 2007.
Farías, L., Paulmier, A., and Gallegos, M.: Nitrous oxide and N-nutrient cycling in the oxygen minimum zone off northern Chile, Deep-Sea Res. Pt. I, 54, 164–180, doi:10.1016/j.dsr.2006.11.003, 2007.
20
Farías, L., Besoain, V., and García-Loyola, S.: Presence of nitrous oxide hotspots in the coastal upwelling area off central Chile: an analysis of temporal variability based on ten years of a biogeochemical time series, Environ. Res. Lett., 10, 044017, doi:10.1088/1748-9326/10/4/04, 2015.
Fernandez, C., Farías, L., and Ulloa, O.: Nitrogen fixation in denitrified marine waters, Plos
25
One, 6, e20539 doi:10.1371/journal.pone.0020539, 2011.
Firestone, M. K., Firestone, R. B., and Tiedje, J. M.: Nitrous-oxide from soil den-itrification – factors controlling its biological production, Science, 208, 749–751, doi:10.1126/science.208.4445.749, 1980.
Forster, G., Upstill-Goddard, R. C., Gist, N., Robinson, C., Uher, G., and Woodward, E. M. S.:
30
Nitrous oxide and methane in the Atlantic Ocean between 50◦
N and 52◦
BGD
12, 10167–10193, 2015
Differences between coastal and open ocean distributions
of N2O
A. Kock et al.
Title Page
Abstract Introduction
Conclusions References
Tables Figures
◭ ◮
◭ ◮
Back Close
Full Screen / Esc
Printer-friendly Version
Interactive Discussion
Discussion
P
a
per
|
Discussion
P
a
per
|
Discussion
P
a
per
|
Discussion
P
a
per
Frame, C. H. and Casciotti, K. L.: Biogeochemical controls and isotopic signatures of nitrous oxide production by a marine ammonia-oxidizing bacterium, Biogeosciences, 7, 2695–2709, doi:10.5194/bg-7-2695-2010, 2010.
Freing, A., Wallace, D. W. R., Tanhua, T., Walter, S., and Bange, H. W.: North Atlantic production of nitrous oxide in the context of changing atmospheric levels, Global Biogeochem. Cy., 23,
5
GB4015, doi:10.1029/2009gb003472, 2009.
Freing, A., Wallace, D. W. R., and Bange, H. W.: Global oceanic production of nitrous oxide, Philos. T. R. Soc. B, 367, 1245–1255, doi:10.1098/rstb.2011.0360, 2012.
Friederich, G. E., Kelly, P. J., Codispoti, L. A., Spinrad, R. W., Kullenberg, G., Elkins, J. W., Kogelschatz, J., Packard, T. T., Lipschultz, F., Glover, H. E., Ward, B. B., and Smith, A. E.:
10
Microbial nitrogen transformations in the oxygen minimum zone offPeru, Bigelow Laboratory for Ocean Sciences, East Boothbay, ME, 1985.
Fuenzalida, R., Schneider, W., Garcés-Vargas, J., Bravo, L., and Lange, C.: Vertical and hori-zontal extension of the oxygen minimum zone in the eastern South Pacific Ocean, Deep-Sea Res. Pt. II, 56, 992–1003, 2009.
15
Galan, A., Faundez, J., Thamdrup, B., Francisco Santibanez, J., and Farías, L.: Temporal dynamics of nitrogen loss in the coastal upwelling ecosystem off central Chile: evidence of autotrophic denitrification through sulfide oxidation, Limnol. Oceanogr., 59, 1865–1878, doi:10.4319/lo.2014.59.6.1865, 2014.
Goreau, T. J., Kaplan, W. A., Wofsy, S. C., McElroy, M. B., Valois, F. W., and Watson, S. W.:
20
Production of NO−
2 and N2O by nitrifying bacteria at reduced concentrations of oxygen, Appl.
Environ. Microb., 40, 526–532, 1980.
Hamersley, M. R., Lavik, G., Woebken, D., Rattray, J. E., Lam, P., Hopmans, E. C., Sinninghe Damste, J. S., Krueger, S., Graco, M., Gutierrez, D., and Kuypers, M. M. M.: Anaerobic ammonium oxidation in the Peruvian oxygen minimum zone, Limnol. Oceanogr., 52, 923–
25
933, 2007.
Hansen, H. P. and Koroleff, F.: Determination of nutrients, in: Methods of Seawater Analysis, edited by: Grasshoff, K., Kremling, K., and Ehrhardt, M., Wiley-VCH, Weinheim, 159–228, 1999.
Hu, H., Bourbonnais, A., Larkum, J., Bange, H. W., and Altabet, M. A.: Nitrogen cycling in
shal-30
BGD
12, 10167–10193, 2015
Differences between coastal and open ocean distributions
of N2O
A. Kock et al.
Title Page
Abstract Introduction
Conclusions References
Tables Figures
◭ ◮
◭ ◮
Back Close
Full Screen / Esc
Printer-friendly Version
Interactive Discussion
Discussion
P
a
per
|
Discussion
P
a
per
|
Discussion
P
a
per
|
Discussion
P
a
per
|
IPCC: Climate Change 2013: the Physical Science Basis. Contribution of Working Group I to the Fifth Assessment Report of the Intergovernmental Panel on Climate Change, Cambridge, UK, New York, NY, 1535, 2013.
Jensen, M. M., Petersen, J., Dalsgaard, T., and Thamdrup, B.: Pathways, rates, and regulation of N2production in the chemocline of an anoxic basin, Mariager Fjord, Denmark, Mar. Chem.,
5
113, 102–113, doi:10.1016/j.marchem.2009.01.002, 2009.
Kalvelage, T., Jensen, M. M., Contreras, S., Revsbech, N. P., Lam, P., Guenter, M., LaRoche, J., Lavik, G., and Kuypers, M. M. M.: Oxygen sensitivity of anammox and coupled N-cycle pro-cesses in oxygen minimum zones, Plos One, 6, e29299 doi:10.1371/journal.pone.0029299, 2011.
10
Kalvelage, T., Lavik, G., Lam, P., Contreras, S., Arteaga, L., Löscher, C. R., Oschlies, A., Paulmier, A., Stramma, L., and Kuypers, M. M. M.: Nitrogen cycling driven by organic matter export in the South Pacific oxygen minimum zone, Nat. Geosci., 6, 228–234, doi:10.1038/ngeo1739, 2013.
Karstensen, J., Stramma, L., and Visbeck, M.: Oxygen minimum zones in the
15
eastern tropical Atlantic and Pacific oceans, Prog. Oceanogr., 77, 331–350, doi:10.1016/j.pocean.2007.05.009, 2008.
Kartal, B., Maalcke, W. J., de Almeida, N. M., Cirpus, I., Gloerich, J., Geerts, W., den Camp, H., Harhangi, H. R., Janssen-Megens, E. M., Francoijs, K. J., Stunnenberg, H. G., Keltjens, J. T., Jetten, M. S. M., and Strous, M.: Molecular mechanism of anaerobic ammonium oxidation,
20
Nature, 479, 127–130, doi:10.1038/nature10453, 2011.
Kock, A. and Bange, H. W.: Counting the ocean’s greenhouse gas emissions, EOS, 96, 10–13, doi:10.1029/2015EO023665, 2015.
Löscher, C. R., Grosskopf, T., Desai, F. D., Gill, D., Schunck, H., Croot, P. L., Schlosser, C., Neulinger, S. C., Pinnow, N., Lavik, G., Kuypers, M. M. M., LaRoche, J., and Schmitz, R. A.:
25
Facets of diazotrophy in the oxygen minimum zone waters offPeru, ISME J., 8, 2180–2192, doi:10.1038/ismej.2014.71, 2014.
Löscher, C. R., Kock, A., Könneke, M., LaRoche, J., Bange, H. W., and Schmitz, R. A.: Produc-tion of oceanic nitrous oxide by ammonia-oxidizing archaea, Biogeosciences, 9, 2419–2429, doi:10.5194/bg-9-2419-2012, 2012.
30
mini-BGD
12, 10167–10193, 2015
Differences between coastal and open ocean distributions
of N2O
A. Kock et al.
Title Page
Abstract Introduction
Conclusions References
Tables Figures
◭ ◮
◭ ◮
Back Close
Full Screen / Esc
Printer-friendly Version
Interactive Discussion
Discussion
P
a
per
|
Discussion
P
a
per
|
Discussion
P
a
per
|
Discussion
P
a
per
mum zones in the eastern tropical North Atlantic and eastern tropical South Pacific Oceans, Biogeosciences Discuss., 12, 4495–4556, doi:10.5194/bgd-12-4495-2015, 2015.
Morley, N., Baggs, E. M., Dorsch, P., and Bakken, L.: Production of NO, N2O and N2 by
ex-tracted soil bacteria, regulation by NO−
2 and O2 concentrations, FEMS Microbiol. Ecol., 65,
102–112, doi:10.1111/j.1574-6941.2008.00495.x, 2008.
5
Naqvi, S. W. A., Jayakumar, D. A., Narveka, P. V., Naik, H., Sarma, V. V. S. S., D’Souza, W., Joseph, S., and George, M. D.: Increased marine production of N2O due to intensifying
anoxia on the Indian continental shelf, Nature, 408, 346–349, 2000.
Naqvi, S. W. A., Naik, H., Pratihary, A., D’Souza, W., Narvekar, P. V., Jayakumar, D. A., De-vol, A. H., Yoshinari, T., and Saino, T.: Coastal versus open-ocean denitrification in the
Ara-10
bian Sea, Biogeosciences, 3, 621–633, doi:10.5194/bg-3-621-2006, 2006.
Naqvi, S. W. A., Bange, H. W., Farías, L., Monteiro, P. M. S., Scranton, M. I., and Zhang, J.: Marine hypoxia/anoxia as a source of CH4 and N2O, Biogeosciences, 7, 2159–2190,
doi:10.5194/bg-7-2159-2010, 2010.
Nevison, C., Butler, J. H., and Elkins, J. W.: Global distribution of N2O and the∆N2O-AOU yield
15
in the subsurface ocean, Global Biogeochem. Cy., 17, 1119 doi:10.1029/2003gb002068, 2003.
Nevison, C. D., Weiss, R. F., and Erickson, D. J.: Global oceanic emissions of nitrous oxide, J. Geophys. Res.-Oceans, 100, 15809–15820, 1995.
Nevison, C. D., Lueker, T. J., and Weiss, R. F.: Quantifying the nitrous oxide source from coastal
20
upwelling, Global Biogeochem. Cy., 18, GB1018 doi:10.1029/2003GB002110, 2004. Ni, B.-J., Peng, L., Law, Y., Guo, J., and Yuan, Z.: Modeling of nitrous oxide production by
au-totrophic ammonia-oxidizing bacteria with multiple production pathways, Environ. Sci. Tech-nol., 48, 3916–3924, doi:10.1021/es405592h, 2014.
Pierotti, D., and Rasmussen, R. A.: Nitrous-oxide measurements in the eastern tropical
Pacific-25
ocean, Tellus, 32, 56–72, 1980.
Ryabenko, E., Kock, A., Bange, H. W., Altabet, M. A., and Wallace, D. W. R.: Contrasting biogeo-chemistry of nitrogen in the Atlantic and Pacific Oxygen Minimum Zones, Biogeosciences, 9, 203–215, doi:10.5194/bg-9-203-2012, 2012.
Santoro, A. E., Buchwald, C., McIlvin, M. R., and Casciotti, K. L.: Isotopic signature
30
of N2O produced by marine ammonia-oxidizing archaea, Science, 333, 1282–1285,
BGD
12, 10167–10193, 2015
Differences between coastal and open ocean distributions
of N2O
A. Kock et al.
Title Page
Abstract Introduction
Conclusions References
Tables Figures
◭ ◮
◭ ◮
Back Close
Full Screen / Esc
Printer-friendly Version
Interactive Discussion
Discussion
P
a
per
|
Discussion
P
a
per
|
Discussion
P
a
per
|
Discussion
P
a
per
|
Schafstall, J., Dengler, M., Brandt, P., and Bange, H.: Tidal-induced mixing and diapycnal nu-trient fluxes in the Mauritanian upwelling region, J. Geophys. Res.- Oceans, 115, C10014 doi:10.1029/2009jc005940, 2010.
Schunck, H., Lavik, G., Desai, D. K., Grosskopf, T., Kalvelage, T., Löscher, C. R., Paulmier, A., Contreras, S., Siegel, H., Holtappels, M., Rosenstiel, P., Schilhabel, M. B., Graco, M.,
5
Schmitz, R. A., Kuypers, M. M. M., and LaRoche, J.: Giant hydrogen sulfide plume in the oxygen minimum zone off Peru supports chemolithoautotrophy, Plos One, 8, e68661 doi:10.1371/journal.pone.0068661, 2013.
Stein, L. Y.: Surveying N2O-producing pathways in bacteria, in: Methods in Enzymology: Re-search on Nitrification and Related Processes, Vol. 486, Part A, edited by: Klotz, M. G.,
10
Methods in Enzymology, 131–152, 2011.
Stieglmeier, M., Mooshammer, M., Kitzler, B., Wanek, W., Zechmeister-Boltenstern, S., Richter, A., and Schleper, C.: Aerobic nitrous oxide production through N-nitrosating hybrid formation in ammonia-oxidizing archaea, ISME J., 8, 1135–1146, doi:10.1038/ismej.2013.220, 2014.
15
Suntharalingam, P. and Sarmiento, J. L.: Factors governing the oceanic nitrous oxide distri-bution: simulations with an ocean general circulation model, Global Biogeochem. Cy., 14, 429–454, doi:10.1029/1999gb900032, 2000.
Thamdrup, B., Dalsgaard, T., Jensen, M. M., Ulloa, O., Farías, L., and Escribano, R.: Anaerobic ammonium oxidation in the oxygen-deficient waters offnorthern Chile, Limnol. Oceanogr.,
20
51, 2145–2156, 2006.
Thamdrup, B., Dalsgaard, T., and Revsbech, N. P.: Widespread functional anoxia in the oxygen minimum zone of the Eastern South Pacific, Deep-Sea Res. Pt. I, 65, 36–45, doi:10.1016/j.dsr.2012.03.001, 2012.
Thomsen, S., Kanzow, T., Krahmann, G., Greatbatch, R. J., Dengler, M., and Lavik, G.: The
25
formation of a subsurface anticyclonic eddy in the Peru-Chile Undercurrent and its impact on the near-coastal distribution of salinity and oxygen, J. Geophys. Res.-Oceans, under review, 2015.
Upstill-Goddard, R. C., Barnes, J., and Owens, N. J. P.: Nitrous oxide and methane during the 1994 SW monsoon in the Arabian Sea/northwestern Indian Ocean, J. Geophys.
Res.-30
Oceans, 104, 30067–30084, doi:10.1029/1999jc900232, 1999.
BGD
12, 10167–10193, 2015
Differences between coastal and open ocean distributions
of N2O
A. Kock et al.
Title Page
Abstract Introduction
Conclusions References
Tables Figures
◭ ◮
◭ ◮
Back Close
Full Screen / Esc
Printer-friendly Version
Interactive Discussion
Discussion
P
a
per
|
Discussion
P
a
per
|
Discussion
P
a
per
|
Discussion
P
a
per
Walter, S., Bange, H. W., Breitenbach, U., and Wallace, D. W. R.: Nitrous oxide in the North Atlantic Ocean, Biogeosciences, 3, 607–619, doi:10.5194/bg-3-607-2006, 2006.
Ward, B. B., Devol, A. H., Rich, J. J., Chang, B. X., Bulow, S. E., Naik, H., Pratihary, A., and Jayakumar, A.: Denitrification as the dominant nitrogen loss process in the Arabian Sea, Nature, 461, 78–81, doi:10.1038/nature08276, 2009.
5
Weiss, R. F. and Price, B. A.: Nitrous oxide solubility in water and seawater, Mar. Chem., 8, 347–359, 1980.
WMO: Scientific Assessment of Ozone Depletion: 2010, Global Ozone Research and Monitor-ing Project, Geneva, Switzerland, 2011.
Yu, R., Kampschreur, M. J., van Loosdrecht, M. C. M., and Chandran, K.: Mechanisms and
10
specific directionality of autotrophic nitrous oxide and nitric oxide generation during transient anoxia, Environ. Sci. Technol., 44, 1313–1319, doi:10.1021/es902794a, 2010.
Zamora, L. M. and Oschlies, A.: Surface nitrification: a major uncertainty in marine N2O
emis-sions, Geophys. Res. Lett., 2014, GL060556, doi:10.1002/2014gl060556, 2014.
Zamora, L. M., Oschlies, A., Bange, H. W., Huebert, K. B., Craig, J. D., Kock, A., and
15
BGD
12, 10167–10193, 2015
Differences between coastal and open ocean distributions
of N2O
A. Kock et al.
Title Page
Abstract Introduction
Conclusions References
Tables Figures
◭ ◮
◭ ◮
Back Close
Full Screen / Esc
Printer-friendly Version
Interactive Discussion
Discussion
P
a
per
|
Discussion
P
a
per
|
Discussion
P
a
per
|
Discussion
P
a
per
|
BGD
12, 10167–10193, 2015
Differences between coastal and open ocean distributions
of N2O
A. Kock et al.
Title Page
Abstract Introduction
Conclusions References
Tables Figures
◭ ◮
◭ ◮
Back Close
Full Screen / Esc
Printer-friendly Version
Interactive Discussion
Discussion
P
a
per
|
Discussion
P
a
per
|
Discussion
P
a
per
|
Discussion
P
a
per
Figure 2.Spatial distributions of oxygen(a, b), nitrite(c, d)and N2O(e, f)along 86
◦
BGD
12, 10167–10193, 2015
Differences between coastal and open ocean distributions
of N2O
A. Kock et al.
Title Page
Abstract Introduction
Conclusions References
Tables Figures
◭ ◮
◭ ◮
Back Close
Full Screen / Esc
Printer-friendly Version
Interactive Discussion
Discussion
P
a
per
|
Discussion
P
a
per
|
Discussion
P
a
per
|
Discussion
P
a
per
|
Figure 3.Cross-shelf distribution of(a)Oxygen,(b)Phosphate, (c)Nitrate,(d)N′
BGD
12, 10167–10193, 2015
Differences between coastal and open ocean distributions
of N2O
A. Kock et al.
Title Page
Abstract Introduction
Conclusions References
Tables Figures
◭ ◮
◭ ◮
Back Close
Full Screen / Esc
Printer-friendly Version
Interactive Discussion
Discussion
P
a
per
|
Discussion
P
a
per
|
Discussion
P
a
per
|
Discussion
P
a
per
Figure 4.Selected depth profiles of oxygen (black dots, dotted line), sigma-theta (grey line) and N2O (red line, open circles) (left panel) and nitrate (grey line), nitrite (black circles, dotted line) and N′
BGD
12, 10167–10193, 2015
Differences between coastal and open ocean distributions
of N2O
A. Kock et al.
Title Page
Abstract Introduction
Conclusions References
Tables Figures
◭ ◮
◭ ◮
Back Close
Full Screen / Esc
Printer-friendly Version
Interactive Discussion
Discussion
P
a
per
|
Discussion
P
a
per
|
Discussion
P
a
per
|
Discussion
P
a
per
|
Figure 5.∆N2O/AOU relationship from(a)offshore cruises (M77-4 (circles), M90 (diamonds))
and(b)near-shore cruises (M77-3 (open diamonds), M91 (open circles), M92 (filled circles), M93 (filled diamonds)). Samples from the upper OMZ and oxycline (sample depth<350 m) are color-coded with N′
. The black line denotes the∆N2O/AOU relationship from the M77-4
and M90 data for samples with O2>50 µM and depth<350 m (y=0.118x+4.29;r 2
=0.773). Please note the change in the scaling for∆N2O values of 0–100 nM and 100–1000 nM (dotted