BGD
12, 13887–13929, 2015
Evaluating sensitivity of silicate mineral
dissolution rates
E. Opolot and P. A. Finke
Title Page
Abstract Introduction
Conclusions References
Tables Figures
◭ ◮
◭ ◮
Back Close
Full Screen / Esc
Printer-friendly Version Interactive Discussion
Discussion
P
a
per
|
Discussion
P
a
per
|
Discussion
P
a
per
|
Discussion
P
a
per
|
Biogeosciences Discuss., 12, 13887–13929, 2015 www.biogeosciences-discuss.net/12/13887/2015/ doi:10.5194/bgd-12-13887-2015
© Author(s) 2015. CC Attribution 3.0 License.
This discussion paper is/has been under review for the journal Biogeosciences (BG). Please refer to the corresponding final paper in BG if available.
Evaluating sensitivity of silicate mineral
dissolution rates to physical weathering
using a soil evolution model (SoilGen2.25)
E. Opolot and P. A. Finke
Department of Geology and Soil Science, Ghent University, Krijgslaan 281, 9000 Ghent, Belgium
Received: 7 July 2015 – Accepted: 17 August 2015 – Published: 26 August 2015 Correspondence to: E. Opolot ([email protected]) and P. A. Finke ([email protected])
Published by Copernicus Publications on behalf of the European Geosciences Union.
BGD
12, 13887–13929, 2015
Evaluating sensitivity of silicate mineral
dissolution rates
E. Opolot and P. A. Finke
Title Page
Abstract Introduction
Conclusions References
Tables Figures
◭ ◮
◭ ◮
Back Close
Full Screen / Esc
Printer-friendly Version Interactive Discussion
Discussion
P
a
per
|
Discussion
P
a
per
|
Discussion
P
a
per
|
Discussion
P
a
per
|
Abstract
Silicate mineral dissolution rates depend on the interaction of a number of factors cat-egorized either as intrinsic (e.g. mineral surface area, mineral composition) or extrinsic (e.g. climate, hydrology, biological factors, physical weathering). Estimating the inte-grated effect of these factors on the silicate mineral dissolution rates therefore
necessi-5
tates the use of fully mechanistic soil evolution models. This study applies a mechanis-tic soil evolution model (SoilGen) to explore the sensitivity of silicate mineral dissolution rates to the integrated effect of other soil forming processes and factors. The SoilGen soil evolution model is a 1-D model developed to simulate the time-depth evolution of soil properties as a function of various soil forming processes (e.g. water, heat and
10
solute transport, chemical and physical weathering, clay migration, nutrient cycling and bioturbation) driven by soil forming factors (i.e., climate, organisms, relief, parent ma-terial). Results from this study show that although soil solution chemistry (pH) plays a dominant role in determining the silicate mineral dissolution rates, all processes that directly or indirectly influence the soil solution composition equally play an important
15
role in driving silicate mineral dissolution rates. Model results demonstrated a decrease of silicate mineral dissolution rates with time, an obvious effect of texture and an indi-rect but substantial effect of physical weathering on silicate mineral dissolution rates. Results further indicated that clay migration and plant nutrient recycling processes in-fluence the pH and thus the silicate mineral dissolution rates. Our silicate mineral
dis-20
solution rates results fall between field and laboratory rates but were rather high and more close to the laboratory rates owing to the assumption of far from equilibrium re-action used in our dissolution rate mechanism. There is therefore need to include sec-ondary mineral precipitation mechanism in our formulation. In addition, there is need for a more detailed study that is specific to field sites with detailed measurements of
25
chem-BGD
12, 13887–13929, 2015
Evaluating sensitivity of silicate mineral
dissolution rates
E. Opolot and P. A. Finke
Title Page
Abstract Introduction
Conclusions References
Tables Figures
◭ ◮
◭ ◮
Back Close
Full Screen / Esc
Printer-friendly Version Interactive Discussion
Discussion
P
a
per
|
Discussion
P
a
per
|
Discussion
P
a
per
|
Discussion
P
a
per
|
ical weathering in order to explain differences observed between laboratory and field measured silicate mineral dissolution rates.
1 Introduction
Silicate mineral weathering is the major source of most plant nutrients in soils (Carey et al., 2005; Hartmann et al., 2014) and it is probably the foremost process controlling soil
5
production rates (Anderson et al., 2007; Dixon and von Blanckenburg, 2012). Silicate mineral dissolution rates also have implications on acidification in forest soils (Phelan et al., 2014) and carbon sequestration (Beaulieu et al., 2011; Goddéris et al., 2013; Pham et al., 2011). Quantifying the rates of silicate mineral dissolution is therefore of utmost importance to answer many environmental questions such as the surface and
10
groundwater composition, the supply of macronutrients (e.g K and Ca ) in forests and the neutralization of acid precipitation (Ganor et al., 2007).
Indeed a lot of work has been devoted to quantifying silicate mineral dissolution rates using both laboratory experiments (Blum and Stillings,1995; Chou and Wollast, 1985; Knauss and Wolrey, 1986; Lee et al., 1998; Stillings and Brantley, 1995; Zhu
15
and Lu 2009) and field experiments (Maher et al., 2009; Parry et al., 2015; White and Brantley, 2003; White et al., 1996; White, 2003, 2002). One common conclusion from most of these studies is that a discrepancy of up to 5 orders of magnitude (Oliva et al., 2003; Parry et al., 2015; White et al., 1996; Zhu, 2005) does exist between labo-ratory and field weathering rates. There seems to be a general consensus that these
20
differences may be explained by (i) changes in fluid composition (ii) changes in pri-mary mineral surfaces (reactive sites) (iii) the formation of secondary phases (iv) effi -ciency of solution/mineral contact and, (v) the composition of the soil solution in micro pores. White (2002) grouped these factors into two; intrinsic (e.g. mineral composi-tion, surface area) and extrinsic factors (e.g. solution composicomposi-tion, climate, biological
25
processes). All these five factors could slow field weathering rates compared to labo-ratory experiments where most of the physical, biological and chemical conditions can
BGD
12, 13887–13929, 2015
Evaluating sensitivity of silicate mineral
dissolution rates
E. Opolot and P. A. Finke
Title Page
Abstract Introduction
Conclusions References
Tables Figures
◭ ◮
◭ ◮
Back Close
Full Screen / Esc
Printer-friendly Version Interactive Discussion
Discussion
P
a
per
|
Discussion
P
a
per
|
Discussion
P
a
per
|
Discussion
P
a
per
|
be constrained (White and Brantley, 2003). In general the integrated effects of these intrinsic and extrinsic factors are complex and certainly difficult to capture both in the field and in the laboratory experiments. Moreover uncertainty in the extrinsic factors that occurred and varied in the past is difficult to constrain in experiments (Moore et al., 2012; White and Brantley, 2003).
5
Modelling approaches enhanced by an understanding of silicate kinetic rates and mechanisms from the experimental works are therefore essential to facilitate in the quantification of silicate dissolution rates (Beaulieu et al., 2011; Goddéris et al., 2006; Hellevang et al., 2013; Roelandt et al., 2010; Stendahl et al., 2013). However, in only a few of these modelling approaches (Goddéris et al., 2006; Maher et al., 2009; Moore
10
et al., 2012) has the integrated effect of some intrinsic and extrinsic factors on silicate mineral dissolution rates been investigated. There is need for mechanistic models ca-pable of simulating the integrated effect of physical, biological and chemical soil forming processes on chemical weathering rates. Such coupling will give the possibilities to de-termine the role played by intrinsic and extrinsic factors and explain the differences
15
in dissolution rates observed in the laboratory and field experiments (Goddéris et al., 2006; Hartmann et al., 2014; Moore et al., 2012).
The objective of this work is to explore the integrated effect of other soil forming pro-cesses on the silicate mineral dissolution rates with particular emphasis on physical weathering. The relationship between particle size distribution and chemical mineral
20
weathering is well known. Holding other factors constant (e.g. pH), the smaller the grain size the larger the surface area per unit mass and consequently the higher the rate of chemical weathering (Hartmann et al., 2014). In most cases, a constant grain size distribution has been assumed when estimating weathering rates, this assumption could be invalid especially when looking at longer time scales. This contribution applies
25
dis-BGD
12, 13887–13929, 2015
Evaluating sensitivity of silicate mineral
dissolution rates
E. Opolot and P. A. Finke
Title Page
Abstract Introduction
Conclusions References
Tables Figures
◭ ◮
◭ ◮
Back Close
Full Screen / Esc
Printer-friendly Version Interactive Discussion
Discussion
P
a
per
|
Discussion
P
a
per
|
Discussion
P
a
per
|
Discussion
P
a
per
|
solution rates to other soil forming processes. Specific objectives are to (i) asses the effects of parent material composition on the silicate mineral dissolution rates, (ii) to asses model sensitivity of chemical silicate mineral dissolution rates to change in soil texture, (iii) to assess the effect of physical weathering of primary minerals on their dis-solution rates, (iv) to assess the effect of interactive soil forming processes on silicate
5
mineral dissolution rates and (v) to compare our modelled silicate mineral dissolution rates to rates reported in literature.
2 Materials and methods
2.1 Study area
This is a sensitivity test study that is not specific to any location. However choice
10
was made to do this study in the forested loess soils, in the Zonian forest, Belgium (50◦46’31”N, 4◦24’9”E) primarily because the soil forming processes (clay migration, physical weathering, decalcification, carbon-cycling) in the model have already been calibrated to this site (Finke and Hutson, 2008; Finke, 2012; Opolot et al., 2015; Yu et al., 2013). In addition, the measured soil data (Finke, 2012; van Ranst, 1981) and other
15
reconstructed model input data (Finke and Hutson, 2008) were readily available for this site.
2.2 Research set up
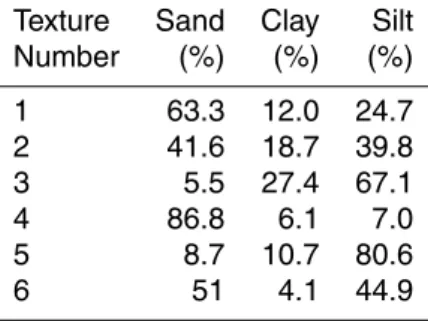
As the objective (1 and 2) of this study is also to assess the sensitivity of silicate weath-ering rates to differences in parent material and soil texture, the research set up (Fig. 1)
20
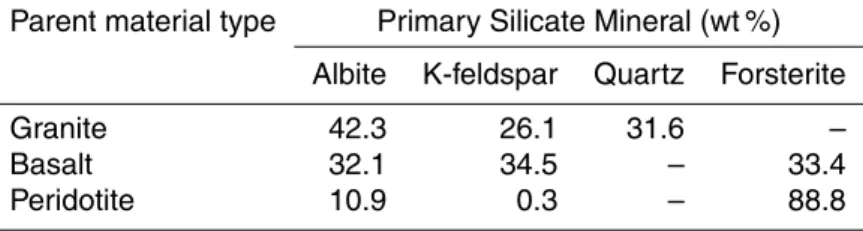
is such that different initial textures and mineralogy are captured. Therefore rather than using texture and soil mineralogy measurement from the study site, 6 different texture points were randomly selected from the USDA textural triangle to represent the initial soil texture. Three different parent materials (granite, basalt and peridotite) were se-lected in such a way that slow (felsic igneous rock), moderate (mafic igneous rock)
25
BGD
12, 13887–13929, 2015
Evaluating sensitivity of silicate mineral
dissolution rates
E. Opolot and P. A. Finke
Title Page
Abstract Introduction
Conclusions References
Tables Figures
◭ ◮
◭ ◮
Back Close
Full Screen / Esc
Printer-friendly Version Interactive Discussion
Discussion
P
a
per
|
Discussion
P
a
per
|
Discussion
P
a
per
|
Discussion
P
a
per
|
and fast weathering (ultramafic) rocks were taken into account. The geochemical data (oxide weight composition) typical of granite, basalt and peridotite was obtained from lit-erature (Harris et al., 1967; Hartmann et al., 2013) and the mineralogical compositions were estimated from these geochemical data using the normative mineralogy calcula-tion method (Cross et al., 1902; Kelsey, 1965). Only primary minerals were considered
5
at this stage and their weight compositions were rescaled to sum up to one.
At this stage two scenarios (with physical weathering, PhyWE and without physical weathering, NoPhyWE) were defined but in two different model setups (Model A and Model B; Fig. 1). Model setup 1, hereafter referred to as Model A is intended to simu-late majorly the effect of change in particle size (due to physical weathering process) on
10
silicate weathering rates and therefore the effects of other processes (clay migration, carbon-cycling, bioturbation) on silicate weathering rates are minimized by deactivating these processes in this model set up. Model setup 2, hereafter referred to as Model B was intended to simulate the interactive effect of other soil forming processes (includ-ing physical weather(includ-ing, clay migration, carbon-cycl(includ-ing, plant uptake, bioturbation) on
15
silicate weathering rates and therefore all these processes are active. The soil forming processes included in the SoilGen and input data are briefly discussed in the sub-sequent sections. In total, 72 cases were run in the SoilGen model (i.e 2 set ups ∗2 scenarios∗6 texture points∗3 parent materials).
The output parameters from the model include soil texture (% mass fraction of clay,
20
silt and sand), pH, base saturation, weathering indices, mass of each mineral remain-ing, etc. For this study the outputs of interest extracted included pH, clay mass fraction and mineral mass. The mass of each mineral remaining after the simulation period (15 000 years) was used to calculate the respective dissolution rates of each mineral and was the basis for the sensitivity analysis as will be explained in the subsequent
25
BGD
12, 13887–13929, 2015
Evaluating sensitivity of silicate mineral
dissolution rates
E. Opolot and P. A. Finke
Title Page
Abstract Introduction
Conclusions References
Tables Figures
◭ ◮
◭ ◮
Back Close
Full Screen / Esc
Printer-friendly Version Interactive Discussion
Discussion
P
a
per
|
Discussion
P
a
per
|
Discussion
P
a
per
|
Discussion
P
a
per
|
2.3 The SoilGen model
SoilGen model is a 1-D model designed to simulate time – depth evolution of soil prop-erties as a function of interactive soil forming processes (majorly driven by the soil forming factors (“CLORPT”): climate, living organisms, relief, parent material, time). The governing processes in the model include unsaturated water flow simulated using
5
Richard’s equation, heat flow described following heat flow equation, and solute trans-port described by convection-dispersion equation (CDE). Other processes described in the model include carbon cycling (based on RothC 26.3 approach; Jenkinson and Cole-man, 1994 but applied per soil compartment in SoilGen), clay migration, bioturbation, chemical and physical weathering, and biogeochemical recycling by plants (Finke and
10
Hutson, 2008; Finke, 2012).The model has successfully been applied in several case studies e.g., to simulate clay migration in forest and agricultural land uses in northern France (Finke et al., 2015), to reconstruct soil properties (texture, bulk density, calcite content, pH and OC %) for archaeological land evaluation (Zwertvaegher et al., 2013), to estimate the effect of bioturbation (due to tree fall) on soil horizon thickness (Finke et
15
al., 2013), to test how well soil development would be described by modelling (Sauer et al., 2012), to explain the effect of slope and exposition on soil properties and decalci-fication depth (Finke, 2012), and to assess the effect of varying climate on calcareous loess soils (Finke and Hutson, 2008). In general, the coupling of major soil interacting processes (biological, chemical and physical) in the SoilGen model makes its
applica-20
tion domain versatile. State of art overview of the SoilGen model including simulated processes, data requirements, calibration and quality test studies have been presented in (Opolot et al., 2015) and are not discussed in details here. Physical and chemical weathering processes that form the basis of this study are however explained in details in the subsequent subsections.
25
BGD
12, 13887–13929, 2015
Evaluating sensitivity of silicate mineral
dissolution rates
E. Opolot and P. A. Finke
Title Page
Abstract Introduction
Conclusions References
Tables Figures
◭ ◮
◭ ◮
Back Close
Full Screen / Esc
Printer-friendly Version Interactive Discussion
Discussion
P
a
per
|
Discussion
P
a
per
|
Discussion
P
a
per
|
Discussion
P
a
per
|
2.3.1 Physical weathering
Physical weathering in SoilGen is defined as the stochastic process through which soil particles are split up into smaller particle sizes due to strain caused by temperature gradients. The process of physical weathering consequently leads to the reduction in grain size, producing material in the clay fraction that may be moved by clay migration
5
(Finke, 2012).
As a starting point, the fine earth fraction is divided into particle size classes with boundaries at 2048-1024-512-256-128-64-32-16-8-4-2 µm. It is assumed that all par-ticles are cubes and have an edge size halfway between the class limits: 1536, 768, 384, 192, 96, 48, 24, 12, 6, 3, and 1 µm. In principle, each particle has to be split in half
10
up to 7 times to attain 8 equally sized particles in the next smaller particle size class. The splitting probability of each particle,Ps is assumed to follow Bernoulli process and
depends on the temperature gradient over a certain time interval, dt(Finke, 2012):
Ps=
Ps,max if
dT
dt > B Ps,max×ddTt
B if
dT
dt ≤B
(1)
where, B is a threshold temperature gradient over dt where Ps,max is maximal, T is
15
the temperature and Ps,max is the maximal split probability. Ps,max and B are normally
subjected to calibration in conjunction with parameters that describe clay migration (Finke et al., 2015).
The expected number of the potential splitting events, E (N) that are needed to achieve successful splits,m (i.e.,m=7) are assumed to follow the negative binomial
20
distribution and are defined as:
E(N)=m
Ps
BGD
12, 13887–13929, 2015
Evaluating sensitivity of silicate mineral
dissolution rates
E. Opolot and P. A. Finke
Title Page
Abstract Introduction
Conclusions References
Tables Figures
◭ ◮
◭ ◮
Back Close
Full Screen / Esc
Printer-friendly Version Interactive Discussion
Discussion
P
a
per
|
Discussion
P
a
per
|
Discussion
P
a
per
|
Discussion
P
a
per
|
Thus the number of grains, S in any particle size class i that is split in time dt is obtained from Eq. (3):
Si,dt=min ki,t−dtki,t−dt/E(N) (3) where,ki,t−dt is the number of grains in particle size class at the start of dt andki,tis defined as:
5
ki,t=ki,t−d t−a×Si,dt+b×8×Si−1,dt (4) where,a=0 for clay fraction (i =11) anda=1 else;b=0 for the coarsest sand fraction (i =1) andb=1 else (Finke, 2012).
It has to be noted that physical weathering in SoilGen is assumed to be caused solely by temperature fluctuations and other mechanical processes that result into the
10
breakup of bedrock (e.g. by plant roots) are not modelled. The splitting of gravel-sized particles is yet to be included in the description of physical weathering and this currently limits the use of the SoilGen model to unconsolidated, non-gravelly deposits (Opolot et al., 2015).
2.3.2 Chemical weathering
15
The weathering mechanism that is implemented here (i.e., in SoilGen2.25) is diff er-ent from the mechanism that has been used in the previous version of the SoilGen model (SoilGen2.24). The previous chemical weathering module (unweathered phase) of SoilGen considers four most common primary minerals (Anorthite, Chlorite, Micro-cline, Albite) that respectively release Ca, Mg, K, and Na. Congruent weathering of
20
Anorthite, Chlorite, Microcline and Albite release Al. Detailed mechanism is already presented in (Opolot et al., 2015; Sect. 2.1.2). In general the approach is based on the acidification models and takes only a few minerals into account. There was need to ex-tend this module to allow simulation of chemical weathering of a wider range of primary minerals such that more chemical species may be simulated (Opolot et al., 2015). The
25
BGD
12, 13887–13929, 2015
Evaluating sensitivity of silicate mineral
dissolution rates
E. Opolot and P. A. Finke
Title Page
Abstract Introduction
Conclusions References
Tables Figures
◭ ◮
◭ ◮
Back Close
Full Screen / Esc
Printer-friendly Version Interactive Discussion
Discussion
P
a
per
|
Discussion
P
a
per
|
Discussion
P
a
per
|
Discussion
P
a
per
|
extended chemical weathering system presented here is based on the transition state theory and similar to the approaches already presented in other weathering models e.g. Sverdrup and Warfringe (1995) and Goddéris et al. (2006).
The release rate of cation,i from all the k minerals, ri,k (mol m
−2
s−1) can be com-puted as:
5
ri,k=
XN
k=1Akvi,krkmkt (5)
where Ak (m2mol−1) is the specific surface area of the kth mineral, vi,k (−) is the stoichiometric number of theith element in mineralkandrk(mol m−2s−1) is the disso-lution rate constant of thekth mineral.mkis the amount of thekth mineral in the parent material expressed in (mol m−3soil) andt(m) is the thickness of the soil compartment
10
(=0.05 m in SoilGen).
The total surface area of soil minerals, Aj (m2g−1) can be obtained based on the percentage fractions of sand, silt and clay (Eq. 6; Sverdrup and Warfvinge, 1993). The individual reactive areaAkis obtained as a product of weight composition ofkth (kcomp)
mineral andAj.Akis again multiplied by the relative formula mass of the mineral (kRFM,
15
g mol−1) to give the mineral area,Ak in m
2
mol−1(Eq. 7):
Aj =8xclay+2.2xsilt+0.3xsand+0xcoarse (6)
Coefficients 8, 2.2 and 0.3 represent the specific surface areas (m2g−1) of clay, silt and fine sand (<256 µm) sized particles, respectively.
Ak=Aj×kcomp×kRFM (7)
20
BGD
12, 13887–13929, 2015
Evaluating sensitivity of silicate mineral
dissolution rates
E. Opolot and P. A. Finke
Title Page
Abstract Introduction
Conclusions References
Tables Figures
◭ ◮
◭ ◮
Back Close
Full Screen / Esc
Printer-friendly Version Interactive Discussion
Discussion
P
a
per
|
Discussion
P
a
per
|
Discussion
P
a
per
|
Discussion
P
a
per
|
considerably been criticised (e.g Hodson et al., 1997), partly because of the use of this equation to estimate the mineral reactive area. The accurate estimation of reactive mineral surface area in natural environments is still a subject of considerable debate (e.g. Hodson et al., 1997; Brantley et al., 2008). Nevertheless the use of Eq. (6) along with experimental dissolution rates normalized to the BET surface area, allows for the
5
good estimation of mineral surface area in natural environments (Sverdrup and War-fvinge, 1995). This function is therefore still widely used as a reasonable first estimate of mineral surface areas (Goddéris et al., 2006; Gudbrandsson et al., 2011; Koptsik et al., 1999; Koseva et al., 2010; Phelan et al., 2014; Stendahl et al., 2013; Violette et al., 2010; Whitfield et al., 2010).
10
The dissolution rate of most silicate minerals,rk at far from equilibrium conditions is calculated as a function of pH (Eq. 8), based on laboratory kinetic laws derived from the concept of transition state theory (Eyring, 1935; Brantley et al.,2008).
rk=kHanH++kH2O+kOHamOH− (8) wherekHandkOHare mineral dissolution rate constants at acidic and basic conditions,
15
respectively. The parameterskHandkOHhave to be corrected for temperature (Eqs. 9
and 10).aH+ and aOH− are activities of H+ and OH−, respectively and superscripts n andmdenote the reaction orders.kH2O is a parameter describing the dissolution rate
at neutral pH and was not considered in the implementation because at neutral con-ditions the dissolution rate of silicates is so slow that this term makes an insignificant
20
contribution to the overall silicate dissolution rate (Brantley, 2003).
kH
kH25
=exp "
kEaH
R
1 298.15−
1
T
#
(9)
kOH kOH25
=exp "
kEaOH
R
1 298.15−
1
T
#
(10)
BGD
12, 13887–13929, 2015
Evaluating sensitivity of silicate mineral
dissolution rates
E. Opolot and P. A. Finke
Title Page
Abstract Introduction
Conclusions References
Tables Figures
◭ ◮
◭ ◮
Back Close
Full Screen / Esc
Printer-friendly Version Interactive Discussion
Discussion
P
a
per
|
Discussion
P
a
per
|
Discussion
P
a
per
|
Discussion
P
a
per
|
where kH25 and kOH25 are measured dissolution rate constants at 25
◦
C (298.15 K),
kEaOH,kEaH (KJ mol
−1
K−1) are the activation energies of a kth mineral at acidic and basic conditions, respectively andR is a gas constant (0.00831446 KJ mol−1K−1).T
is absolute soil temperature (K) and it is simulated in the model.
2.4 Model input data
5
The SoilGen model was designed keeping in mind the generally accepted paradigm that soil is a function of soil forming factors; “CLORPT” (Jenny, 1941). Therefore the model uses these factors either as initial conditions (e.g mineralogy, texture) or bound-ary conditions (e.g. climate, vegetation, biortubation, slope and exposition). The initial conditions specify to the model the initial soil properties at the beginning of the
simu-10
lations and are usually assumed to be equal to the soil properties from the analysis of samples taken from the C – horizon. Initial texture and mineralogy used in this study are shown in Tables 1 and 2, respectively. Other initial soil properties (e.g. initial OC %, bulk density, solution and exchange surface chemistry), and boundary conditions (Fig. 2) were taken from Finke (2012).
15
2.5 Calculating average silicate dissolution rates
Silicate mineral dissolution rate usually reported in units of mol m−2s−1 is defined as the amount of mineral (moles) that is released in form of constituent elements per unit area (e.g., cm2, m2 or ha) or volume (cm3, m3) over a given period time. Similar to the approach used in (White and Brantley, 2003), congruent weathering was assumed
20
and the moles of each cation released during silicate mineral dissolution was based on the stoichiometric coefficient of that particular element in the mineral. To calculate the dissolution rate of a given mineral, the amount of mineral (mass per unit volume) remaining after defined simulation period was subtracted from the respective amount of each mineral initially present. This difference was then converted to mol m−2 by
25
BGD
12, 13887–13929, 2015
Evaluating sensitivity of silicate mineral
dissolution rates
E. Opolot and P. A. Finke
Title Page
Abstract Introduction
Conclusions References
Tables Figures
◭ ◮
◭ ◮
Back Close
Full Screen / Esc
Printer-friendly Version Interactive Discussion
Discussion
P
a
per
|
Discussion
P
a
per
|
Discussion
P
a
per
|
Discussion
P
a
per
|
formula mass (RFM). The resulting value was again divided by the simulation period to give dissolution rates in mol m−2s−1(Eq. 11).
kdiss=
(mkinit− mkfinal)×1000×t
RFMk×SP (11)
wherekdiss (mol m
−2
s−1) is the dissolution rate of silicate mineral,k,mkinit andmkfinal
are the initial and the final mass (kg m−3) of silicate mineral k, RFMk is the relative
5
formula mass (g mol−1) of mineralk and SP is the simulation period (s). The number 1000 is the conversion factor from kg to g of mineralk.
2.6 Sensitivity analysis
Morris’ sensitivity method (Morris, 1991) was used to assess the sensitivity of average silicate mineral dissolution rates to texture and physical weathering. It is one of the
10
simplest and most widely used sensitivity analysis method (Saltelli et al., 2005). It is computationally cheaper than other sensitivity methods and therefore suitable for es-pecially long run time models such as SoilGen (Finke et al., 2015; Yu et al., 2013). The method basically aims at quantifying the response of model output due to differences in the levels of input parameter (the so called elementary effects). In this study the
lev-15
els include different textures and whether physical weathering is allowed or not. The output of interest in this case is the amount of mineral (Kg m−3) lost over the simulation period due to chemical weathering which is itself influenced by differences in texture and physical weathering. The elementary effects of differences in texture (ui) on the amounts of mineral lost were calculated following Eq. (12) (Morris, 1991). Sensitivity of
20
each silicate mineral was then evaluated by plotting the mean and the standard devia-tions of the elementary effects against each other (in thex andy axis, respectively) for both PhyWE and NoPhyWE scenarios and for each parent material.
ui =Y(x1,x2,x3. . .xi+ ∆xi)−Y(x1,x2,x3. . .xi)
∆xi (12)
BGD
12, 13887–13929, 2015
Evaluating sensitivity of silicate mineral
dissolution rates
E. Opolot and P. A. Finke
Title Page
Abstract Introduction
Conclusions References
Tables Figures
◭ ◮
◭ ◮
Back Close
Full Screen / Esc
Printer-friendly Version Interactive Discussion
Discussion
P
a
per
|
Discussion
P
a
per
|
Discussion
P
a
per
|
Discussion
P
a
per
|
wherex1,x2,x3. . .xi are the different levels of input parameter (i.e., different textures, in this study), ∆xi is the variation imposed on the input parameter measured as the Euclidean distance between two points in the textural triangle andY is the model output in response to each level of input parameter.
3 Results and discussion
5
3.1 pH evolution as a function of parent material
The evolution of pH as a function of parent material is shown in Fig. 3a (Model A) and Fig. 3b for Model B. There is erratic behaviour of pH in the beginning of the simula-tions (between 15 000 and 12 000 years BP) especially under granite. Generally, pH is increasing with depth and decreasing over time across the different parent materials
10
as well as the two different model set ups (i.e, Model A and Model B). pH is generally higher in basalt and peridotite parent materials than granite but only in the first 5000 years of simulation (i.e., up to 10 000 years BP). The trends are however reversed in the subsequent years especially in Model A. There is generally a more gradual evolution of pH under Model B compared to Model A with a generally lower pH under Model A
15
than Model B, when comparing respective parent materials.
The erratic behaviour of pH in the beginning of the simulations (between 15 000 and 12 000 years BP) especially under granite parent material (Fig. 3a, b) could be linked to the sensitivity of dissolution rates to dilution due to variation in precipitation. This period coincides with the drier periods (Fig. 2) with incidences of precipitation deficit
20
in some years. Precipitation deficit means low dilution as well as limited mineral disso-lution and release of cations, consequently keeping the pH low. At the current model version, the assumption is that dissolution occurs at far from equilibrium and thus the effect of the formation of secondary mineral on pH is not yet accounted for. This is cer-tainly a limitation of this study and work is on-going to incorporate this mechanism into
25
BGD
12, 13887–13929, 2015
Evaluating sensitivity of silicate mineral
dissolution rates
E. Opolot and P. A. Finke
Title Page
Abstract Introduction
Conclusions References
Tables Figures
◭ ◮
◭ ◮
Back Close
Full Screen / Esc
Printer-friendly Version Interactive Discussion
Discussion
P
a
per
|
Discussion
P
a
per
|
Discussion
P
a
per
|
Discussion
P
a
per
|
al., 2009; Moore et al., 2012; Zhu, 2005; Zhu et al., 2010) have already demonstrated that solute composition and secondary mineral precipitation controls the reaction affi n-ity of primary minerals. The dissolution rates from this study are therefore expected to be faster than they would if secondary mineral precipitation were to be taken into account. The plunge in pH after 10 000 years BP for basalt and peridotite (Fig. 3a and
5
b) could be linked to the depletion of forsterite at that time and thus less release of Mg2+. Comparing Fig. 3a and b, the effect of mineralogical composition on pH appears to become less in Fig. 3b (particularly after year 10 000 BP; between 500–1400 mm) than in Fig. 3a. This trend is likely due to the cation exchange capacity (CEC) buffering effect on pH in the zone of clay accumulation (Finke, 2012).
10
3.2 Evolution of clay mass fraction
Figure 4a shows the depth distribution of clay mass fraction taken at the final year of simulation (present situation). There is a clear difference between Model A and Model B, with a clear effect of physical weathering (PhyWE; dashed lines) on the amount of clay mass fraction in Model A (particularly in the top 0.3 m depth) where up to 8 % of
15
clay mass is produced due to physical weathering (Fig. 4; texture number 3). The ef-fects of other processes notably clay migration on clay mass fraction is clearly visible in Model B with likely formation of an illuvial horizon (Bt horizon). Physical weathering and clay migration processes in the SoilGen model have been calibrated and their ef-fect on the formation of eluvial (E) and Bt horizons was demonstrated in a modeling
20
approach by Finke (2012). Although the clay contents were generally underestimated, Finke (2012) was able to reproduce the measurements of E and Bt horizon thicknesses by van Ranst (1981) in all the three loess profiles in the Zonian forest (Fig. 4b). Since the chemical and mineralogical analyses presented by van Ranst (1981) did not sup-port any clay new formation, the increase in clay content with time was mainly attributed
25
to physical weathering process. The right part of Fig. 4a shows the clear effect of clay migration process on clay mass fraction. The clay mass that is produced by physical weathering (Fig. 4a, left panel), is subsequently transported from the top
BGD
12, 13887–13929, 2015
Evaluating sensitivity of silicate mineral
dissolution rates
E. Opolot and P. A. Finke
Title Page
Abstract Introduction
Conclusions References
Tables Figures
◭ ◮
◭ ◮
Back Close
Full Screen / Esc
Printer-friendly Version Interactive Discussion
Discussion
P
a
per
|
Discussion
P
a
per
|
Discussion
P
a
per
|
Discussion
P
a
per
|
ments into the lower compartments (through clay migration), forming E and Bt hori-zons (Fig. 4a, right panel), respectively (Finke, 2012). The complete Bt belly could not be shown by our results probably because of our shallow profile which was considered to reduce the run-time of the model.
3.3 Mineral dissolution rates
5
3.3.1 Effect of parent material composition on dissolution rates
Figure 5 shows the effect of parent material composition on the average dissolution rates of K-feldspar, albite, quartz and forsterite over successive time intervals of 500 years. With exception of quartz whose rates were increasing with time, the dissolution rates across the 3 parent materials decrease with time. The dissolution rates of albite
10
and K-feldspar are higher (especially at the beginning of the simulation) under the granite parent material than in basalt and peridotite. Model A dissolution rates across all the minerals are generally higher than the rates from Model B. In granite however, dissolution rates of albite and K-feldspar in Model A between 15 000 and 13 000 years BP are lower than the respective dissolution rates in Model B. From 13 000 years BP
15
until 9000 years the dissolution rates are similar between the two models. In Basalt and peridotite, the dissolution rates of albite and K-feldspar between 13 000 and 9000 years BP are higher in Model B than in Model A. From 9000 until 0 years BP, the dissolution rates of all minerals (except for quartz) across 3 parent materials are generally higher in Model A than in Model B.
20
The properties of the parent material very much influence the chemical weathering rates (Hartmann and Moosdorf, 2011; Navarre-Sitchler and Brantley, 2007; Oliva et al., 2003). Results from this study indicate that the composition of the parent material in-fluences directly the pH of the soil solution in two different ways (i) by the type of cation it releases into the solution (i.e, monovalent, divalent, trivalent) and (ii) by the amount
25
BGD
12, 13887–13929, 2015
Evaluating sensitivity of silicate mineral
dissolution rates
E. Opolot and P. A. Finke
Title Page
Abstract Introduction
Conclusions References
Tables Figures
◭ ◮
◭ ◮
Back Close
Full Screen / Esc
Printer-friendly Version Interactive Discussion
Discussion
P
a
per
|
Discussion
P
a
per
|
Discussion
P
a
per
|
Discussion
P
a
per
|
influence that the parent material has on pH (e.g., interpreting Fig. 3a for Model A and 3b for Model B). The higher dissolution rates (especially in the beginning) of albite and K-feldspar observed in granite compared to basalt and peridotite could therefore be due to lower pH observed in granite than in Basalt and Peridotite at that point in time. The Mg2+ released from forsterite (which is absent in granite) keeps the pH in the soil
5
solution higher in basalt and peridotite than in granite and thus the lower dissolution rates of albite and K-feldspar in basalt and peridotite. The differences in Models A and B across the parent materials also follow the pH trends. For example in granite, the average pH (at 0.5 m depth) in Model B is generally lower than the pH in Model A between 15 000 and 13 000 years BP and therefore higher albite and K-feldspar
dis-10
solution rates and lower quartz dissolution rates in Model B. In basalt and peridotite, the average pH at this period (between 15 000 and 13 000 years BP) is more less the same and therefore the same dissolution rates of albite and K-feldspar between for both Model A and Model B. However between 12 000 and 9000 years BP, the average pH in basalt and peridotite is lower in Model B than in Model A, thus explaining the
15
observed rise in the dissolution rates of albite and K-feldspar in Model B that are not observed in Model A. From 9000 years BP until 0 years BP, Model A dissolution rates of albite, K-feldspar and forsterite are higher than respective rates in Model B owing to the lower pH in Model A (averaged over 0. 5 m) than in Model B (Fig. 3a and b). Quartz is less sensitive to pH less than 6 (Knauss and Wolery, 1988) and thus it’s dissolution
20
rates in Model A and Model B were not any different and did not seem to change from 10 000 until 0 years BP.
3.3.2 Effect of initial texture
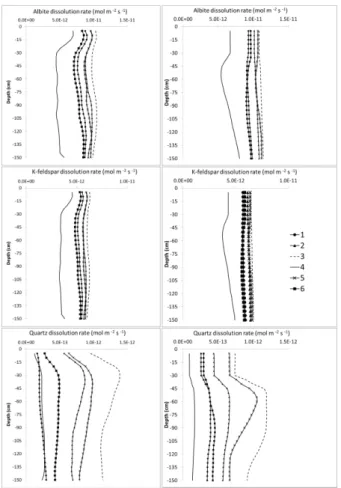
The effect of initial texture on silicate mineral dissolution rates for Model A and Model B is presented in Fig. 6. As would be expected and consistent with previous studies
25
(e.g. Hartmann et al., 2014; Phelan et al., 2014), the mineral dissolution rates are higher for finer textures than for coarse textures because of higher mineral surface area of clay and silt sized particles compared to the sand sized particles. In Model A,
BGD
12, 13887–13929, 2015
Evaluating sensitivity of silicate mineral
dissolution rates
E. Opolot and P. A. Finke
Title Page
Abstract Introduction
Conclusions References
Tables Figures
◭ ◮
◭ ◮
Back Close
Full Screen / Esc
Printer-friendly Version Interactive Discussion
Discussion
P
a
per
|
Discussion
P
a
per
|
Discussion
P
a
per
|
Discussion
P
a
per
|
albite and K-feldspar dissolution rates across all initial textures, generally decrease with depth while dissolution rates of quartz generally increase with depth. In Model B, albite and K-feldspar dissolution rates across all initial textures, are generally constant with depth (except for texture number 4) while dissolution rates of quartz generally follow the same trend as in Model A and increase with depth. These dissolution rate-depth
5
trends are related to pH which is generally increasing with depth. High pH favours quartz dissolution rates and slows down albite and K-feldspar dissolution rates.
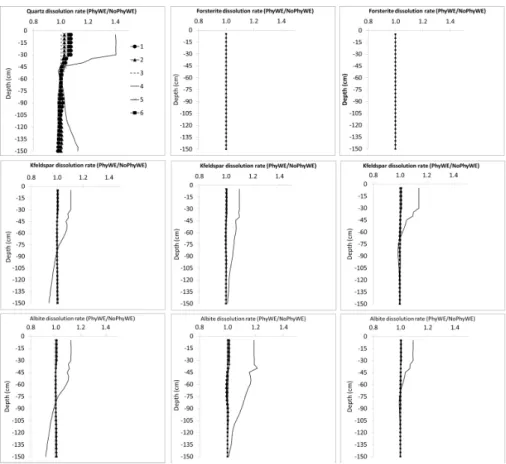
3.3.3 Effect of physical weathering
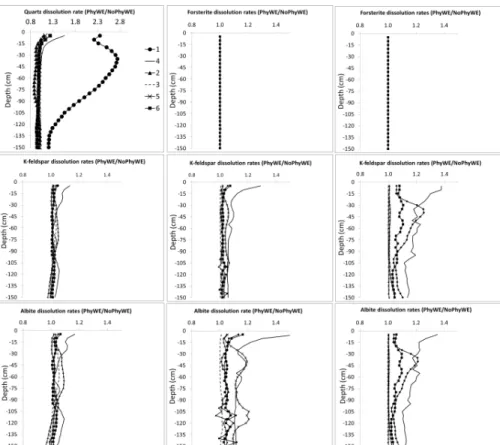
The effect of only physical weathering (Model A) and the integrated effect of all soil forming processes (Model B) on the average silicate dissolution rates are shown in
10
Fig. 7a and b, respectively. The rates are presented as a ratio of physical weathering to no physical weathering (i.e., PhyWE/NoPhyWE) where a value greater than 1 implies higher dissolution rate due to physical weathering. The results (both in Models A and B) indicate that the dissolution rates are generally higher in the top of the profile and de-crease down the soil profile. Except for Forsterite, results in Model A indicate a positive
15
effect of physical weathering on silicate dissolution rates (i.e., PhyWE/NoPhyWE>1). Dissolution rates due to physical weathering are particularly higher in texture num-ber 4 (solid black line) across all the minerals and parent materials with exception of Quartz mineral (in Model A) where dissolution rate due to physical weathering is highest under texture number 1. In Model B however, the effect of physical
weather-20
ing is almost not visible (except for the texture number 4; solid line) as indicated with unity PhyWE/NoPhyWe ratios of all minerals across the different textures. Higher dis-solution rates with no physical weathering compared to with physical weathering (i.e., PhyWE/NoPhyWE<1) were only observed for Albite and K-feldspar below 0.75 m un-der Model B (see Fig. 5b: granite; texture number 4).
25
BGD
12, 13887–13929, 2015
Evaluating sensitivity of silicate mineral
dissolution rates
E. Opolot and P. A. Finke
Title Page
Abstract Introduction
Conclusions References
Tables Figures
◭ ◮
◭ ◮
Back Close
Full Screen / Esc
Printer-friendly Version Interactive Discussion
Discussion
P
a
per
|
Discussion
P
a
per
|
Discussion
P
a
per
|
Discussion
P
a
per
|
the higher the mineral surface area and thus the higher the mineral dissolution rate. This seems to be the case especially for coarse texture (texture number 4) where the dissolution rates of albite and K-feldspar in basalt and peridotite (Fig. 7a) are up to 1.4 times higher with PhyWE compared to NoPhyWE. The effect of physical weathering on the dissolution rates of albite and K-feldspar seems to be more pronounced in basalt
5
and peridotite where pH is relatively higher and thus imposes less dominance on the chemical dissolution rates of albite and K-feldspar. The generally lower pH under gran-ite could explain the higher effect of physical weathering on quartz dissolution rates under coarse textures 1, 4 and 6 (Fig. 7a).
The effect of texture on the dissolution rates could also be indirect through it’s
rela-10
tionship with hydrology. Our results imply that, although the physical weathering pro-cess produced more clay sized particles (Fig. 4, left panel) from already fine textures (i.e., 3 and 5; Table 1), the slowing down of water flow by this fine texture resulted into reduced leaching and higher pH, consequently cancelling out the added effect of phys-ical weathering. Hydrology (water flow) and fluid residence time influence leaching and
15
saturation levels of the soil solution (Moore et al., 2012; Velbel, 1993). According to Moore et al. (2012), hydrology is a key physical extrinsic factor and perhaps one of the most important factors that could explain observed differences between laboratory and field measured rates.
3.3.4 Interactive effects of selected soil forming processes on chemical
20
weathering rates
The interacting soil forming processes that affect chemical weathering and are dis-cussed this study include clay migration, plant uptake, carbon cycling and physical weathering. The results of these processes are presented under Model B (in Figs. 3b, 4 (right panel), 5, 6, 7b, 8 and 9). These processes have both direct and indirect
ef-25
fects on chemical weathering rates (White, 2002) through their influence on texture (e.g. clay migration, physical weathering, bioturbation) and on pH (e.g. clay migration, plant uptake, CO2 production by mineralisation of organic matter). As discussed in
BGD
12, 13887–13929, 2015
Evaluating sensitivity of silicate mineral
dissolution rates
E. Opolot and P. A. Finke
Title Page
Abstract Introduction
Conclusions References
Tables Figures
◭ ◮
◭ ◮
Back Close
Full Screen / Esc
Printer-friendly Version Interactive Discussion
Discussion
P
a
per
|
Discussion
P
a
per
|
Discussion
P
a
per
|
Discussion
P
a
per
|
Finke (2012), clay migration process moves clay mass from the top part of the pro-file into the lower part of the propro-file (Fig. 4, right panel) leading to the formation an argillic (Bt) horizon which slows down water flow thus increasing solute concentration and lowering reaction affinity (Smeck and Ciolkosz, 1989; White and Brantley, 2003). Clay migration processes also has a pH buffering effect (Fig. 3b) through its influence
5
on cation exchange capacity (Finke, 2012). Element cycling through plant uptake and release (through organic matter decomposition) influences the pH and consequently mineral weathering rates (Brady et al., 1999; Drever, 1994; Moulton et al., 2000; Sti-illings et al., 1996). Higher pH that is visible in the top 0.25 m (Fig. 3b) can therefore be attributed to plant nutrient cycling process.
10
3.4 Sensitivity of mineral dissolution rates to physical weathering
Sensitivity of silicate mineral dissolution rates to texture and physical weathering are shown in Fig. 8. Results show low sensitivity (Model A) to no sensitivity of dissolution rates (Model B) due to differences in texture and physical weathering, across different minerals and parent materials. The pH of the soil solution seems to be a dominant
15
factor to the chemical weathering of silicate minerals. In addition, the indirect effect of physical weathering on water flow and thus soil pH seem to oppose and cancel out the direct effects of physical weathering on the mineral surface area (as shown in Fig. 7b) and consequently the mineral dissolution rates.
3.5 Comparison between SoilGen modelled average mineral dissolution rates
20
with Laboratory and field measured rates
SoilGen modelled silicate dissolution rates (Models A and B) were compared with rates obtained from field and laboratory experiments (Fig. 9). Rates plotted are for the whole profile depth (1.5 m) and for all the 6 different texture positions shown in Table 1. These rates are averaged for 15 000 years BP and they generally fall between what is reported
25
BGD
12, 13887–13929, 2015
Evaluating sensitivity of silicate mineral
dissolution rates
E. Opolot and P. A. Finke
Title Page
Abstract Introduction
Conclusions References
Tables Figures
◭ ◮
◭ ◮
Back Close
Full Screen / Esc
Printer-friendly Version Interactive Discussion
Discussion
P
a
per
|
Discussion
P
a
per
|
Discussion
P
a
per
|
Discussion
P
a
per
|
are however generally closer to the laboratory rates than the field measured rates most likely because we assumed far from equilibrium reactions.
There seems to be no difference between dissolution rates from Model A and Model B across different parent materials when looking at the average rates over the whole simulation period of 15 000 years (Fig. 9). However, when the rates are
calcu-5
lated over short time intervals, e.g. 500 years, there is a clear difference at some points in time between the two models and even across different parent materials (see Fig. 5 for example). The evolution of silicate dissolution rates with time (Fig. 5) is not linear and this is in line with other previous studies (e.g. Hodson and Langan, 1999; White and Brantley, 2003). Generally silicate dissolution rates decrease with time due to depletion
10
of reactive surfaces and, the formation of leached layers and secondary minerals (Hod-son and Langan, 1999; White and Brantley, 2003). The compari(Hod-son of dissolution rates obtained at different time scales therefore remains a challenge and could partly explain the significant differences in silicate dissolution rates reported in literature (White and Brantley, 2003). In addition, the various definitions of chemical weathering rates used
15
in different studies e.g. cation chemical weathering rates (CCWR), chemical silicate rock weathering rates (CSRWR) and total chemical weathering rates (TCWR) make it difficult to compare results between studies (Hartmann and Moosdorf, 2011). Interpret-ing and comparInterpret-ing results from different studies should therefore be done with utmost care.
20
In our comparisons (Fig. 9) we chose to use only field and laboratory dissolution rates normalized to BET surface areas because the texture equation (Eq. 6) used to model mineral surface area was based on the calibration study with measured BET surface area (Sverdrup and Warfvinge, 1995). The field and laboratory rates were however not tied to the time scales or parent materials which could also limit our comparisons to
25
some extent. There are also other questions that could be raised and that could poten-tially limit our comparisons with field and laboratory measurements. For example if the calibrations already done for clay migration, physical weathering and carbon cycling processes in the quartz-dominated loess sediment (Zonian forest; Finke, 2012) hold
BGD
12, 13887–13929, 2015
Evaluating sensitivity of silicate mineral
dissolution rates
E. Opolot and P. A. Finke
Title Page
Abstract Introduction
Conclusions References
Tables Figures
◭ ◮
◭ ◮
Back Close
Full Screen / Esc
Printer-friendly Version Interactive Discussion
Discussion
P
a
per
|
Discussion
P
a
per
|
Discussion
P
a
per
|
Discussion
P
a
per
|
for other sites with mafic and ultramafic parent materials? and whether ignoring the differences in climate and the time scales would invalidate the comparison between the dissolution rates from this study and previous studies? To answer such questions requires a more detailed study that is specific to field sites with field data of soil age, sil-icate dissolution rates, climate, hydrology, mineralogy and any other important factors
5
to enable the calibration and validation of the model. Although still challenging, such studies are already feasible on well-studied chronosequences (e.g. Moore et al., 2012). However the intention of these comparisons (Fig. 9) is to show the general trends of our simulations rather than the absolute values.
4 Conclusions and outlook
10
We have used a fully mechanistic soil evolution model (SoilGen) to explore the sensitiv-ity of silicate dissolution rates to the interaction between intrinsic (mineral composition, mineral surface area) and extrinsic factors (climate, physical weathering, clay migra-tion, plant uptake, hydrology). Results from this study have shown consistency with both theoretical understanding of the effects of these factors on chemical weathering,
15
and with observations from experiments and some modelling studies. Our results have demonstrated that although soil solution chemistry (pH) plays a dominant role in de-termining the silicate dissolution rates, all processes that directly or indirectly influence the soil solution composition play a major role in driving silicate dissolution rates. For example, although the sensitivity results did not confirm sensitivity of dissolution rates
20
to physical weathering, the effect of texture (as influenced by physical weathering) on hydrology could have a substantial effect on the water flow, element leaching and con-sequently the pH and silicate dissolution rates.
Our dissolution rates results were in between field and laboratory rates, however they were rather high and closer to the laboratory rates owing to the assumption of far from
25
find-BGD
12, 13887–13929, 2015
Evaluating sensitivity of silicate mineral
dissolution rates
E. Opolot and P. A. Finke
Title Page
Abstract Introduction
Conclusions References
Tables Figures
◭ ◮
◭ ◮
Back Close
Full Screen / Esc
Printer-friendly Version Interactive Discussion
Discussion
P
a
per
|
Discussion
P
a
per
|
Discussion
P
a
per
|
Discussion
P
a
per
|
ings are important and challenge us to include secondary mineral precipitation mech-anism in the model and perform comparative study to quantify these effects. Further-more, calibration and validation of the model to the sites with detailed chronosequence data (soil age, silicate dissolution rates, climate, hydrology, mineralogy) is needed.
Despite the limitations identified, this study is another important step to demonstrate
5
the critical need to couple different soil forming processes with chemical weathering in order to explain differences between silicate dissolution rates measured in the lab-oratory and in the field. In summary, results showed an inverse relationship of silicate mineral dissolution rates with time, an obvious effect of texture and, an indirect but sub-stantial effect of physical weathering on silicate dissolution rates. Additionally, results
10
have shown that clay migration and plant nutrient recycling processes influence the pH and thus the silicate dissolution rates.
Code availability
The SoilGen model is freely available. The manual and the programs for previ-ous versions can be downloaded at: http://users.ugent.be/~pfinke/index_bestanden/
15
Page1167.htm. SoilGen2.25 version is not yet available on the website but can be ob-tained on request (by sending an email to [email protected]).
Author contributions. Peter Finke developed the model code and designed the research.
Em-manuel Opolot contributed to the model code development (weathering module), performed the simulations and prepared the manuscript with continuous and valuable contribution from 20
Peter Finke.
Acknowledgements. This work is part of the PhD project under the theme “The Soil System
Under Global change, SOGLO” and funded by the Belgian Science Policy Office (project BEL-SPO/IUAP p7/24).
BGD
12, 13887–13929, 2015
Evaluating sensitivity of silicate mineral
dissolution rates
E. Opolot and P. A. Finke
Title Page
Abstract Introduction
Conclusions References
Tables Figures
◭ ◮
◭ ◮
Back Close
Full Screen / Esc
Printer-friendly Version Interactive Discussion
Discussion
P
a
per
|
Discussion
P
a
per
|
Discussion
P
a
per
|
Discussion
P
a
per
|
References
Anderson, S. P., von Blanckenburg, F., and White, a. F.: Physical and Chemical Controls on the Critical Zone, Elements, 3, 315–319, 2007.
Beaulieu, E., Goddéris, Y., Labat, D., Roelandt, C., Calmels, D., and Gaillardet, J.: Modeling of water-rock interaction in the Mackenzie basin: Competition between sulfuric and carbonic 5
acids, Chem. Geol., 289, 114–123, 2011.
Blum A. E. and Stillings L. L. Feldspar dissolution kinetics, in: Chemical Weathering Rates of Silicate Minerals, edited by: White, A. F. and Brantley, S. L., Mineral. Soc. Am., 31, 291–351, 1995.
Brady, P. V. and Walther, J. V.: Kinetics of quartz dissolution at low temperatures, Chem. Geol., 10
82, 253–264, 1990.
Brady, P. V., Dorn, R. I., Brazel, A. J., Clark, J., Moore, R. B., and Glidewell, T.: Direct mea-surement of the combined effects of lichen, rainfall, and temperature onsilicate weathering, Geochim. Cosmochim. Acta, 63, 3293–3300, 1999.
Brantley, S. L.: Reaction kinetics of primary rock-forming minerals under ambient conditions, 15
in: Treatise on Geochemistry (Surface and ground water, weathering, and soils), edited by: Drever, J. I., Elsevier Pergamon, San Diego, CA, 73–118, 2003.
Brantley, S. L., Kubicki, J. D., and White, A. F.: Kinetics of Water-Rock Interaction, Springer Science+Business Media, LLC, 2008.
Carey, A. E., Lyons, W. B., and Owen, J. S.: Significance of landscape age, uplift, and weath-20
ering rates to ecosystem development, Aquat. Geochemistry, 11, 215–239, 2005.
Casey, W. H., Banfield, J. F., Westrich, H. R., and McLaughlin, L.: What do dissolution experi-ments tell us about natural weathering?, Chem. Geol., 105, 1–15, 1993.
Chou, L. and Wollast, R.: Steady-state kinetics and dissolution mechanism of albite, Am. J. Sci, 285, 963–993, 1985.
25
Cross, W., Iddings, J. P., Pirsson, L. V., and Washington, H. S.: A quantitative chemico-mineralogical classification and nomenclature of igneous rocks, J. Geology, 10, 555–690, 1902.
Dixon, J. L. and von Blanckenburg, F.: Soils as pacemakers and limiters of global silicate weath-ering, Comptes Rendus Geosci., 344, 597–609, 2012.
30
Dove, P. M.: The dissolution kinetics of quartz in sodium-chloride solutions at 25◦
BGD
12, 13887–13929, 2015
Evaluating sensitivity of silicate mineral
dissolution rates
E. Opolot and P. A. Finke
Title Page
Abstract Introduction
Conclusions References
Tables Figures
◭ ◮
◭ ◮
Back Close
Full Screen / Esc
Printer-friendly Version Interactive Discussion
Discussion
P
a
per
|
Discussion
P
a
per
|
Discussion
P
a
per
|
Discussion
P
a
per
|
Drever, J. I.: The effect of land plants on weathering rates of silicate minerals, Geochim. Cos-mochim. Acta, 58, 2325–2332, 1994.
Eyring, H.: The activated complex in chemical reactions, J. Chem. Phys., 3, 107–115, 1935. Finke, P. A.: Modeling the genesis of luvisols as a function of topographic position in loess
parent material, Quaternary Int., 265, 3–17, 2012. 5
Finke, P. A. and Hutson, J. L.: Modelling soil genesis in calcareous loess, Geoderma, 145, 462–479, 2008.
Finke, P. A., Vanwalleghem, T., Opolot, E., Poesen, J., and Deckers, J.: Estimating the effect of tree uprooting on variation of soil horizon depth by confronting pedogenetic simulations to measurements in a Belgian loess area, J. Geophys. Res. Earth Surf., 118, 2124–2139, 10
2013.
Finke, P. A., Samouëlian, A., Suarez-Bonnet, M., Laroche, B., and Cornu, S. S.: Assessing the usage potential of SoilGen2 to predict clay translocation under forest and agricultural land uses, Eur. J. Soil Sci., 66, 194–205, 2015.
Ganor, J., Lu, P., Zheng, Z., and Zhu, C.: Bridging the gap between laboratory measurements 15
and field estimations of silicate weathering using simple calculations, Environ. Geol., 53, 599–610, 2007.
Goddéris, Y., François, L. M., Probst, A., Schott, J., Moncoulon, D., Labat, D., and Viville, D.: Modelling weathering processes at the catchment scale: The WITCH numerical model, Geochim. Cosmochim. Acta, 70, 1128–1147, 2006.
20
Goddéris, Y., Brantley, S. L., François, L. M., Schott, J., Pollard, D., Déqué, M., and Dury, M.: Rates of consumption of atmospheric CO2through the weathering of loess during the next 100 yr of climate change, Biogeosciences, 10, 135–148, doi:10.5194/bg-10-135-2013, 2013. Gudbrandsson, S., Wolff-Boenisch, D., Gislason, S. R., and Oelkers, E. H.: An
experimen-tal study of crysexperimen-talline basalt dissolution from 26pH611 and temperatures from 5 to 75◦C, 25
Geochim. Cosmochim. Acta, 75, 5496–5509, 2011.
Hamilton I. P., Pantano C. G., and Brantley S. L.: Dissolution of albite glass and crystal. Geochim. Cosmochim. Acta, 64, 2603–2615, 2000.
Hartmann, J. and Moosdorf, N.: Chemical weathering rates of silicate-dominated lithologi-cal classes and associated liberation rates of phosphorus on the Japanese Archipelago-30
Implications for global scale analysis, Chem. Geol., 287, 125–157, 2011.
Hartmann, J., West, A. J., Renforth, P., Köhler, P., Rocha, C. L. D. La, Wolf-gladrow, D. A., Dürr, H. H., and Scheffran, J.: enhanced chemical weathering as a geoengineering strategy to
BGD
12, 13887–13929, 2015
Evaluating sensitivity of silicate mineral
dissolution rates
E. Opolot and P. A. Finke
Title Page
Abstract Introduction
Conclusions References
Tables Figures
◭ ◮
◭ ◮
Back Close
Full Screen / Esc
Printer-friendly Version Interactive Discussion
Discussion
P
a
per
|
Discussion
P
a
per
|
Discussion
P
a
per
|
Discussion
P
a
per
|
reduce atmospheric carbon dioxide, supply nutrients, and mitigate ocean acidification, Rev. Geophys., 51, 113–149, doi:10.1002/rog.20004.1.Institute, 2013.
Hartmann, J., Moosdorf, N., Lauerwald, R., Hinderer, M., and West, a. J.: Global chemical weathering and associated P-release – The role of lithology, temperature and soil properties, Chem. Geol., 363, 145–163, 2014.
5
Harris, P. G., Reay, A., and White, G. I.: Chemical composition of the upper mantle, J. Geophys. Res., 72, 6359–6369, 1967.
Hellevang, H., Pham, V. T. H., and Aagaard, P.: Kinetic modelling of CO2–water–rock interac-tions, Int. J. Greenh. Gas Control, 15, 3–15, 2013.
Hodson, M. E. and Langan, S. J.: The influence of soil age on calculated mineral weathering 10
rates, Appl. Geochem., 14, 387–394, 1999.
Holdren Jr., G. R. and Speyer, P. M.: Reaction rate surface area relationships during the early stages of weathering, II. Data on eight additional feldspars, Geochim. Cosmochim. Acta, 51, 2311–2318, 1987.
Jenny, H.: Factors of Soil Formation: A System of Quantitative Pedology, McGraw-Hill, New 15
York, 281 pp., 1941.
Jenkinson, D. S. and Coleman, K.: Calculating the annual input of organic matter to soil from measurements of total organic carbon and radiocarbon, Europ. J. Soil Sci., 45, 167–174, 1994.
Kelsey, C. H.: Calculation of the CIPW norm, Mineralogical Magazine, 34, 276–282, 1965. 20
Knauss, K. G. and Thomas, J. W.: The dissolution kinetics of quartz as a function of pH and time at 70◦C, Geochim. Cosmochim. Acta, 52, 43–53, 1988.
Koptsik, G., Teveldal, S., Aamlid, D., and Venn, K.: Calculations of weathering rate and soil solution chemistry for forest soils in the Norwegian-Russian border area with the PROFILE model, Appl. Geochem., 14, 173–185, 1999.
25
Koseva, I. S., Watmough, S. A., and Aherne, J.: Estimating base cation weathering rates in Canadian forest soils using a simple texture-based model, Biogeochemistry, 101, 183–196, 2010.
Lee, S. and Schnoor, J. L.: Reactions that modify chemistry in lakes of the National Surface Water Survey, Environ. Sci. Technol., 22, 190–195, 1988.
30